

Top 10 sensitivity analysis ebit PowerPoint Presentation Templates in 2026
An SEO service proposal is a crucial document that outlines the strategies and tactics an SEO agency will implement to improve a client's online visibility and search engine rankings. Utilizing a well-structured PPT template for this proposal can enhance clarity and engagement. The presentation should begin with an executive summary, providing an overview of the client's current SEO status and the proposed approach. Key sections might include an analysis of the client's website, competitive landscape, and target audience. The use of visuals, such as graphs and charts, can effectively illustrate data on keyword rankings, traffic sources, and potential growth projections. Highlighting past successes through case studies can build credibility and demonstrate the agency's expertise. Additionally, including a detailed timeline for the implementation of strategiessuch as on-page optimization, content creation, and link-buildinghelps set clear expectations. A well-crafted SEO service proposal in PPT format allows for easy customization, enabling agencies to tailor their presentations to specific clients and industries. This adaptability ensures that the proposal resonates with the client's unique needs, ultimately increasing the chances of securing the contract and fostering a successful partnership.


Bmw group ebit 2014-18
This is a professionally designed visual chart for BMW Group EBIT 2014 to 18. This is part of our Data and Statistics products selection, and you will need a Paid account to download the actual report with accurate data and sources. Downloaded report will contain the editable graph with accurate data, an excel table with the actual data, the exact source of the data and the release date. This slide provides a graph of EBIT in and millions along with Percentage of Revenue of the company BMW Group from the years 2014 to 18. Download it immediately and use it for your business.

Try Before you Buy Download Free Sample Product
 Save Hours of Time
 100% Editable
 Compatible with Google Slides
-
Product Description

-
Display your handiwork on our BMW Group EBIT 2014-18. You will garner a lot of appreciation.
-
Related keywords


Volkswagen ag ebit 2014-18
This is a professionally designed visual chart for Volkswagen Ag Ebit 2014 to 18. This is part of our Data and Statistics products selection, and you will need a Paid account to download the actual report with accurate data and sources. Downloaded report will contain the editable graph with accurate data, an excel table with the actual data, the exact source of the data and the release date. This slide provides a graph of EBIT in JPY millions along with percent of Revenue and CAGR in percent of the company Volkswagen AG from the years 2014 to 18. Download it immediately and use it for your business.
Try Before you Buy Download Free Sample Product
Save Hours of Time
100% Editable
Compatible with Google Slides
-
Product Description
-
This slide provides a graph of EBIT in JPY millions along with percent of Revenue and CAGR in percent of the company Volkswagen AG from the years 2014 to 18.
-
Related keywords




Risk sensitivity analysis diagram presentation backgrounds
Presenting risk sensitivity analysis diagram presentation backgrounds. This is a risk sensitivity analysis diagram presentation backgrounds. This is a five stage process. The stages in this process are evaluate, identify, analyses, budget, activates.
Try Before you Buy Download Free Sample Product
Save Hours of Time
100% Editable
Compatible with Google Slides


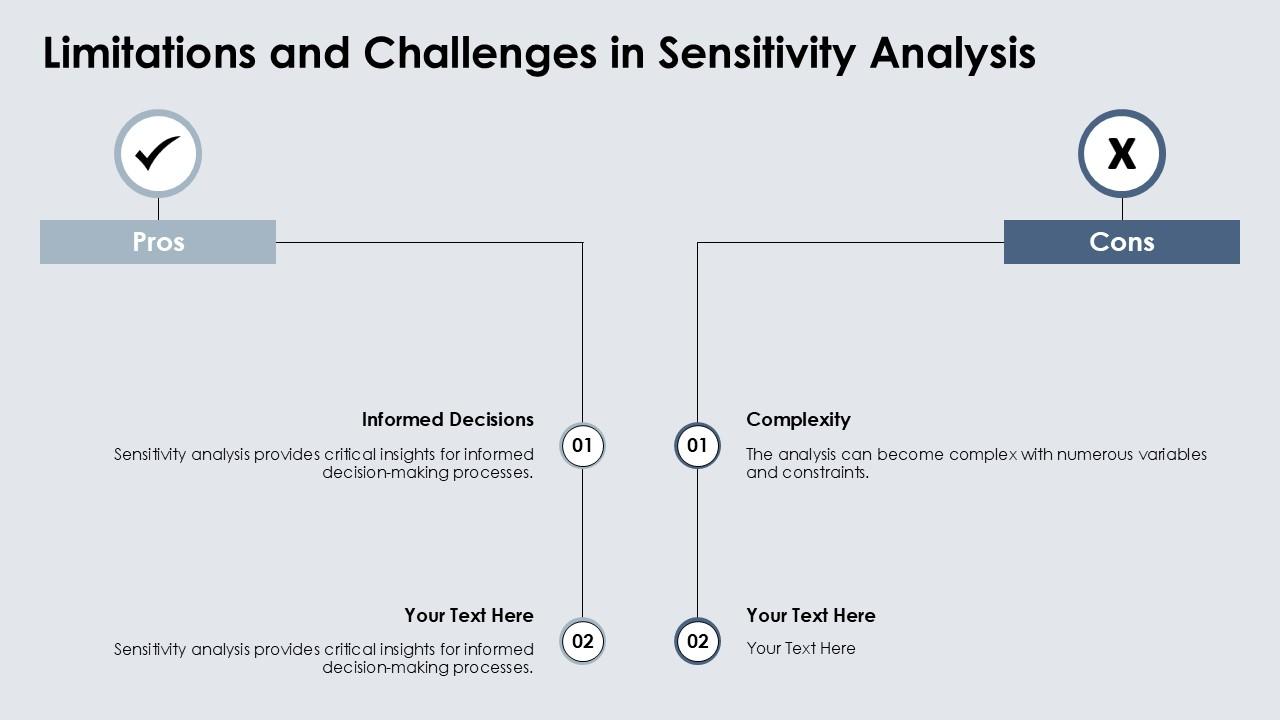









Linear Programming Sensitivity Analysis PPT Sample ACP
Step up your game with our enchanting Linear Programming Sensitivity Analysis PPT Sample ACP deck, guaranteed to leave a lasting impression on your audience. Crafted with a perfect balance of simplicity, and innovation, our deck empowers you to alter it to your specific needs. You can also change the color theme of the slide to mold it to your companys specific needs. Save time with our ready-made design, compatible with Microsoft versions and Google Slides. Additionally, its available for download in various formats including JPG, JPEG, and PNG. Outshine your competitors with our fully editable and customized deck.
Try Before you Buy Download Free Sample Product
Save Hours of Time
100% Editable
Compatible with Google Slides
-
Product Description
-
Unlock the power of decision-making with our Linear Programming Sensitivity Analysis PowerPoint Presentation Deck. This comprehensive sample covers key concepts, methodologies, and practical applications, enabling professionals to analyze and interpret sensitivity in linear models effectively. Enhance your presentations with clear visuals and expert insights. Perfect for academics and industry leaders.
-
Related keywords
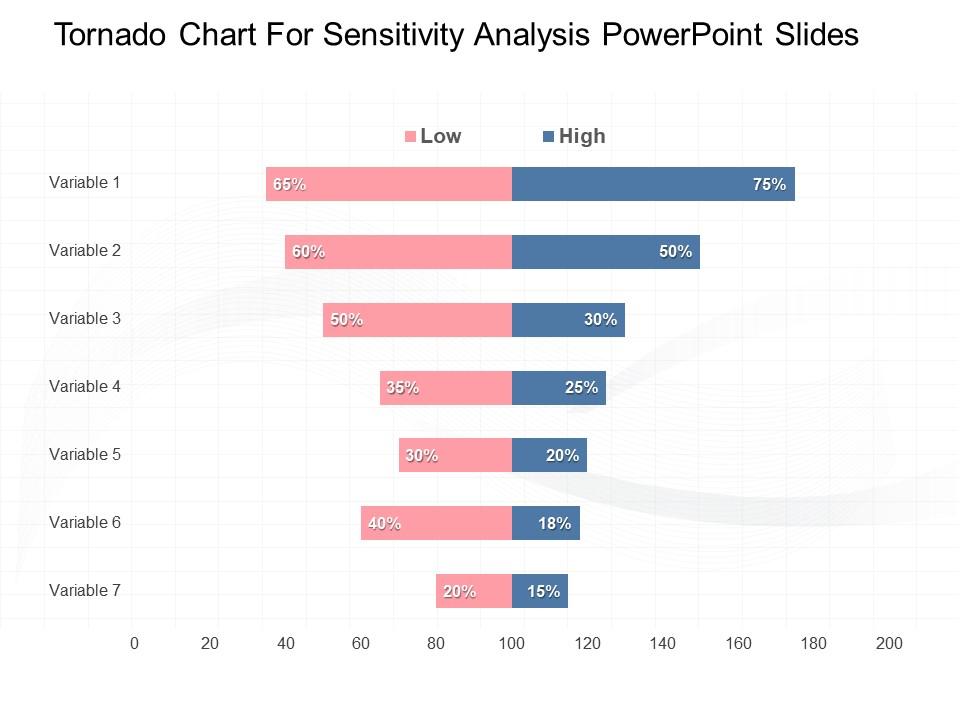



Tornado chart for sensitivity analysis powerpoint slides
Presenting tornado chart for sensitivity analysis PowerPoint slides PPT slide. This plethora of professionally crafted slides is thoroughly editable. You may modify the content at your personal comfort and need. Personalize it with your company name and logo. You may download and save the presentation in the desired format. PPT is compatible with a wide variety of online and offline software options.
Try Before you Buy Download Free Sample Product
Save Hours of Time
100% Editable
Compatible with Google Slides
-
Product Description
-
A tornado chart is a type of sensitivity analysis that provides a graphical representation of the degree to which the result is sensitive to the specified independent variables. Tornado chart for sensitivity analysis PowerPoint slides is one such concept-based slide design for professionals and students to relate to the subject. Often the busy professionals fall short of time because of which they are not able to come up with unique presentation designs, although they want to. At such times, SlideTeam is your rescuer. You name the template or layout you need, and we have it. Our ocean of slides is so vast that one needs to dive in and come up with a unique slide design. The slide butterfly chart PPT model is predesigned and hence also saves a lot of your time and efforts. Avoid attrition with our Tornado Chart For Sensitivity Analysis Powerpoint Slides. They help create a bunch of faithful employees.


Britvic plc adjusted ebit 2014-18
This is a professionally designed visual chart for Britvic Plc Adjusted Ebit 2014 to 18. This is part of our Data and Statistics products selection, and you will need a Paid account to download the actual report with accurate data and sources. Downloaded report will contain the editable graph with accurate data, an excel table with the actual data, the exact source of the data and the release date. This slide provides a graph of Adjusted EBIT in JPY millions along with percent of Revenue and CAGR in percent of the company Britvic PLC from the years 2014 to 18. Download it immediately and use it for your business.
Try Before you Buy Download Free Sample Product
Save Hours of Time
100% Editable
Compatible with Google Slides
-
Product Description
-
Time to bring your presentations to the next level. Britvic Plc Adjusted Ebit 2014-18 are on hand to upgrade your presentations.
-
Related keywords


Tesla inc ebit comparison 2018
This is a professionally designed visual chart for Tesla Inc Ebit Comparison 2018. This is part of our Data and Statistics products selection, and you will need a Paid account to download the actual report with accurate data and sources. Downloaded report will contain the editable graph with accurate data, an excel table with the actual data, the exact source of the data and the release date. This slide shows EBIT Comparison of Tesla Inc with its competitors for the year 2018. Download it immediately and use it for your business.
Try Before you Buy Download Free Sample Product
Save Hours of Time
100% Editable
Compatible with Google Slides
-
Product Description
-
This slide shows EBIT Comparison of Tesla Inc with its competitors for the year 2018.
-
Related keywords


Hyundai motor company ebit 2014-18
This is a professionally designed visual chart for Hyundai Motor Company Ebit 2014 to 18. This is part of our Data and Statistics products selection, and you will need a Paid account to download the actual report with accurate data and sources. Downloaded report will contain the editable graph with accurate data, an excel table with the actual data, the exact source of the data and the release date. This slide provides a graph of EBIT in billions of Korean Won along with percent of Revenue and CAGR in percent of the Hyundai Motor Company from the years 2014 to 18. Download it immediately and use it for your business.
Try Before you Buy Download Free Sample Product
Save Hours of Time
100% Editable
Compatible with Google Slides
-
Product Description
-
This slide provides a graph of EBIT in billions of Korean Won along with percent of Revenue and CAGR in percent of the Hyundai Motor Company from the years 2014 to 18.
-
Related keywords

Sensitivity Analysis In Error Propagation Error Analysis PPT Template ACP
Increase audience engagement and knowledge by dispensing information using Sensitivity Analysis In Error Propagation Error Analysis PPT Template ACP This template helps you present information on three stages. You can also present information on Sensitivity Analysis, Error Propagation, Statistical Analysis, Data Uncertainty using this PPT design. This layout is completely editable so personaize it now to meet your audiences expectations.
Try Before you Buy Download Free Sample Product
Save Hours of Time
100% Editable
Compatible with Google Slides
-
Product Description
-
Elevate your presentations with our Sensitivity Analysis in Error Propagation PowerPoint Template. This professional deck features customizable slides, clear visuals, and comprehensive content to effectively communicate complex concepts. Ideal for academics and professionals, it simplifies error analysis, enhancing understanding and engagement in your discussions. Perfect for any audience
-
Related keywords

Sensitivity Analysis In Numerical Methods Error Analysis PPT Mockup ACP
Introducing Sensitivity Analysis In Numerical Methods Error Analysis PPT Mockup ACP to increase your presentation threshold. Encompassed with eight stages, this template is a great option to educate and entice your audience. Dispence information on Numerical Stability, Error Propagation, Parameter Sensitivity, Computational Modeling, using this template. Grab it now to reap its full benefits.
Try Before you Buy Download Free Sample Product
Save Hours of Time
100% Editable
Compatible with Google Slides
-
Product Description
-
Explore our comprehensive PowerPoint presentation deck on Sensitivity Analysis in Numerical Methods and Error Analysis. This professional mockup features clear visuals, detailed explanations, and practical examples, making complex concepts accessible. Perfect for academics and professionals seeking to enhance their understanding of numerical methods and error assessment.
-
Related keywords