Visualization Research Branches Data Visualization Helps In Academic Research
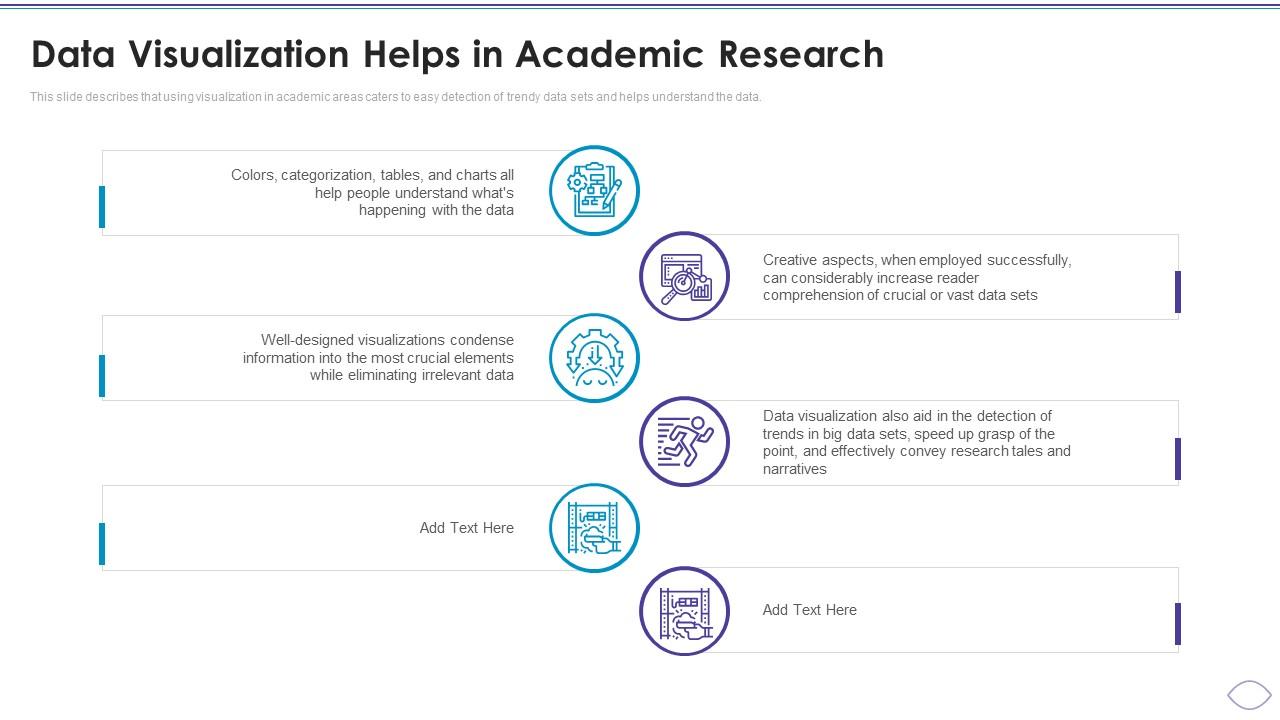
This slide describes that using visualization in academic areas caters to easy detection of trendy data sets and helps understand the data.
This slide describes that using visualization in academic areas caters to easy detection of trendy data sets and helps unde..
- Google Slides is a new FREE Presentation software from Google.
- All our content is 100% compatible with Google Slides.
- Just download our designs, and upload them to Google Slides and they will work automatically.
- Amaze your audience with SlideTeam and Google Slides.
-
Want Changes to This PPT Slide? Check out our Presentation Design Services
- WideScreen Aspect ratio is becoming a very popular format. When you download this product, the downloaded ZIP will contain this product in both standard and widescreen format.
-

- Some older products that we have may only be in standard format, but they can easily be converted to widescreen.
- To do this, please open the SlideTeam product in Powerpoint, and go to
- Design ( On the top bar) -> Page Setup -> and select "On-screen Show (16:9)” in the drop down for "Slides Sized for".
- The slide or theme will change to widescreen, and all graphics will adjust automatically. You can similarly convert our content to any other desired screen aspect ratio.
Compatible With Google Slides

Get This In WideScreen
You must be logged in to download this presentation.
PowerPoint presentation slides
This slide describes that using visualization in academic areas caters to easy detection of trendy data sets and helps understand the data. Increase audience engagement and knowledge by dispensing information using six. This template helps you present information on six stages. You can also present information on Data, Crucial, Employed Successfully, Eliminating Irrelevant Data, Tales And Narratives using this PPT design. This layout is completely editable so personaize it now to meet your audiences expectations.
People who downloaded this PowerPoint presentation also viewed the following :
Visualization Research Branches Data Visualization Helps In Academic Research with all 6 slides:
Use our Visualization Research Branches Data Visualization Helps In Academic Research to effectively help you save your valuable time. They are readymade to fit into any presentation structure.
-
Easy to use and customize templates. Helped me give a last minute presentation.
-
I was confident and well prepared for my presentation for the first time ever. With SlideTeam’s templates, I could deliver one of my best presentations. Will be coming back for more!


