

Web analytics kpi for active average group joined members powerpoint slide





Try Before you Buy Download Free Sample Product
 Impress Your
Audience
 100%
Editable
 Save Hours
of Time


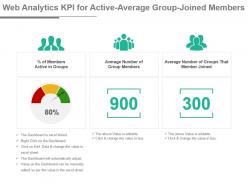
Develop a cohesive approach using our, web analytics kpi for active average group joined members PowerPoint slide. Comprising the concept of performance indication this PPT displays a percentage indicator and employee’s icons to display growth indication related concepts like, percentage of members active in a group, average number of group members, average number of groups that member joined. Three Key Performance Indicators or KPIs in a Dashboard style design are shown here. These KPI PowerPoint designs are all data driven, and the state automatically adjusts according to your data. Use this PPT layout to keep a track on your services and employee status, as it helps in monitoring and to evaluate the efficiency of all your business processes. This kpi PPT contributes in finding the causes and its solution also, helps in taking your business to the new heights, recognize the new and successful business opportunities. Get folks to indulge in a bit of humor with our Web Analytics Kpi For Active Average Group Joined Members Powerpoint Slide. It will create a jovial atmosphere.
People who downloaded this PowerPoint presentation also viewed the following :
Web analytics kpi for active average group joined members powerpoint slide with all 6 slides:
Investigate any incident with our Web Analytics Kpi For Active Average Group Joined Members Powerpoint Slide. Display genuine interest in identifying the cause.


-
Informative presentations that are easily editable.
-
Understandable and informative presentation.