Wendys key income statement and balance sheet statistics 2018
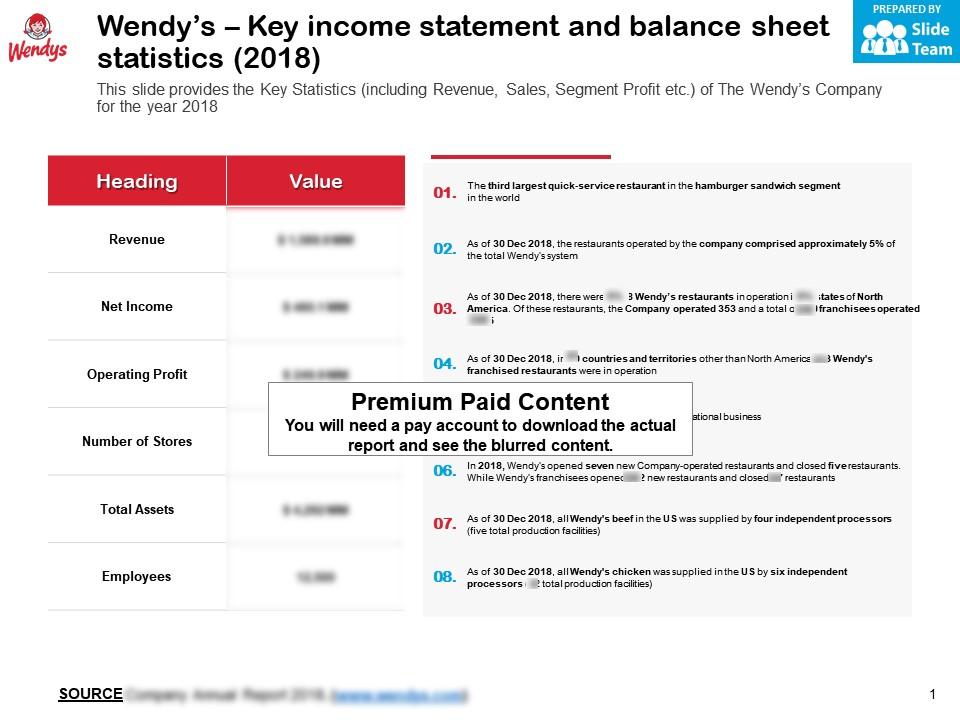
This slide provides the Key Statistics including Revenue Sales Segment Profit etc of The Wendys Company for the year 2018.
- Google Slides is a new FREE Presentation software from Google.
- All our content is 100% compatible with Google Slides.
- Just download our designs, and upload them to Google Slides and they will work automatically.
- Amaze your audience with SlideTeam and Google Slides.
-
Want Changes to This PPT Slide? Check out our Presentation Design Services
- WideScreen Aspect ratio is becoming a very popular format. When you download this product, the downloaded ZIP will contain this product in both standard and widescreen format.
-

- Some older products that we have may only be in standard format, but they can easily be converted to widescreen.
- To do this, please open the SlideTeam product in Powerpoint, and go to
- Design ( On the top bar) -> Page Setup -> and select "On-screen Show (16:9)” in the drop down for "Slides Sized for".
- The slide or theme will change to widescreen, and all graphics will adjust automatically. You can similarly convert our content to any other desired screen aspect ratio.
Compatible With Google Slides

Get This In WideScreen
You must be logged in to download this presentation.
PowerPoint presentation slides
The information presented in this slide has been researched by our team of professional business analysts. This is part of our Company Profiles products selection, and you will need a Paid account to download the actual report with accurate data and sources. Downloaded report will be in Powerpoint and will contain the actual editable slides with the actual data and sources for each data. This slide provides the Key Statistics including Revenue Sales Segment Profit etc of The Wendys Company for the year 2018. Download it immediately and use it for your business.
People who downloaded this PowerPoint presentation also viewed the following :
Content of this Powerpoint Presentation
Description:
The image is a PowerPoint slide titled "Wendy's Key income statement and balance sheet statistics (2018)" which provides an overview of The Wendy's Company's financial performance for the year 2018. The slide is segmented into two main sections: the left section displays a table with key financial metrics, while the right section enumerates specific details and contextual information about the company's operations.
In the table, six financial headings are listed with their corresponding values Revenue ($1.59B), Net Income ($460.1M), Operating Profit ($411.9M), Number of Stores (information blurred), Total Assets ($4.54B), and Employees (information blurred).
On the right, there are eight points providing additional information that adds context to the table. These include statements such as the company's market position, the percentage of Wendy's restaurants in operation, and data about their international presence. Furthermore, there is mention of the company's operational developments, such as new openings and closures, supply chain information, and a disclaimer indicating that certain content is premium and requires a paid account to access the complete report.
Use Cases:
These types of slides can be applied across various industries, especially for the following use cases:
1. Fast Food:
Use: Financial review meeting
Presenter: Company's financial analyst
Audience: Internal management team
2. Investing:
Use: Investment analysis presentation
Presenter: Financial advisor or investment analyst
Audience: Potential investors or investment firm representatives
3. Market Research:
Use: Industry benchmarking report
Presenter: Market research analyst
Audience: Marketing department or stakeholders
4. Business Education:
Use: Teaching financial statement analysis
Presenter: Educator or business instructor
Audience: Business students
5. Corporate Governance:
Use: Shareholder meeting presentation
Presenter: Senior executive or CFO
Audience: Shareholders and board members
6. Franchise Management:
Use: Franchise performance overview
Presenter: Franchise operations manager
Audience: Franchisees and franchise development team
7. Supply Chain Management:
Use: Supply chain efficiency analysis
Presenter: Supply chain analyst or logistics manager
Audience: Supply chain management team and strategic partners
Wendys key income statement and balance sheet statistics 2018 with all 2 slides:
Hit the jackpot with our Wendys Key Income Statement And Balance Sheet Statistics 2018. Your coffers are bound to get filled.
No Reviews


