Year over year key financials creating business monopoly ppt powerpoint presentation diagrams
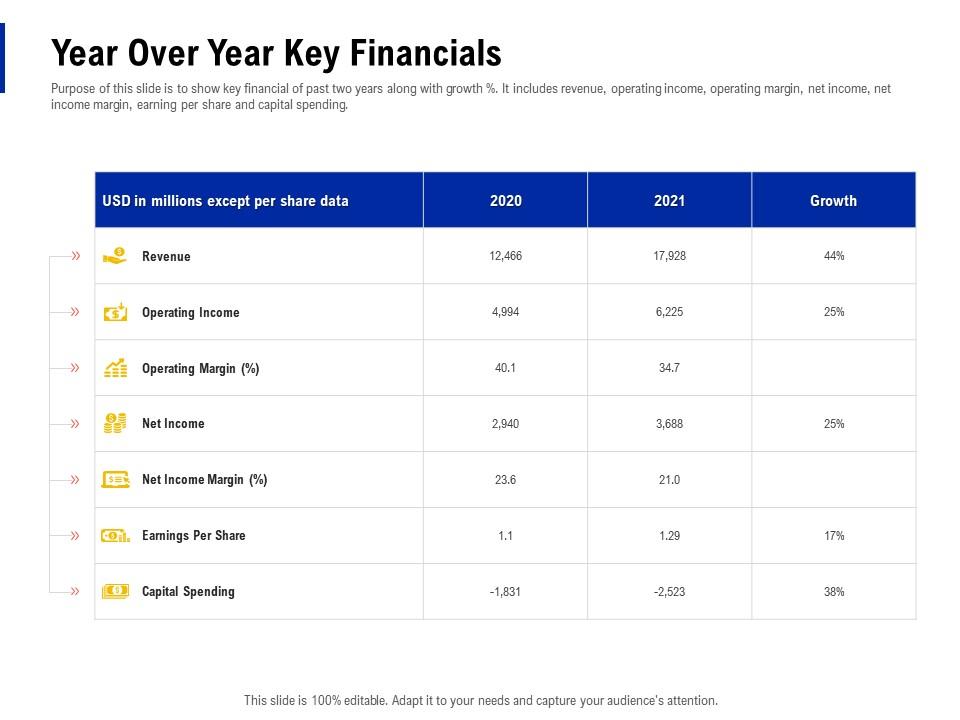
Purpose of this slide is to show key financial of past two years along with growth percent. It includes revenue, operating income, operating margin, net income, net income margin, earning per share and capital spending.
Purpose of this slide is to show key financial of past two years along with growth percent. It includes revenue, operating ..
- Google Slides is a new FREE Presentation software from Google.
- All our content is 100% compatible with Google Slides.
- Just download our designs, and upload them to Google Slides and they will work automatically.
- Amaze your audience with SlideTeam and Google Slides.
-
Want Changes to This PPT Slide? Check out our Presentation Design Services
- WideScreen Aspect ratio is becoming a very popular format. When you download this product, the downloaded ZIP will contain this product in both standard and widescreen format.
-

- Some older products that we have may only be in standard format, but they can easily be converted to widescreen.
- To do this, please open the SlideTeam product in Powerpoint, and go to
- Design ( On the top bar) -> Page Setup -> and select "On-screen Show (16:9)” in the drop down for "Slides Sized for".
- The slide or theme will change to widescreen, and all graphics will adjust automatically. You can similarly convert our content to any other desired screen aspect ratio.
Compatible With Google Slides

Get This In WideScreen
You must be logged in to download this presentation.
PowerPoint presentation slides
Purpose of this slide is to show key financial of past two years along with growth percent. It includes revenue, operating income, operating margin, net income, net income margin, earning per share and capital spending. Present the topic in a bit more detail with this Year Over Year Key Financials Creating Business Monopoly Ppt Powerpoint Presentation Diagrams. Use it as a tool for discussion and navigation on Revenue, Operating Income, Capital Spending, Net Income. This template is free to edit as deemed fit for your organization. Therefore download it now.
People who downloaded this PowerPoint presentation also viewed the following :
Year over year key financials creating business monopoly ppt powerpoint presentation diagrams with all 2 slides:
Use our Year Over Year Key Financials Creating Business Monopoly Ppt Powerpoint Presentation Diagrams to effectively help you save your valuable time. They are readymade to fit into any presentation structure.
-
Perfect template with attractive color combination.
-
Use of different colors is good. It's simple and attractive.
-
Excellent work done on template design and graphics.
-
Use of different colors is good. It's simple and attractive.
-
Best way of representation of the topic.


