Yearly Net Income Statement Graph With Revenue And Operating Margin
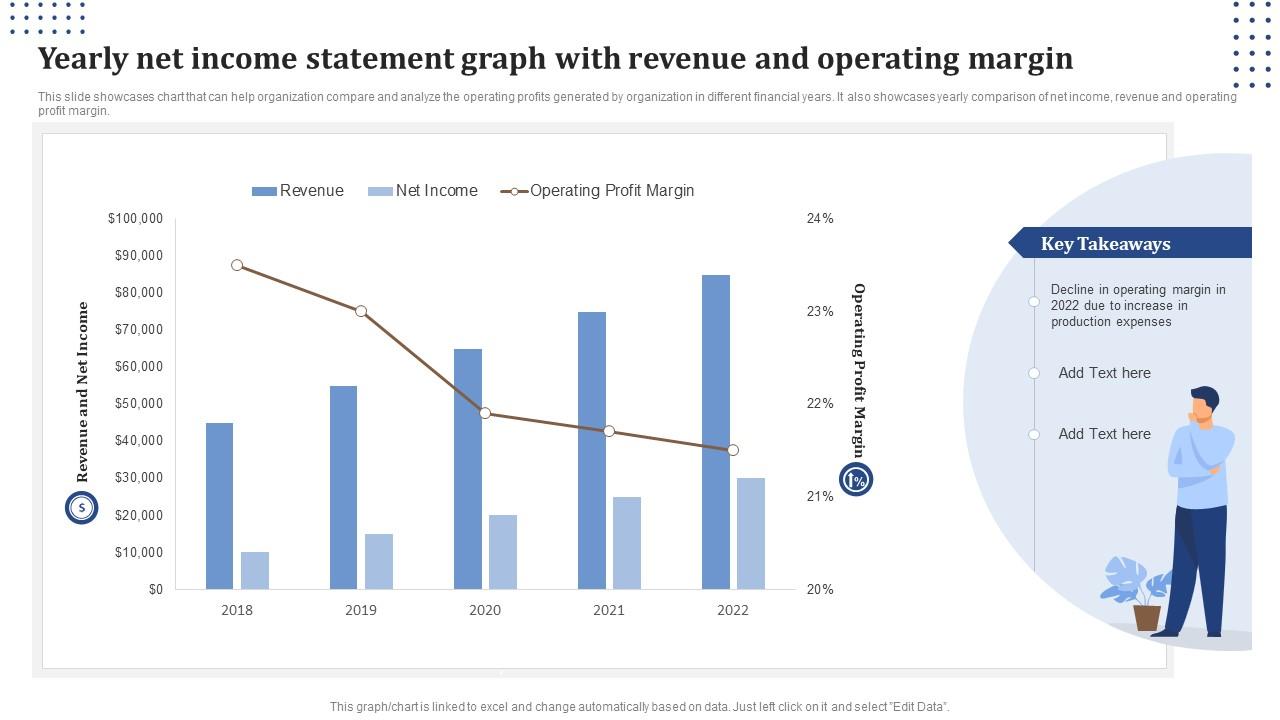
This slide showcases chart that can help organization compare and analyze the operating profits generated by organization in different financial years. It also showcases yearly comparison of net income, revenue and operating profit margin.
This slide showcases chart that can help organization compare and analyze the operating profits generated by organization i..
- Google Slides is a new FREE Presentation software from Google.
- All our content is 100% compatible with Google Slides.
- Just download our designs, and upload them to Google Slides and they will work automatically.
- Amaze your audience with SlideTeam and Google Slides.
-
Want Changes to This PPT Slide? Check out our Presentation Design Services
- WideScreen Aspect ratio is becoming a very popular format. When you download this product, the downloaded ZIP will contain this product in both standard and widescreen format.
-

- Some older products that we have may only be in standard format, but they can easily be converted to widescreen.
- To do this, please open the SlideTeam product in Powerpoint, and go to
- Design ( On the top bar) -> Page Setup -> and select "On-screen Show (16:9)” in the drop down for "Slides Sized for".
- The slide or theme will change to widescreen, and all graphics will adjust automatically. You can similarly convert our content to any other desired screen aspect ratio.
Compatible With Google Slides

Get This In WideScreen
You must be logged in to download this presentation.
PowerPoint presentation slides
This slide showcases chart that can help organization compare and analyze the operating profits generated by organization in different financial years. It also showcases yearly comparison of net income, revenue and operating profit margin. Introducing our Yearly Net Income Statement Graph With Revenue And Operating Margin set of slides. The topics discussed in these slides are Yearly, Net Income Statement, Graph, Revenue, Operating Margin. This is an immediately available PowerPoint presentation that can be conveniently customized. Download it and convince your audience.
People who downloaded this PowerPoint presentation also viewed the following :
Yearly Net Income Statement Graph With Revenue And Operating Margin with all 7 slides:
Use our Yearly Net Income Statement Graph With Revenue And Operating Margin to effectively help you save your valuable time. They are readymade to fit into any presentation structure.
-
“Love it! I was able to grab an exciting proposal because of SlideTeam.”
-
Best way of representation of the topic.


