

 Customer Reviews
One of the principal goals for anyone out there running a business, is having structure. Structure is the backbone of a successful enterprise, and of any successful pursuit in the domain of human commerce. Without it, organizations slow down and falter, plans get disrupted, and one’s vision, no matter how grand, fails to connect with the audience.
Before a business can begin solving its problems, it is crucial to be able to isolate these, comprehend where these stem from, and identify the sources that gave rise to it in the first place.
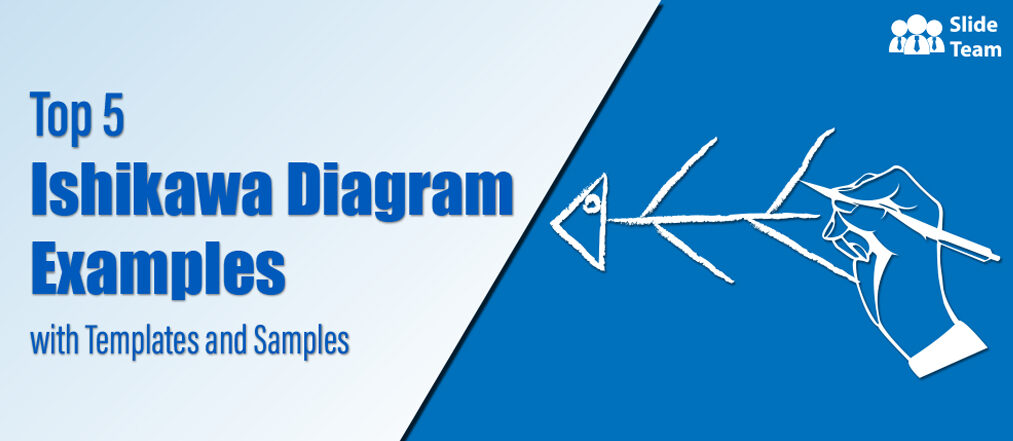
In the 1960s, now famous Japanese organizational theorist Kaoru Ishikawa pioneered a new and ingenious method of understanding quality control within business processes. Now widely known across the corporate sphere and among industrial circles, it is called the Ishikawa diagram.
This diagram strives to display the potential causes of an event along with the methods through which these (causes) can be addressed. The diagram is used in manufacturing and product development, although multiple sectors of the business world use it to underscore the many steps in a process, and to address the need for quality control.
Want to delve deeper into the fishbone diagram? Explore the concept further with our blog covering twenty-five fishbone diagram templates. Click here to read it.
Template 1: Ishikawa Diagram Facilitating Kaizen Blitz Organization
Deploy this template to assess cost effectiveness, vitalize product management and strengthen your position in the market. It comes with a simple effective structure, armed with headings, ranging from material, machine, manpower, environment, measurement and method (the 5 Ms.). Some of the subheadings branching off from these include, observe any abnormality, manage volume, standard inventory, building a new line, checking calibration, multi-skill training, etc.

Template 2: Ishikawa Analysis Organizational What Is A Cause And Effect Diagram
Designed to resemble a fish’s bones, the template we now discuss is divided broadly into cause and effect. Underscore avenues for optimization with this diagram, with the added capacity to better review current processes. Some of the labels in the diagram include equipment, process, materials, environment, and placeholders for your own entries. The diagram strikes a pleasant appearance with a white background, contrasting with dark green hues. Get this diagram and launch an insightful probe into your product development systems now!

Template 3: Ishikawa Analysis Organizational Why Use Cause And Effect Diagram
The following template maps out the phases, linking a cause and effect within a company’s broader product management structure. This diagram would prove to be quite an asset when conducting brainstorming sessions within your teams. The slide uses a clear font and a simple aesthetic, with subheadings that help in visual listing of multiple causes, encourages critical thinking among members, communicate issues and facilitates system thinking with visual linkages. Download this slide now and implement the stages laid to improve your product success rates.

Template 4: Fishbone Diagram Cause Effective Relationship
The following fishbone diagram establishes a bridge between causes and the impact they render upon your service/product. It functions as a tool for technical analysis, allowing for problem solving and better solutions. There are six subheadings, each one representing an effect, and two causes attached each. Employ this template to get a clearer view of the factors that can threaten or challenge your business.

Template 5: Fishbone Diagram For Cause Effect Analysis
This template helps to bridge cause and effect across multiple variables, giving you enhanced problem-solving capacity. Like the other diagrams in this blog, it adopts a creatively made fish-like shape, with four subheadings spread along the body– People, environment, policies and procedures. There are two causes situated underneath each of them. The template merges its neat design with a dark blue color palette that makes it easier on the eye. Download this visually inclined PPT Layout from the link below.

Template 6: Cause And Effect Fishbone Diagram
Create a breakdown of the contributing factors to an issue, with the aid of this resourceful dashboard, which also stages a comprehensive layout of the process in play. This template adopts a slicker design than Template 5 above, with the fish-like structure made to take on the shape of an arrow. Six customizable variables run over the length of the arrow, with smaller options present underneath each. Adapt the needs of your business into this nicely rendered slide and alter it as per your needs.

Conclusion
Leveraging fishbone diagrams can help you better understand the many exhaustive processes within your business, and to know the links between problems and the many variables feeding into them. If the Ishikawa diagram concept has you intrigued, but you are unsure of where to start when creating one for your business, then tap into our collection to modernize your product management systems and to improve your business skills.
FAQs on Ishikawa Diagrams
What are the 5 Ms in the Ishikawa diagram?
Though, a varying number of categories can be adapted for a particular corporation or business, most fishbone diagrams come with five categories starting with M:
- Manpower – the organization’s staff, their collective skills, numbers, and their motivations
- Method – the systems in place for the organization’s functioning, including procedures and methodologies.
- Measurement – the method of measurement for the progress of the results.
- Materials – the various aspects of consumable materials in the production chain.
- Machines – the physical and digital equipment used to implement the procedures.
- Environment (mother nature) – the impact the processes have on the environment.
What is also known as Ishikawa diagram?
An Ishikawa diagram is sometimes also called a ‘cause-and-effect diagram’. Another widely used term for this diagram is the fishbone diagram, given its fish-shaped layout. Its uniqueness lies in the matter-of-fact treatment of problems and the way it adopts to arrive at the root cause through a systematic analysis. The dispassionate approach has made it popular around the world, as it is one of the best methods to give nearly-immediate results in terms of making the problem vanish.
What is fishbone analysis used for?
A fishbone analysis is generally employed with the goal of identifying and narrowing down the possible sources of a problem, and in filtering ideas into useful pockets within a wider business system. The problem at the heart of the experience, often called ‘effect’ is labelled at the head or mouth of the fish, while potential contributing factors are represented as smaller bones of the fish structure. Fishbone diagrams can assist organizations in locating possible sources for an issue that may have been overlooked by other teams and managerial levels within the corporation.