- Sub Categories
-
 1214 five staged timeline diagram for business powerpoint slide
We are proud to present our 1214 five staged timeline diagram for business powerpoint slide. This Power Point template slide has been designed with graphic of five staged timeline diagram. This slide is suitable for business analysis. Use this PPT for your business timeline related presentations.
-
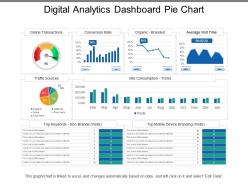 Digital analytics dashboard pie chart
Presenting this set of slides with name - Digital Analytics Dashboard Pie Chart. This is a five stage process. The stages in this process are Digital Analytics, Digital Dashboard, Digital Kpis.
-
 Business kpi dashboard showing marketing spend and return on investment
Presenting this set of slides with name - Business Kpi Dashboard Showing Marketing Spend And Return On Investment. This is a three stage process. The stages in this process are Business Dashboard, Business Kpi, Business Performance.
-
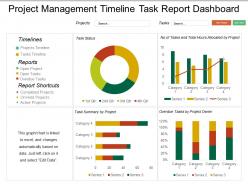 Project management timeline task report dashboard snapshot
Introducing project management timeline task report dashboard snapshot PPT template. An easy access to make the desired changes or edit it anyways. Wide screen view of the slides. Easy conversion into Jpeg or Pdf format. The PPT images offer compatibility with Google Slides. High resolution icons for clear message delivery. Unique and informational content. Valuable for business professionals, sales representatives, marketing professionals, students and selling investigators. High quality charts and visuals used in the designing process. They enhance the performance of the presentation.
-
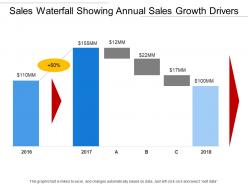 Sales waterfall showing annual sales growth drivers
Presenting the Sales Waterfall Showing Annual Sales Growth Drivers PowerPoint presentation slide. You can edit this template in PowerPoint and use it in Google slides also. The PPT layout is totally editable. You can add relevant content in the text holders provided. The image has a high resolution so that it does not blur on being enlarged. The slide is available in both standard and wide screen formats. So, click, edit and present.
-
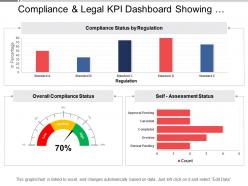 Compliance and legal kpi dashboard showing overall compliance status
Presenting this set of slides with name - Compliance And Legal Kpi Dashboard Showing Overall Compliance Status. This is a three stage process. The stages in this process are Compliance And Legal, Legal Governance, Risk Management.
-
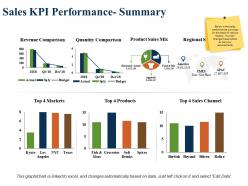 Sales kpi performance summary revenue comparison product sales mix
Presenting this set of slides with name - Sales Kpi Performance Summary Revenue Comparison Product Sales Mix. This is a three stage process. The stages in this process are Revenue Comparison, Quantity Comparison, Product Sales Mix, Regional Sales Mix, Top Sales Channel.
-
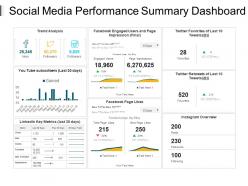 Social media performance summary dashboard presentation pictures
Presenting Social Media Performance Summary Dashboard Presentation Pictures PPT slide. This presentation design has been professionally designed, is fully editable in PowerPoint and is compatible with Google slides as well. You can customize the font type, font size, colors of the diagram, background color and add the company logo. High quality graphs, charts, tables and icons ensure that there is no deteriorating in quality on enlarging their size. Fast download at click of a button.
-
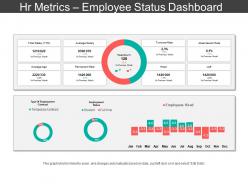 Hr metrics employee status dashboard snapshot ppt slide templates
Presenting HR Metrics Employee Status Dashboard Snapshot PPT Slide Templates which is designed professionally for your convenience. Change the color, font, font size, and font type of the slides as per your requirements. The template is compatible with Google Slides which makes it easily accessible at once. Open and save your presentation in various formats like PDF, JPG, and PNG. Freely access your template in both 4:3 and 16:9 aspect ratio.
-
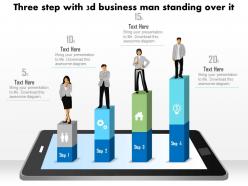 1214 three step with 3d business man standing over it powerpoint slide
We are proud to present our 1214 three step with 3d business man standing over it powerpoint slide. Three step and 3d man are used to craft this power point template slide. This PPT slide contains the concept of data technology. This PPT slide can be used for data and business related presentation.
-
 Program management kpi dashboard showing timesheet summary
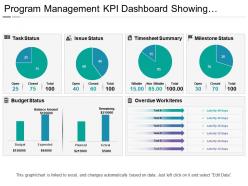
Presenting Program Management KPI Dashboard Showing Timesheet Summary PPT slide. The Program management KPI dashboard PowerPoint template designed professionally by the team of SlideTeam to present the record of timesheet summary to do any task. The pie chart and line chart figures along with that the text in the timesheet summary dashboard slide are customizable in PowerPoint. A user can illustrate the specific time to do any task because the pie chart dashboard template gets linked with Excel Sheet along with that it is also compatible with Google Slide. A user can alter the font size, font type, color, as well as dimensions of the pie and line chart to present the specific time.
-
 Data driven bar chart to handle data powerpoint slides
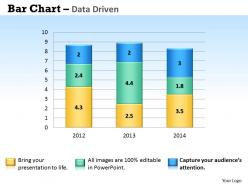
We are proud to present our data driven bar chart to handle data powerpoint slides. Ay Out The Red Carpet With Our Data Driven Bar Chart To Handle Data Powerpoint Slides Power Point Templates. Take Your Audience On The Grand Walk Of Fame. Swish The Air With Our Magical Data Driven Bar Chart To Handle Data Powerpoint Slides Power Point Templates. Pull A Rabbit Out Of The Hat With Your Ideas.
-
 Question mark with four text boxes and percentage powerpoint slides
Completely editable presentation design i.e. fonts, visuals, text and color. PPT slide goes well with Google slides. Excellence in picture quality. Presentation design can be displayed in standard and widescreen view. Personalize the presentation with individual company name and logo. PPT template is fully editable to allow customization. Simple to download and convert into PDF format.
-
 Butterfly chart tornado chart for price comparison powerpoint slide
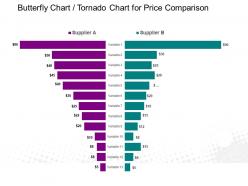
Presenting butterfly chart tornado chart PowerPoint template PPT slide. This PPT is widely applicable by a team of managers and business analyst who foresee the business in light of change. One can find impressive picture quality with high resolution. 100 percent editable slide design. There is freedom to execute the changes in color, font, text and more as per one’s personal choice. Ease of personalization with your company name and logo. PPT is compatible with a wide variety of format options. Harmonious with a set of software.
-
 Data driven 3d bar chart for research in statistics powerpoint slides
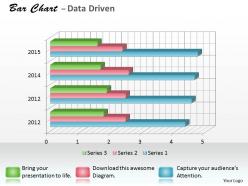
Presenting data driven 3d bar chart for research in statistics presentation slides. Effortlessly alterable template slide as stats in excel sheet styles are customizable. This presentation slide is entirely flexible with Google Slides. Easy to download this template and save into JPEG and PDF format. Application of the best graphics, color, and icons. Quick to insert organization image, name, signature, copyright and picture for personalization of slide. Graphics quality does not get harm when displayed on widescreen. Instructional slides are available for guidance.
-
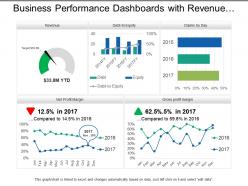 Business performance dashboards with revenue and ratios
Presenting, our business performance dashboards with revenue and ratios PPT deck. Pre-designed chart sheet directed PowerPoint Presentation template. Administration of high-resolution images, graphs, and comparison diagrams. Filled with methods and effects to create an impact. Can be quickly converted into JPEG/JPG or PDF formats as per the requirements. Congenial with Google Slides for ease. Project to widescreen without cringing about pixelating, after downloading explore these characteristics.
-
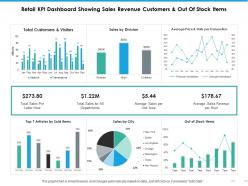 Retail kpi dashboard showing sales revenue customers and out of stock items
Presenting this set of slides with name - Retail Kpi Dashboard Showing Sales Revenue Customers And Out Of Stock Items. This is a six stage process. The stages in this process are Percentage, Product, Management, Marketing, Business.
-
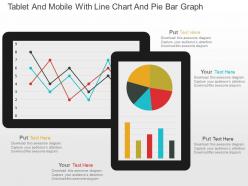 Tablet and mobile with line chart and pie bar graph powerpoint slides
Editable PPT Slide for viewing quarterly track record line chart. Compatible with numerous format options like JPEG, JPG or PDF. Access to inclusion and exclusion of contents as per specific needs of any business. Provides a professional outlook to your PowerPoint presentation. Beneficial for business professionals, students, teachers, business analysts and strategists. Customization of each PowerPoint graphic and text according to your desire and want.
-
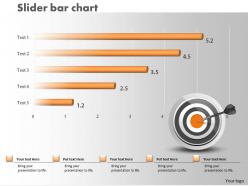 0414 slider bar chart with target powerpoint graph
We are proud to present our 0414 slider bar chart with target powerpoint graph. Our Slider Bar Chart With Target Powerpoint Graph Powerpoint Templates come in all colours shades and hues. They help highlight every nuance of your views. Our Slider Bar Chart With Target Powerpoint Graph Powerpoint Templates will fulfill your every need. Use them and effectively satisfy the desires of your audience.
-
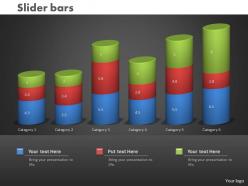 0414 slider bar graph column chart powerpoint graph
Flexible presentation design with amazing picture quality. Excel linked design so you can make changes in the excel sheet and the design will change accordingly. Variation is possible with color, text, font and shape. Prompt download and can be changed in JPEG and PDF format. Gives a specialized effect to your Presentation template. Alternate to customize the design by adding business badge, icon and symbol. PowerPoint slide exhibited in standard and widescreen view. Useful for corporate sale experts, finance strategists, professionals.
-
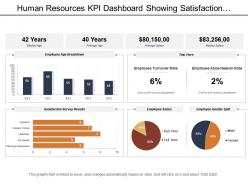 Human resources kpi dashboard showing satisfaction survey result age breakdown
Presenting human resources KPI dashboard showing satisfaction survey result age breakdown data driven PowerPoint slide. Fit to be used with the Google slides. Replace the visuals, text and the content in the slide design. Change the size, style and orientation of the slides. Use your company’s name or brand name to make it your own presentation template. Beneficial for managers, professors, marketers, etc. Flexible option for conversion in PDF or JPG formats. Available in Widescreen format also. Useful for making business plan and strategies.
-
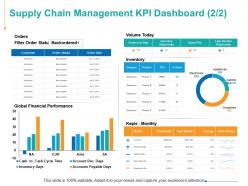 Supply chain management kpi dashboard finance ppt powerpoint presentation files
Presenting this set of slides with name - Supply Chain Management KPI Dashboard Finance Ppt Powerpoint Presentation Files. This is a four stage process. The stages in this process are Customer, Inventory, Marketing, Strategy, Planning.
-
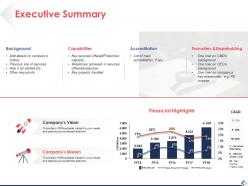 Executive summary background ppt pictures slide download
Presenting this set of slides with name - Executive Summary Background Ppt Pictures Slide Download. This is a four stage process. The stages in this process are Background, Capabilities, Accreditation, Promoters, Shareholding.
-
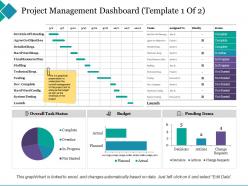 Project management dashboard agree on objectives
Presenting this set of slides with name - Project Management Dashboard Agree On Objectives. This is a three stage process. The stages in this process are Final Resource Plan, Agree On Objectives, System Testing.
-
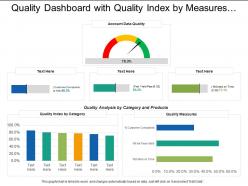 Quality dashboard with quality index by measures and quality index
Presenting this set of slides with name - Quality Dashboard With Quality Index By Measures And Quality Index. This is a three stage process. The stages in this process are Quality Dashboard, Quality Kpi, Quality Metircs.
-
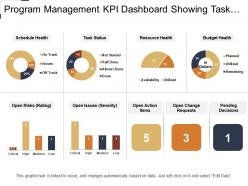 Program management kpi dashboard showing task status and budget health
Presenting Program Management KPI Dashboard Showing Task Status And Budget Health PPT slide. The task status dashboard PowerPoint template designed professionally by the team of SlideTeam to present the current status of the project. The different icons such as pie chart, semi-circle, square box, line chart and many other which include text in the Budget health dashboard slide are customizable in PowerPoint. A user can populate the pie chart and line chart values by editing the excel table and it is also compatible with Google Slide. A user can alter the font size, font type, color and dimensions of the line chart and pie chart to show the desired values.
-
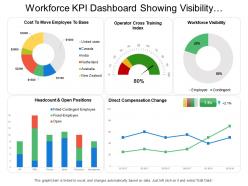 Workforce kpi dashboard showing visibility headcount and direct compensation change
Presenting this set of slides with name - Workforce Kpi Dashboard Showing Visibility Headcount And Direct Compensation Change. This is a five stage process. The stages in this process are Staff, Personnel, Workforce.
-
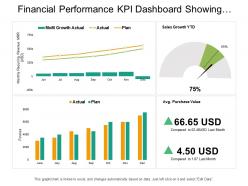 Financial performance kpi dashboard showing sales growth average purchase value
Presenting this set of slides with name - Financial Performance Kpi Dashboard Showing Sales Growth Average Purchase Value. This is a three stage process. The stages in this process are Financial Performance, Financial Report, Financial Review.
-
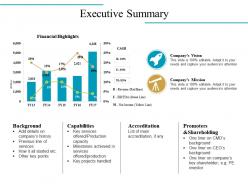 Executive summary powerpoint slides design
Presenting this set of slides with name - Executive Summary Powerpoint Slides Design. This is a two stage process. The stages in this process are Background, Capabilities, Accreditation, Promoters And Shareholding, Financial Highlights.
-
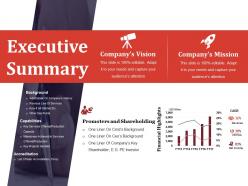 Executive summary powerpoint show
Presenting executive summary powerpoint show. This is a executive summary powerpoint show. This is a five stage process. The stages in this process are background, companys vision, companys mission, capabilities.
-
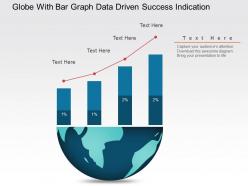 Globe with bar graph data driven success indication powerpoint slides
We are proud to present our globe with bar graph data driven success indication powerpoint slides. Explain the global success indication with this power point template diagram. This PPT diagram contains the graphic of globe with bar graph. Use this PPT diagram for global marketing and business related presentations.
-
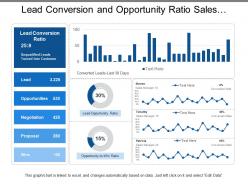 Lead conversion and opportunity ratio sales dashboards
Presenting this set of slides with name - Lead Conversion And Opportunity Ratio Sales Dashboards. This is a four stage process. The stages in this process are Sales Dashboard, Sales Kpis, Sales Performance.
-
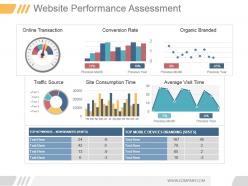 Website performance assessment powerpoint ideas
Presenting website performance assessment powerpoint ideas. This is a website performance assessment powerpoint ideas. This is a three stage process. The stages in this process are online transaction, conversion rate, organic branded, traffic, source, site consumption time, average visit time, previous month, previous year, top keywords non branded visits, top mobile devices branding visits.
-
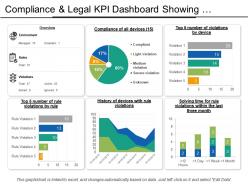 Compliance and legal kpi dashboard showing violations by devices
Presenting this set of slides with name - Compliance And Legal Kpi Dashboard Showing Violations By Devices. This is a six stage process. The stages in this process are Compliance And Legal, Legal Governance, Risk Management.
-
 Hr dashboard shown by humans and bar graphs
Presenting this set of slides with name - Hr Dashboard Shown By Humans And Bar Graphs. This is a three stage process. The stages in this process are Hr Dashboard, Human Resource Dashboard, Hr Kpi.
-
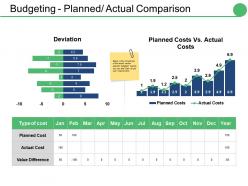 Budgeting planned actual comparison ppt portfolio ideas
Presenting this set of slides with name - Budgeting Planned Actual Comparison Ppt Portfolio Ideas. The topics discussed in this diagram are Deviation, Planned Cost, Actual Cost, Value Difference, Type Of Cost. This is a completely editable PowerPoint presentation and is available for immediate download.
-
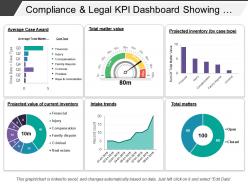 Compliance and legal kpi dashboard showing total matter value
Presenting this set of slides with name - Compliance And Legal Kpi Dashboard Showing Total Matter Value. This is a six stage process. The stages in this process are Compliance And Legal, Legal Governance, Risk Management.
-
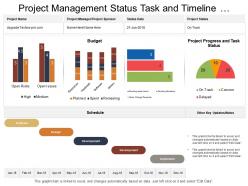 Project management status task and timeline dashboard
PPT design comes with access to include or exclude content as per the business need. Presentation template is available in both standard as well as in widescreen slide. PowerPoint slide provides a professional perspective to presentation. Harmonious with various formats like JPEG and PDF as well as with Google slides. Entirely editable and personalization of PPT graphic is enabled for your use. Matching PowerPoint slides are available with different nodes and stages.
-
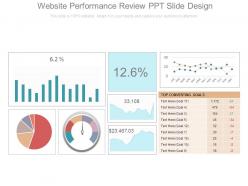 Website performance review ppt slide design
Presenting website performance review ppt slide design. This is a website performance review ppt slide design. This is a four stage process. The stages in this process are business, strategy, finance, management, marketing.
-
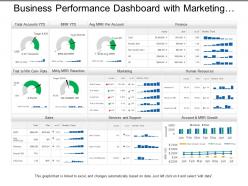 Business performance dashboard with marketing human resource and sales
Presenting, business performance dashboard with marketing human resource and sales PPT deck. This PPT deck focuses on one of the aspects of business marketing with content broadly researched by our business research team. Quickly editable color combinations, layout, text boxes, and font. Alluring graphs for illustration with relatable images to explain the concept. Transform into PDF and JPG format at ease. Predesigned content is adaptable and can be projected to widescreen for business meetings.
-
 Project Management Dashboard Budget By Employee
Presenting this set of slides with name - Project Management Dashboard Budget By Employee. This is a one stage process. The stages in this process are Percentage, Product, Marketing, Management, Business.
-
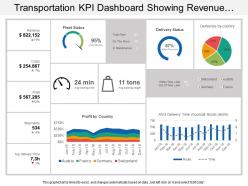 Transportation kpi dashboard snapshot showing revenue costs profit fleet status
Presenting KPI dashboard snapshot showing revenue costs profit fleet status slideshow. Change PowerPoint structure, font, text, color and design as per your requirements. Easy to input data with excel linked charts, just right to click to input data. This presentation theme is totally attuned with Google slides. Easy conversion to other software’s like JPG and PDF formats. Image quality of these PPT diagram remains the unchanged even when you resize the image or portray on large screens.
-
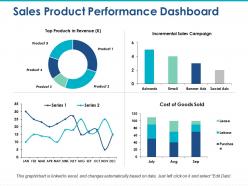 Sales product performance dashboard incremental sales campaign
Providing sales product performance dashboard incremental sales campaign presentation template with editing preference as images, icons, colors, text and layout can be edit as required. PowerPoint design can be downloaded and save into JPG and PDF format. High resolution ensures no pixel break. PPT diagram downloadable in standard and widescreen view. Fully adjustable slide as works well with Google slides. Easy to adjust and present when required. Quick to share message effectively.
-
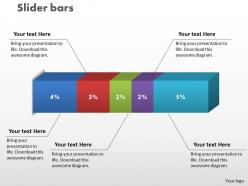 0414 slider bar chart data driven graphics powerpoint graph
We are proud to present our 0414 slider bar chart data driven graphics powerpoint graph. Our Slider Bar Chart Data Driven Graphics Powerpoint Graph Powerpoint Templates will generate and maintain the level of interest you desire. They will create the impression you want to imprint on your audience. Our Slider Bar Chart Data Driven Graphics Powerpoint Graph Powerpoint Templates are effectively colour coded to priorities your plans. They automatically highlight the sequence of events you desire.
-
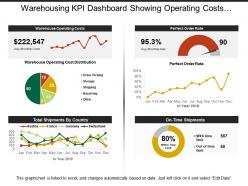 Warehousing kpi dashboard showing operating costs and order rate
The main advantage of this highly versatile PPT design is that it’s completely editable; you can include your business logo, trademarks to personalize the design. Also, you can include business related custom content over text place holders. Design can be opened and edited with Google Slides and MS PowerPoint software. You can download this PowerPoint design into JPEG and PDF formats.
-
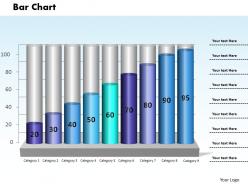 0414 column chart business data illustration powerpoint graph
Slide runs quite fluently with all software. Fast download of PPT templates. Include your company logo, name or trademark with no issues. PPT graphics pixelation does not occur once slide viewed on widescreen. Compatibility with google slides for quick processing and information sharing. Coherently display titles and subtitles with no space constraints. Extremely customizable layout including font, text, color and design. High resolution PPT slides for clarity.
-
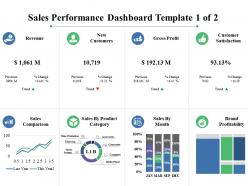 Sales performance dashboard revenue new customers
Providing sales performance dashboard revenue new customers PowerPoint template. PPT graphic can be shared in standard and widescreen view. High resolution picture quality ensures no pixel break up even when shared with large set of audience. Presentation slide is adaptable with Google slides. Magnificent to share business communication effectively. PPT slide is available with different nodes and stages. PowerPoint design can be edited as needed and change into JPG and PDF format.
-
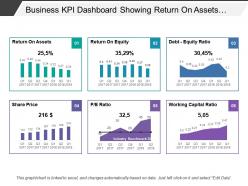 Business kpi dashboard showing return on assets debt-equity ratio
Presenting this set of slides with name - Business Kpi Dashboard Showing Return On Assets Debt-Equity Ratio. This is a six stage process. The stages in this process are Business Dashboard, Business Kpi, Business Performance.
-
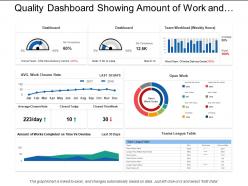 Quality dashboard showing amount of work and the percentage charts
SlideTeam presents to you its quality dashboard showing amount of work and the percentage charts.You can also alter the font size, font color and font style of the text so used in the slides. The business template can be saved in format of PDF or JPG as per your requirements. So download this slideshow and make most of it.
-
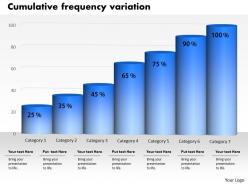 0414 percentage profit growth column chart powerpoint graph
All images are 100% editable in the presentation design. Changing the color, size and orientation of any icon to your liking is manageable in presentation slide. PPT design supports the best graphic features; icon list can be re arranged according to the requirement. Smooth animations, transitions and movement of objects across the slide. Beneficial by businessmen in marketing, service and sales departments and students.
-
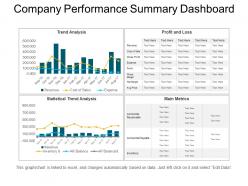 Company performance summary dashboard ppt slide examples
Presenting company performance summary dashboard PPT design. They are 100% expertly crafted Presentation graphics. They are quite compatible with all software’s and Google Slides. They have a feature to redesign all the available shapes, patterns, and matters etc. They have an authentic and relevant PPT images with limber data options and can easily add company name or logo.
-
 Budget forecast showing expense management and expenses
Presenting this set of slides with name - Budget Forecast Showing Expense Management And Expenses. This is a three stage process. The stages in this process are Budget Forecast, Forecast Vs Actual Budget, Plan Vs Forecast.
-
 Parallel timeline schedule
Presenting parallel timeline schedule. This is a parallel timeline schedule. This is a four stage process. The stages in this process are parallel timeline, parallel roadmap, parallel linear process.
-
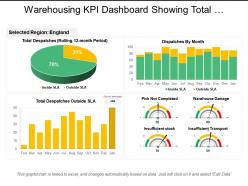 Warehousing kpi dashboard showing total dispatches
This highly versatile PPT design is completely editable; you can modify and personalize the design according to your business needs. You can use excel linked chart to display your business related and figures in presentation. PPT slides are easily downloadable as JPEG or PDF formats. Design can be opened both in standard and wide screen view; no change on design quality on full screen view.
-
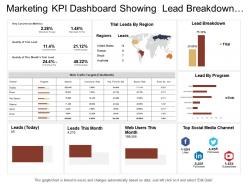 Marketing kpi dashboard showing lead breakdown web traffic targets
Presenting this set of slides with name - Marketing Kpi Dashboard Showing Lead Breakdown Web Traffic Targets. This is a three stage process. The stages in this process are Marketing, Branding, Promoting.
-
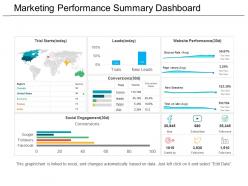 Marketing performance summary dashboard snapshot ppt templates
Presenting marketing performance summary dashboard snapshot PPT templates PPT slide. Presentation can be viewed on widescreen as the visuals do not pixelate. All the elements of the slide background can be tailored to individual needs. The presentation template can be incorporated in any of the desired format (JPEG/PDF) Guidance for editing of the PPT visual diagram is provided. Easy to edit and customize PPT graphics. Compatible with all software and can be saved in any format (JPEG/JPG/PDF).
-
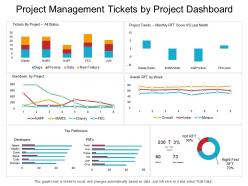 Project management tickets by project dashboard
Presenting this set of slides with name - Project Management Tickets By Project Dashboard. This is a six stage process. The stages in this process are Project Proposal, Project Plan, Project Management.
-
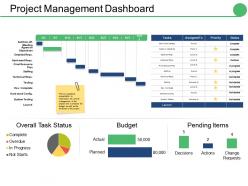 Project management dashboard snapshot ppt show graphics
Presenting this set of slides with name - Project Management Dashboard Snapshot Ppt Show Graphics. This is a four stage process. The stages in this process are Actual, Planned, Budget, Pending Items, Overdue.
-
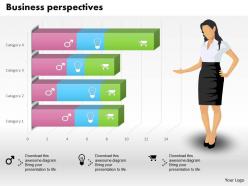 0514 data driven business prospective diagram powerpoint slides
We are proud to present our 0514 data driven business prospective diagram powerpoint slides. Explain business prospective data driven result for any business. To do this use our creative Business Power Point template in your presentation and get all attention.
-
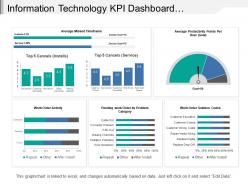 Information technology kpi dashboard showing work order activity
Presenting this set of slides with name - Information Technology Kpi Dashboard Showing Work Order Activity. This is a six stage process. The stages in this process are Information Technology, It, Iot.


