- Sub Categories
-
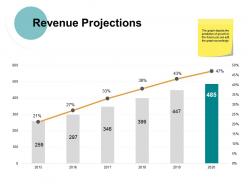 Revenue projections ppt powerpoint presentation file designs download
Presenting this set of slides with name - Revenue Projections Ppt Powerpoint Presentation File Designs Download. This is a two stage process. The stages in this process are Finance, Management, Strategy, Business, Marketing.
-
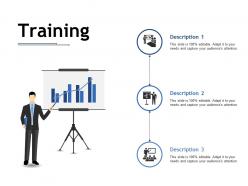 Training ppt infographics example file
Presenting this set of slides with name - Training Ppt Infographics Example File. This is a three stage process. The stages in this process are Description, Training, Task.
-
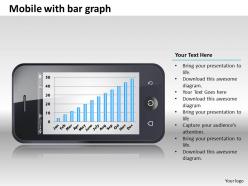 0414 mobile bar graph column chart powerpoint graph
Cogently abstracted Presentation graphics makes it easy to interpret the related notion , Refine able matrix charts, designs, style, pattern, size of the PowerPoint images, An exclusive tool perfect for business managers, specialist, experts ,researchers and scholars etc. , PowerPoint slides can be easily exportable to various configurations like PDF or JPG. Easy to insert company logo or trademark, Option to add subsequent caption or subheadings also, well versed with Google slides and other programs.
-
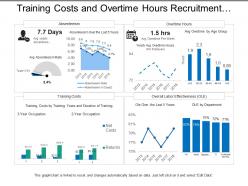 Training costs and overtime hours recruitment dashboard
Presenting this set of slides with name - Training Costs And Overtime Hours Recruitment Dashboard. This is a four stage process. The stages in this process are Staffing Plan, Recruitment, Staff Management.
-
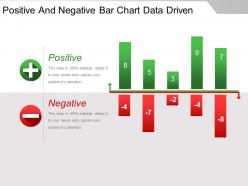 Positive and negative bar chart data driven powerpoint guide
Presenting positive and negative bar chart data driven powerpoint guide. This is a positive and negative bar chart data driven powerpoint guide. This is a two stage process. The stages in this process are positive, negative.
-
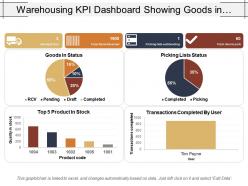 Warehousing kpi dashboard showing goods in status
The presentation design is easy to edit by anyone even having without any specific knowledge. Design elements are editable including font, type, color, size, style, shape, background, images etc. Slides are completely compatible with Google Slides and MS PowerPoint software. Both standard and full screen view available; no change on design quality will happen when opened on full screen view.
-
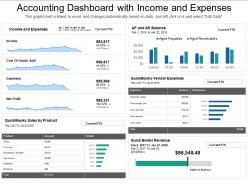 Accounting dashboard with income and expenses
Presenting accounting dashboard with income and expenses PPT slideshow. Loaded with incomparable benefits. Readymade PPT graphic helps in saving time and effort. Can be personalized by adding company trademark, logo, brand and symbols. Can be utilized for displaying both simple and complex information. Include or exclude slide content as per your individual need. Colors and text can be easily changed as the PPT slide is completely editable. Useful for every business leader and professional, project management team, business analysts, etc.
-
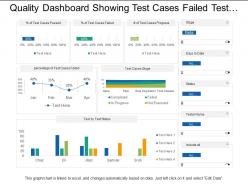 Quality dashboard showing test cases failed test status and in progress
SlideTeam feels immense pleasure in presenting to you its quality dashboard showing test cases failed test status and in progress. Following simple instructions given in the sample template you can easily alter the given set of predesigned slides. You can view the PPT template in standard size display ratio of 4:3 or widescreen display ratio of 16:9. The business slides are very easy to use and operate as they are compatible with Google Slides and can be similarly saved in format of PDF or JPG.
-
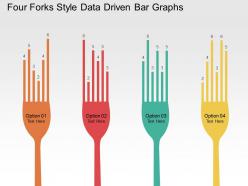 Four forks style data driven bar graphs powerpoint slides
Work adequately with all thing alterations. Easy to embed association logo, trademark or name. Visuals quality don't pixelate when expected on wide screen. Well magnificent with Google slides. Basically snap to download. Free of space necessities to state titles and sub titles. Modify PPT manage, inventive style, substance, shading and plan as showed by your style. Can be effortlessly changed over into PDF or JPG gatherings. High declaration slides portrayals.
-
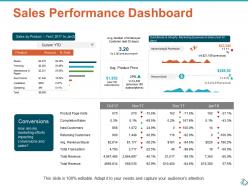 Sales performance dashboard ppt show infographic template
Presenting this set of slides with name - Sales Performance Dashboard Ppt Show Infographic Template. This is a four stage process. The stages in this process are Business, Planning, Strategy, Marketing, Management.
-
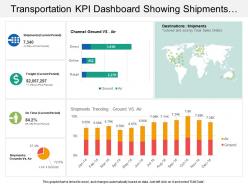 Transportation kpi dashboard snapshot showing shipments ground vs air channel
Presenting our transportation KPI dashboard snapshot showing shipments ground vs. air channel PPT slide. This layout is compatible with Google slides and data can be updated with excel linked file. This template is Excel linked just right click to input your information. Images do no blur out even when they are projected on large screen.PPT template can be utilized by sales and marketing teams and business managers. Instantly downloadable slide and supports formats like JPEG and PDF.
-
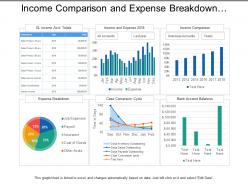 Income comparison and expense breakdown utilities dashboard
Presenting this set of slides with name - Income Comparison And Expense Breakdown Utilities Dashboard. This is a six stage process. The stages in this process are Utilities, Use, Advantage.
-
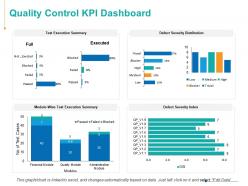 Quality control kpi dashboard ppt powerpoint presentation inspiration example
Presenting this set of slides with name - Quality Control KPI Dashboard Ppt Powerpoint Presentation Inspiration Example. This is a six stage process. The stages in this process are Finance, Analysis, Business, Investment, Marketing.
-
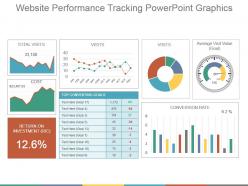 Website performance tracking powerpoint graphics
Presenting website performance tracking powerpoint graphics. This is a website performance tracking powerpoint graphics. This is a three stage process. The stages in this process are total visits, conversion rate, return on investment, average visit value.
-
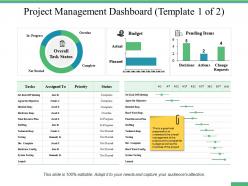 Project management dashboard snapshot ppt professional example introduction
Presenting this set of slides with name - Project Management Dashboard Snapshot Ppt Professional Example Introduction. This is a three stage process. The stages in this process are Percentage, Product, Management, Marketing, Business.
-
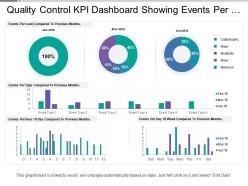 Quality control kpi dashboard showing events per hour and day
Presenting this set of slides with name - Quality Control Kpi Dashboard Showing Events Per Hour And Day. This is a four stage process. The stages in this process are Quality Management, Quality Control, Quality Assurance.
-
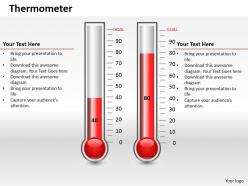 0414 column chart in thermometer style powerpoint graph
PowerPoint infographic fully adaptable with Google slides. Adaptable to wide screen view without the problem of pixilation. Modifiable color, text and font as per the trade requirement. Easy to download and can be turned into JPG and PDF format. Accessibility of addition of logo and trademarks for personalization. Awesome use of colors and innovatively designed. Corresponding designs accessible with different nodes and stages.
-
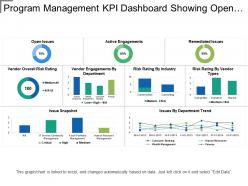 Program management kpi dashboard showing open issues and risk rating
Presenting this set of slides with name - Program Management Kpi Dashboard Showing Open Issues And Risk Rating. This is a three stage process. The stages in this process are Program Development, Human Resource Management, Program Management.
-
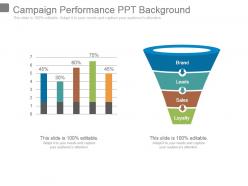 Campaign performance ppt background
Presenting campaign performance ppt background. This is a campaign performance ppt background. This is a two stage process. The stages in this process are brand, leads, sales, loyalty.
-
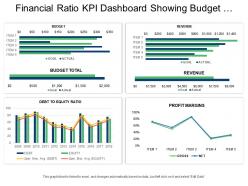 Financial ratio kpi dashboard snapshot showing budget revenue and profit margins
Presenting this set of slides with name - Financial Ratio Kpi Dashboard Snapshot Showing Budget Revenue And Profit Margins. This is a four stage process. The stages in this process are Accounting Ratio, Financial Statement, Financial Ratio.
-
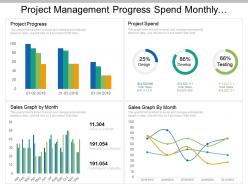 Project management progress spend monthly growth dashboard
Presentation design is easy download and can be changed into other software programs such as JPEG and PDF. Personalize the PowerPoint template with brand name, logo and image. Presentation slide is available with choice to download with different nodes and stages. Completely editable PPT slide can be edited as colors, icons, and text. Easy to present amongst large set of audience as accessible in widescreen view option. PowerPoint graphic can be merged with Google slides as fully compatible with them.
-
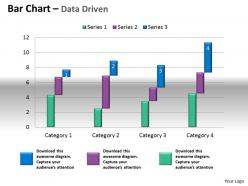 Data driven bar chart to compare quantities powerpoint slides
We are proud to present our data driven bar chart to compare quantities powerpoint slides. Use Our Data Driven Bar Chart To Compare Quantities Powerpoint Slides Power Point Templates In Concert. Create A Masterful Melody With Your Ideas. Light A Fire With Our Data Driven Bar Chart To Compare Quantities Powerpoint Slides Power Point Templates. Spread The Warmth Of Your Ideas.
-
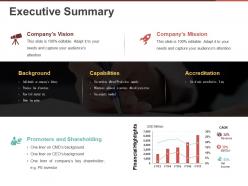 Executive summary powerpoint themes
Presenting this set of slides with name - Executive Summary Powerpoint Themes. This is a three stage process. The stages in this process are Bar Chart, Finance, Marketing, Analysis, Strategy, Business.
-
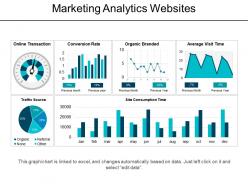 Marketing analytics websites powerpoint topics
Presenting marketing analytics websites powerpoint topics. This is a marketing analytics websites powerpoint topics. This is a six stage process. The stages in this process are market analysis, marketing analytics, web analytics, marketing optimization.
-
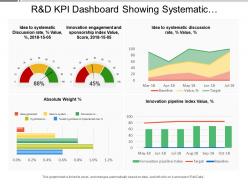 R and d kpi dashboard showing systematic discussion rate innovation engagement and sponsorship index
Presenting this set of slides with name - R And D Kpi Dashboard Showing Systematic Discussion Rate Innovation Engagement And Sponsorship Index. This is a four stage process. The stages in this process are R And D, Research And Development, Research And Technological Development.
-
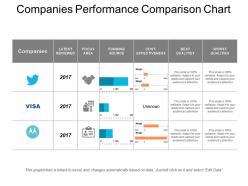 Companies performance comparison chart powerpoint templates
Presenting Companies Performance Comparison Chart Powerpoint Template. The slide is totally compatible with Google Slides. It can be customised as per your requirement. Also, related content can be added in the text holders provided. The size, style and color of the font can be changed according to your requirement. The slide is available in two sizes - standard screen size and wide screen size. It has a high resolution which ensures that the image does not blur upon enlarging. It can be downloaded easily.
-
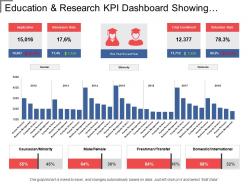 Education and research kpi dashboard showing retention rate and admissions
Presenting education and research KPI dashboard showing retention rate and admissions PPT slide. The KPI for school teachers PPT slide designed by professional team of SlideTeam. The education presentation slide is customizable in PowerPoint. The education KPI dashboard PowerPoint template is also compatible with Google Slide so a user can share this template with others via the internet. A user can make changes in the font size, font type, color as well as dimensions of the key performance indicators for schools & education management PPT slide as per the requirement. You may edit the value in the KPI dashboard higher education template as the template get linked with Excel sheet.
-
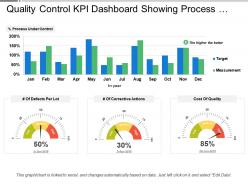 Quality control kpi dashboard showing process under control and cost of quality
Presenting this set of slides with name - Quality Control Kpi Dashboard Showing Process Under Control And Cost Of Quality. This is a four stage process. The stages in this process are Quality Management, Quality Control, Quality Assurance.
-
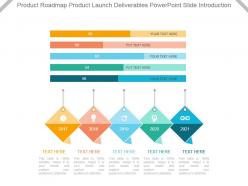 Product roadmap product launch deliverables powerpoint slide introduction
Presenting product roadmap product launch deliverables powerpoint slide introduction. This is a product roadmap product launch deliverables powerpoint slide introduction. This is a five stage process. The stages in this process are business, management, marketing, roadmap, deliverables.
-
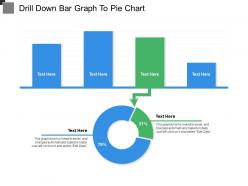 Drill down bar graph to pie chart
Presenting this set of slides with name - Drill Down Bar Graph To Pie Chart. This is a two stage process. The stages in this process are Drill Down, Hierarchy, Top Downwards.
-
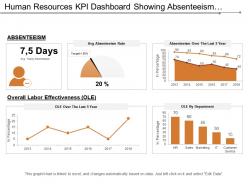 Human resources kpi dashboard showing absenteeism overall labor effectiveness
Presenting this set of slides with name - Human Resources Kpi Dashboard Showing Absenteeism Overall Labor Effectiveness. This is a five stage process. The stages in this process are Human Resource, Hrm, Human Capital.
-
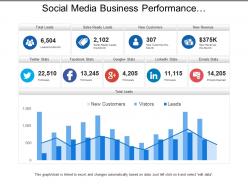 Social media business performance dashboards with total leads
Presenting this set of slides with name - Social Media Business Performance Dashboards With Total Leads. This is a three stage process. The stages in this process are Business Dashboard, Business Kpi, Business Performance.
-
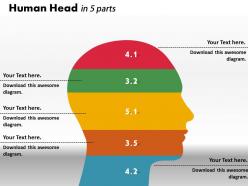 0414 human head ratio bar chart powerpoint graph
Supreme quality PPT presentation layouts. Equipped with high-resolution images and patterns to impress the viewers. Maintains the speed and consistency of the system. Well matched framework with Google. Runs smoothly with all software’s. Downloads easily without any hurdles. Provides error free performance and wraps the presentation session on the scheduled time frame.
-
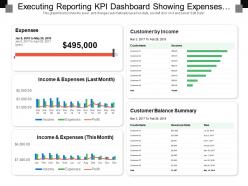 Executing reporting kpi dashboard showing expenses customer by income
Presenting this set of slides with name - Executing Reporting Kpi Dashboard Showing Expenses Customer By Income. This is a five stage process. The stages in this process are Executive Reporting, Executive Analysis, Executive Performance.
-
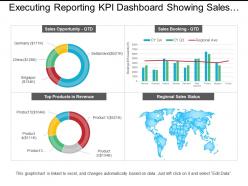 Executing reporting kpi dashboard showing sales opportunity and sales booking
Presenting this set of slides with name - Executing Reporting Kpi Dashboard Showing Sales Opportunity And Sales Booking. This is a four stage process. The stages in this process are Executive Reporting, Executive Analysis, Executive Performance.
-
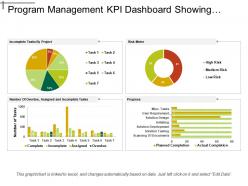 Program management kpi dashboard showing incomplete tasks and risk meter
Presenting this set of slides with name - Program Management Kpi Dashboard Showing Incomplete Tasks And Risk Meter. This is a four stage process. The stages in this process are Program Development, Human Resource Management, Program Management.
-
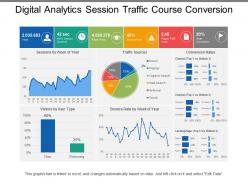 Digital analytics session traffic course conversion
Presenting this set of slides with name - Digital Analytics Session Traffic Course Conversion. This is a five stage process. The stages in this process are Digital Analytics, Digital Dashboard, Digital Kpis.
-
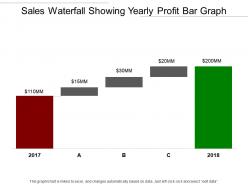 Sales waterfall showing yearly profit bar graph
Presenting this set of slides with name - Sales Waterfall Showing Yearly Profit Bar Graph. This is a five stage process. The stages in this process are Sales Waterfall, Waterfall Chart.
-
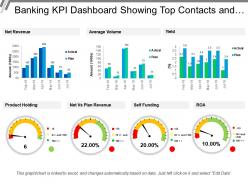 Banking kpi dashboard showing top contacts and client value
Presenting this set of slides with name - Banking Kpi Dashboard Showing Top Contacts And Client Value. This is a three stage process. The stages in this process are Banking, Finance, Money.
-
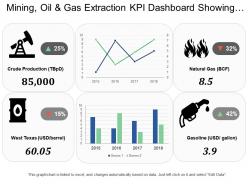 Mining oil and gas extraction kpi dashboard showing crude production and natural gas
Presenting this set of slides with name - Mining Oil And Gas Extraction Kpi Dashboard Showing Crude Production And Natural Gas. This is a four stage process. The stages in this process are Mining, Oil And Gas Extraction, Refinery, Natural Gas.
-
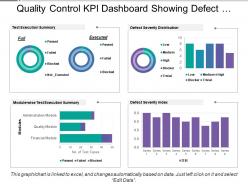 Quality control kpi dashboard showing defect severity distribution
Presenting this set of slides with name - Quality Control Kpi Dashboard Showing Defect Severity Distribution. This is a four stage process. The stages in this process are Quality Management, Quality Control, Quality Assurance.
-
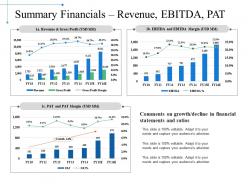 Summary financials revenue ebitda pat powerpoint slide download
Presenting this set of slides with name - Summary Financials Revenue Ebitda Pat Powerpoint Slide Download. This is a four stage process. The stages in this process are Business, Marketing, Finance, Planning, Analysis.
-
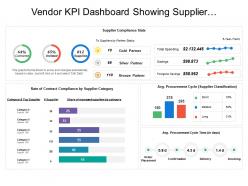 Vendor kpi dashboard showing supplier compliance stats and procurement cycle time
Presenting this set of slides with name - Vendor Kpi Dashboard Showing Supplier Compliance Stats And Procurement Cycle Time. This is a four stage process. The stages in this process are Vendor, Supplier, Retailer.
-
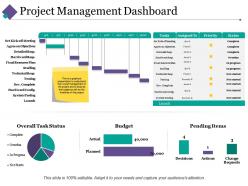 Project management dashboard snapshot ppt pictures infographic template
Displaying project management dashboard snapshot PPT picture infographic template. Alter the design with trade components like name and picture. Presentation slide is well-harmonized with Google slides. Colors and text can be replaced as the PowerPoint graphic comes with easy editing options. Rapid and easy download with saving options. PPT diagram can be viewed in both standard and widescreen display view. Flexible with other software options such as PDF or JPG formats.
-
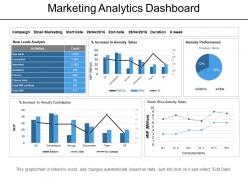 Marketing analytics dashboard powerpoint slide clipart
Presenting Marketing Analytics Assessment PowerPoint Templates. The designs are 100% editable in this PowerPoint template. The font size, font color, graphic colors, and slide background can be customized without any hassle. The users can add or remove the images according to their needs. This template includes one slide which is designed by keeping compatibility with Google Slides in mind. It is available in both standard and widescreen.
-
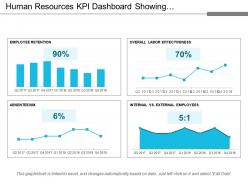 Human resources kpi dashboard showing employee retention absenteeism
Presenting this set of slides with name - Human Resources Kpi Dashboard Showing Employee Retention Absenteeism. This is a four stage process. The stages in this process are Human Resource, Hrm, Human Capital.
-
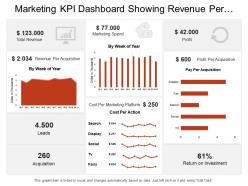 Marketing kpi dashboard showing revenue per acquisition leads speed profit
Presenting this set of slides with name - Marketing Kpi Dashboard Showing Revenue Per Acquisition Leads Speed Profit. This is a three stage process. The stages in this process are Marketing, Branding, Promoting.
-
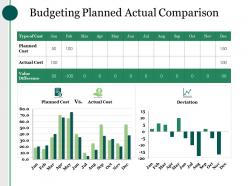 Budgeting planned actual comparison powerpoint guide
Presenting this set of slides with name - Budgeting Planned Actual Comparison Powerpoint Guide. This is a three stage process. The stages in this process are Type Of Cost, Planned Cost, Actual Cost, Value Difference, Deviation.
-
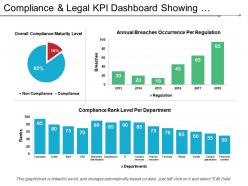 Compliance and legal kpi dashboard showing overall compliance maturity level
Presenting this set of slides with name - Compliance And Legal Kpi Dashboard Showing Overall Compliance Maturity Level. This is a three stage process. The stages in this process are Compliance And Legal, Legal Governance, Risk Management.
-
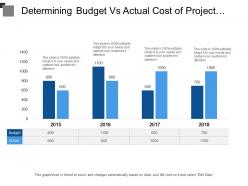 Determining budget vs actual cost of project include year over year analysis
Presenting this set of slides with name - Determining Budget Vs Actual Cost Of Project Include Year Over Year Analysis. This is a four stage process. The stages in this process are Forecast Vs Actual Budget, Actual Vs Budget, Marketing Budget.
-
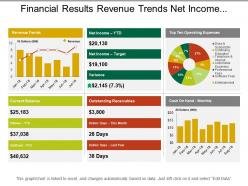 Financial results revenue trends net income cash on hand layout
Presenting financial results revenue trends net income cash on hand layout. Change PowerPoint structure, font, text, color and design as per your requirements. Easy to input data with excel linked charts, just right to click to input data. This presentation theme is totally attuned with Google slide. Easy conversion to other software’s like JPG and PDF formats. Image quality of these PPT diagram remains the unchanged even when you resize the image or portray on large screens.
-
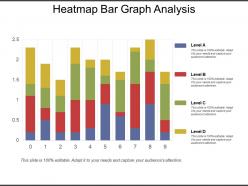 Heatmap bar graph analysis
Presenting heatmap bar graph analysis. This is a heatmap bar graph analysis. This is a four stage process. The stages in this process are heat map, data graphical representation, web analytics.
-
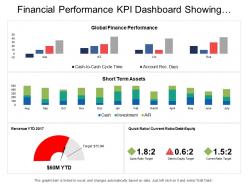 Financial performance kpi dashboard showing revenue quick ratio short term assets
Presenting this set of slides with name - Financial Performance Kpi Dashboard Showing Revenue Quick Ratio Short Term Assets. This is a four stage process. The stages in this process are Financial Performance, Financial Report, Financial Review.
-
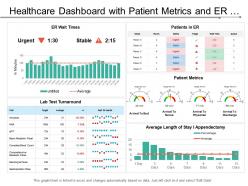 Healthcare dashboard with patient metrics and er wait times
Presenting this set of slides with name - Healthcare Dashboard With Patient Metrics And Er Wait Times. This is a five stage process. The stages in this process are Healthcare, Health Improvement, Medical Care.
-
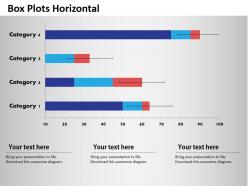 0414 box plots horizontal business bar chart powerpoint graph
Download is brisk and can be simply inserted in the presentation. Presentation template comes in standard and widescreen view. PowerPoint slide created with high quality resolution design. Entirely adaptable design as color, text and font can be edited with ease. Downloadable with different nodes and stages. Easy to transform the PPT slide into JPEG and PDF document. Useful for social media, mobile technology, business communication information.
-
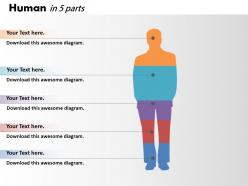 0414 column chart human body illustration powerpoint graph
PowerPoint images are fully compatible with Google slides. Simple data entry of company logo, trademark or name. Quick downloading speed and formats can be altered to JPEG and PDF. Make changes in presentation slide font, text, color and design as per your way. Share information with entrepreneurs, corporate users and marketing professionals. High resolution based theme, does not vary in size even when projected on large screen.
-
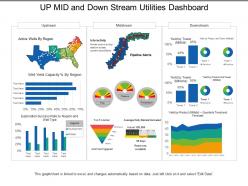 Up mid and down stream utilities dashboard
Presenting this set of slides with name - Up Mid And Down Stream Utilities Dashboard. This is a three stage process. The stages in this process are Utilities, Use, Advantage.
-
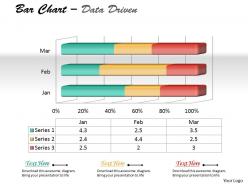 Data driven 3d chart to represent quantitative differences powerpoint slides
We are proud to present our data driven 3d chart to represent quantitative differences powerpoint slides. Our Data Driven 3D Chart To Represent Quantitative Differences Powerpoint Slides Power Point Templates Will Generate And Maintain The Level Of Interest You Desire. They Will Create The Impression You Want To Imprint On Your Audience. Our Data Driven 3D Chart To Represent Quantitative Differences Powerpoint Slides Power Point Templates Are Effectively Color Coded To Priorities Your Plans. They Automatically Highlight The Sequence Of Events You Desire.
-
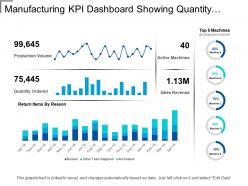 Manufacturing kpi dashboard showing quantity ordered and active machines
Presenting this set of slides with name - Manufacturing Kpi Dashboard Showing Quantity Ordered And Active Machines. This is a four stage process. The stages in this process are Manufacturing, Production, Manufacture.
-
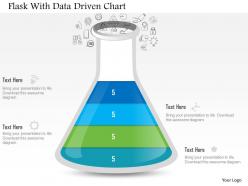 1214 flask with data driven chart powerpoint slide
We are proud to present our 1214 flask with data driven chart powerpoint slide. This power point template slide has been designed with graphic of flask and data driven chart. This PPT slide contains the concept of data analysis for different measurement. Use this PPT and build quality presentation for your viewers.


