- Sub Categories
-
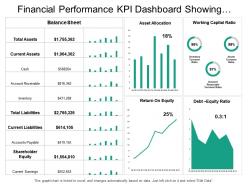 Financial performance kpi dashboard showing asset allocation balance sheet
Presenting this set of slides with name - Financial Performance Kpi Dashboard Showing Asset Allocation Balance Sheet. This is a two stage process. The stages in this process are Financial Performance, Financial Report, Financial Review.
-
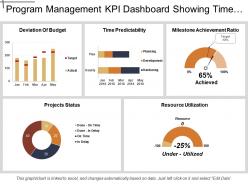 Program management kpi dashboard showing time predictability and resource utilization
Presenting Program Management KPI Dashboard Showing Time Predictability And Resource Utilization PPT slide. The graphical Program Management dashboard PowerPoint template designed by the professional team of SlideTeam to present the different parameters that are essential for any project. The different charts such as line and pie chart, along with that the text in the KPI dashboard slide are editable in PowerPoint. Moreover, this slide is compatible with Google Slide. An individual can edit the font size, font type, color and dimensions of the different figures according to the requirement.
-
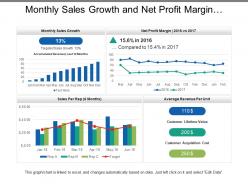 Monthly sales growth and net profit margin dashboard
Presenting this set of slides with name - Monthly Sales Growth And Net Profit Margin Dashboard. This is a four stage process. The stages in this process are Sales Dashboard, Sales Kpis, Sales Performance.
-
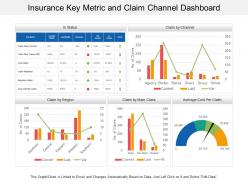 Insurance key metric and claim channel dashboard
• Easy to customize. • Easy to replace any words, picture or number provided in the template with your own content and use it for presentation. • Freedom to incorporate your own company’s name and logo in the presentation for personalization. • The PPT visuals used are of high resolution. • No issue of image pixilation if projected on wide screen. • Compatibility with numerous format and software options. • Widely used by marketers, businessmen, insurance managers and educators.
-
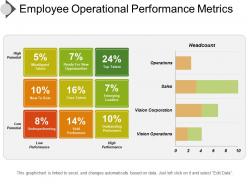 Employee operational performance metrics ppt image
Presenting employee operational performance metrics PPT image. PPT is perfect for employee performance assessment and management. Downloads are 100% error free. Images are compatible with Google Slides and MS PowerPoint. Presentation is useful for corporate business managers, trainers, HR professionals. The presentation can be opened with Google Slides and Microsoft PowerPoint. Download and convert the design into JPEG and PDF formats.
-
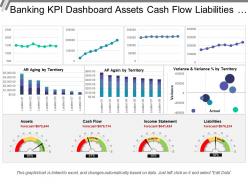 Banking kpi dashboard assets cash flow liabilities income statement
Presenting this set of slides with name - Banking Kpi Dashboard Assets Cash Flow Liabilities Income Statement. This is a three stage process. The stages in this process are Banking, Finance, Money.
-
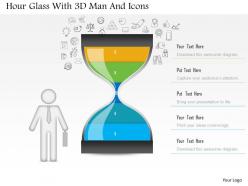 1214 hour glass with 3d man and icons powerpoint slide
We are proud to present our 1214 hour glass with 3d man and icons powerpoint slide. Graphic of hour glass and 3d man with icons are used to craft this power point template slide. This PPT slide contains the concept of time management. Use this PPT slide for all your time related presentations.
-
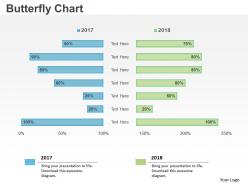 0414 business butterfly bar chart powerpoint graph
Presenting 0414 business butterfly bar chart PowerPoint graph PPT slide. High-resolution visuals. No fear of image pixelation when projected on a large screen. Thoroughly editable PowerPoint pictures. Ease of executing changes in the content of the slide. Easy to customize and personalize the PowerPoint slides with company-specific name, logo, and trademark. Ease of download and can be saved in any format of one’s choice. Compatible with numerous software options available both online and offline. Applicable by a number of marketing and nonmarketing executives, students, and teachers.
-
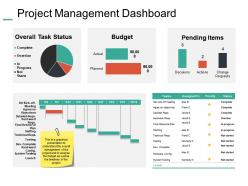 Project management dashboard snapshot ppt summary example introduction
Presenting this set of slides with name - Project Management Dashboard Snapshot Ppt Summary Example Introduction. This is a three stage process. The stages in this process are Budget, Pending Items, Change Request, Decision, Actions.
-
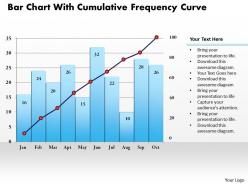 0414 bar chart with cumulative frequency curve powerpoint graph
Editing and upgrading of compiled data is simple in presentation visual. Presentation slide is helpful in business marketing, management and recourse disbursement. Principal work which can be altered with respect to font, color and layout. Appealing and impressive color contrast gives a professional look to PPT layout. Conversion into PDF or JPG formats is painless and user friendly. PPT graphic renders quality font size which can be read from a distance.
-
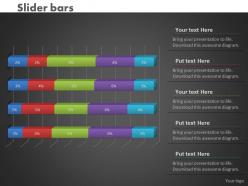 0414 slider bar chart for visual analysis powerpoint graph
We are proud to present our 0414 slider bar chart for visual analysis powerpoint graph. Our great team has conjured up a web of Slider Bar Chart For Visual Analysis Powerpoint Graph Powerpoint Templates. Use them to string together your glistening ideas. Think of it and be sure we have it. Our Slider Bar Chart For Visual Analysis Powerpoint Graph Powerpoint Templates offer you the widest possible range of options.
-
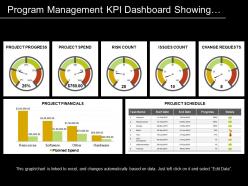 Program management kpi dashboard showing progress spend and risk count
Presenting this set of slides with name - Program Management Kpi Dashboard Showing Progress Spend And Risk Count. This is a three stage process. The stages in this process are Program Development, Human Resource Management, Program Management.
-
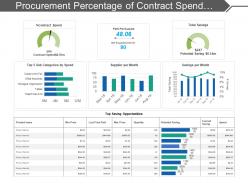 Procurement percentage of contract spend dashboard
Presenting this set of slides with name - Procurement Percentage Of Contract Spend Dashboard. This is a seven stage process. The stages in this process are Purchase, Procurement, Buy.
-
 Data driven bar graph powerpoint slides
We are proud to present our data driven bar graph powerpoint slides. Honors Your Audience With A Grand Parade Of Your Thoughts. Shower On Them The Confetti Of Our Data Driven Bar Graph Powerpoint Slides Power Point Templates. Set New Benchmarks With Our Data Driven Bar Graph Powerpoint Slides Power Point Templates. They Will Keep Your Prospects Well Above Par.
-
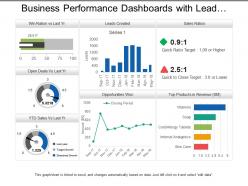 Business performance dashboards with lead creation and sales ratios
Presenting, business performance dashboards with lead creation and sales ratios for cost efficiency and performance indication PPT presentation. Bright and informative PowerPoint presentation slides. Gives regulations to achieve business success and targets. Produces error-free execution. Acts as a model for planning future assignments for marketing capabilities. Fully editable by any user at any point in time. Performs a clarity of marketing and presentation objectives without creating any confusions and misconceptions. Simple to be projected to widescreen without degradation in quality.
-
 Performance metrics icon powerpoint images
Presenting performance metrics icon PowerPoint images PPT slide. This performance metrics slide is easily downloadable and export it into JPEG or PDF format. A presenter can display this performance metrics icon slide in the standard or widescreen view. You can even amend the color, text, font type & font size, aspect ratio, etc. of performance metrics icon slide. The performance metrics icon template gets 100% synced with Google Slides and fully editable in PowerPoint. You can share this performance metrics icon slide easily with large segment due to its tremendous pixel quality. The performance metrics icon slide gets linked with the excel sheet.
-
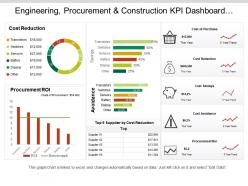 Engineering procurement and construction kpi dashboard showing cost of purchase order and cost reduction
You can use this PPT slideshow very easily as it is fully customizable. You can effortlessly insert or remove any diagrammatic representation from the given template. The font size, font color and font style can be easily edited. This graph PPT is linked to excel and changes automatically based on the data you enter. You can save the deck in either PDF or JPG format. To make any changes in the PPT slideshow, simply follow the instructions given in the sample slides. The size, color and orientation of all shapes are 100% customizable, so don’t waste any further time and download this presentation.
-
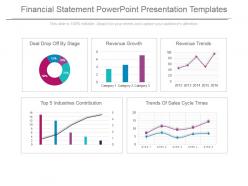 Financial statement powerpoint presentation templates
Stunning financial statement PowerPoint design. Fit to be used with Google slides. Replace the images, text and the content in the slide design. Change the size, style and orientation of the slides. Use your company’s name or brand name to make it your own presentation template. Beneficial for managers, professors, marketers, etc. Possess great quality for better understanding and error-free performance. Flexible option for conversion in PDF or JPG formats. Available in Widescreen format also. Useful for making business plan and strategies.
-
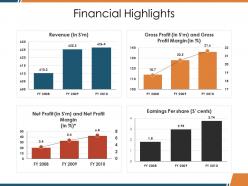 Financial highlights
Presenting this set of slides with name - Financial Highlights. This is a four stage process. The stages in this process are Earnings Per Share, Net Profit, Revenue, Gross Profit, Business.
-
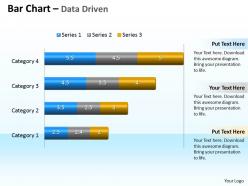 Data driven 3d bar chart to compare categories powerpoint slides
We are proud to present our data driven 3d bar chart to compare categories powerpoint slides. You can present your opinions using this impressive template. It helps your team to align their arrows to consistently be accurate. Use this slide to highlight your thought process.
-
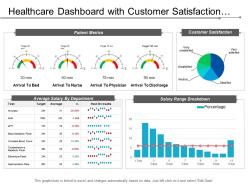 Healthcare dashboard with customer satisfaction and patient metrics
Presenting this set of slides with name - Healthcare Dashboard With Customer Satisfaction And Patient Metrics. This is a four stage process. The stages in this process are Healthcare, Health Improvement, Medical Care.
-
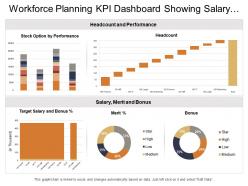 Workforce planning kpi dashboard showing salary merit bonus headcount and performance
Presenting this set of slides with name - Workforce Planning Kpi Dashboard Showing Salary Merit Bonus Headcount And Performance. This is a five stage process. The stages in this process are Staff, Personnel, Workforce.
-
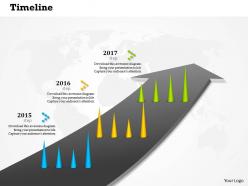 0514 linear progressive time line diagram powerpoint slides
We are proud to present our 0514 linear progressive time line diagram powerpoint slides. A linear progressive time line diagram is used in this Business Power Point template. Show all kind of result analysis in any presentation by using this template.
-
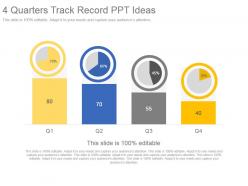 4 quarters track record ppt ideas
Presenting 4 quarters track record PPT template. Beneficial for the business managers, marketing professionals and the strategy designers. Access to convert the presentation design into JPG and PDF. Offer 100% access to change the size and style of the slides once downloaded and saved in the desired format. Choice to get presentation slide in standard or in widescreen view. Easy to convert in JPEG and PDF document. Compatible with Google slides. Easy and hassle-free downloading process.
-
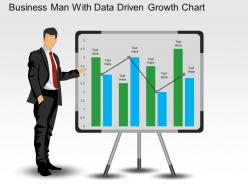 Business man with data driven growth chart powerpoint slides
Downloads instantaneously without unnecessary steps. High resolution PPT images with fully modifiable size and orientation. Fully editable text sans length constraints on titles and subtitles. Insert your company name, brand name, tagline or watermark. Convert easily into PDF or JPG formats and run with any software. Impressive addition to presentations by project managers, sales executives, marketers etc.
-
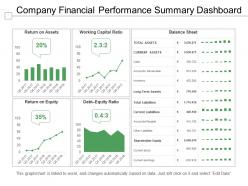 Company financial performance summary dashboard presentation slides
Introducing company financial performance summary dashboard PPT slide. Promptly conformable PPT design which saves time with an instant downloading option. Reinstate able PPT image, Restyle able subject matter, designs, context etc. Versant with Google Slides and other applications. Perfectly standardized PowerPoint template quite handy for the trade specialists from diverse areas. Easily convertible into different file arrangements such as PDF or JPG.
-
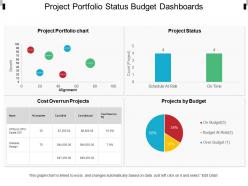 Project portfolio status budget dashboards
Presenting, project portfolio status budget dashboards. This PPT slide believes in delivering a pleasant and great experience to the customers and can be picked by professionals for a great experience. The color of the pie chart sections and text areas can easily be edited according to your need. This PPT slide is also agreeable with google slides and accessible in Fullscreen version. Offhand conversion into PDF/ JPG format. Simple insertion of company trade name/logo.
-
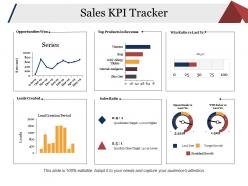 Sales kpi tracker presentation examples
Presenting this set of slides with name - Sales Kpi Tracker Presentation Examples. This is a six stage process. The stages in this process are Opportunities Won, Top Products In Revenue, Win Ratio Vs Last, Leads Created, Sales Ratio.
-
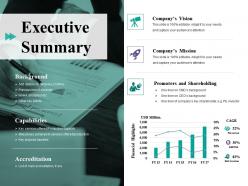 Executive summary ppt file elements
Presenting this set of slides with name - Executive Summary Ppt File Elements. This is a five stage process. The stages in this process are Company Vision, Promoters And Shareholding, Background, Capabilities, Accreditation.
-
 Executive summary ppt file example topics
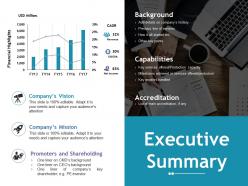
Presenting this set of slides with name - Executive Summary Ppt File Example Topics. This is a five stage process. The stages in this process are Company Vision, Promoters And Shareholding, Background, Capabilities, Accreditation.
-
 0414 simple bar chart with percentage powerpoint graph
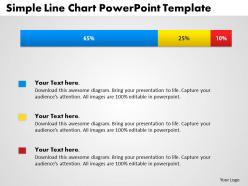
Absolutely editable color scheme and values of PPT graphs. Add your company name, logo, brand-name etc. to personalize. Modify the size and orientation of presentation visuals to suit your requirement. Quick and simple download at your convenience. Original resolution of PPT visuals unaffected after editing. Presentation slide accessible in Standard 4:3 and Widescreen 16:9 view.
-
 Resource utilization planning with task name project
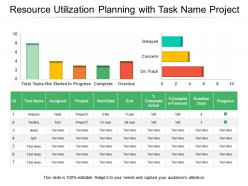
Presenting this set of slides with name - Resource Utilization Planning With Task Name Project. This is a three stage process. The stages in this process are Resource Management, Resource Utilization, Resource Allocation.
-
 Information technology kpi dashboard showing cost per ticket sla compliance rate
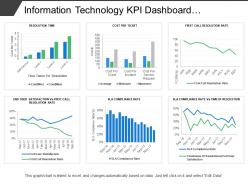
Presenting this set of slides with name - Information Technology Kpi Dashboard Showing Cost Per Ticket Sla Compliance Rate. This is a six stage process. The stages in this process are Information Technology, It, Iot.
-
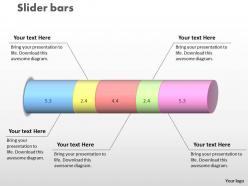 0414 interactive data driven bar chart powerpoint graph
We are proud to present our 0414 interactive data driven bar chart powerpoint graph. Our Interactive Data Driven Bar Chart Powerpoint Graph Powerpoint Templates provide the links in your chain of thought. Once intertwined they enhance the strength of your words. Our Interactive Data Driven Bar Chart Powerpoint Graph Powerpoint Templates are like ingredients in your recipe of sucess. Stir them together and get people licking their lips.
-
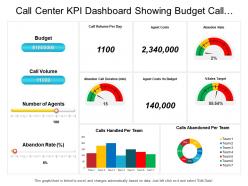 Call center kpi dashboard showing budget call volume agent costs percentage sales target
Presenting this set of slides with name - Call Center Kpi Dashboard Showing Budget Call Volume Agent Costs Percentage Sales Target. This is a four stage process. The stages in this process are Call Center Agent, Customer Care, Client Support.
-
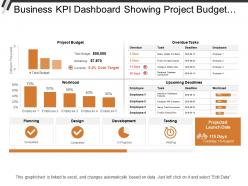 Business kpi dashboard showing project budget overdue tasks and workload
Presenting this set of slides with name - Business Kpi Dashboard Showing Project Budget Overdue Tasks And Workload. This is a two stage process. The stages in this process are Business Dashboard, Business Kpi, Business Performance.
-
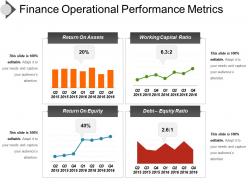 Finance operational performance metrics ppt daigram
Introducing finance operational performance metrics PPT diagram. Exquisitely coordinated PPT design template beneficial for various business professionals. Easily resizable shapes, patterns, and matters etc. Genuine and admissible PPT Image with pliant data options. Adequately compatible with all operating softwares and all Google Slides. Easily convertible to other file formats such as PDF or JPG. Adequate space available to add headings and subheadings. Unaffected high resolution PPT graphic when projected on huge screen.
-
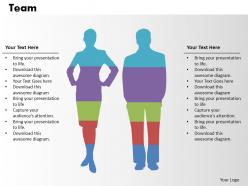 0414 business team bar chart graphics powerpoint graph
PPT template can be watched in Standard and Widescreen view. Presentation slides are compatible with Google slides. Immediate download and sharing. PowerPoint design can be easily modified such as colors, visuals, text, etc. Adaptable template slide as can be converted into JPEG and PDF document. Perfect for marketing managers, sales executives, directors, teachers, etc.
-
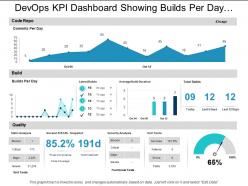 Devops kpi dashboard showing builds per day and code repo
Presenting this set of slides with name - Devops Kpi Dashboard Showing Builds Per Day And Code Repo. This is a three stage process. The stages in this process are Development And Operations, Devops.
-
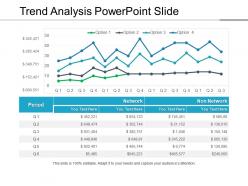 Trend analysis powerpoint slide
Presenting trend analysis PowerPoint template. Access to edit the content, style, size and orientation of the PPT slides. Extremely spacious to cover all the aspects of the company profile. High resolution images do not pixelate when projected on wide screen. Personalize the PPT with your company name and logo. Modify the presentation elements as per the need of an hour. Compatible with numerous software and format options. Used by entrepreneurs, marketers, managerial department, stakeholders and students. Self-explanatory and intellectual slide charts.
-
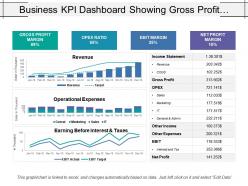 Business kpi dashboard showing gross profit margin opex ratio and ebit margin
Presenting this set of slides with name - Business Kpi Dashboard Showing Gross Profit Margin Opex Ratio And Ebit Margin. This is a three stage process. The stages in this process are Business Dashboard, Business Kpi, Business Performance.
-
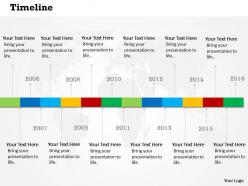 0514 creative business time line diagram powerpoint slides
We are proud to present our 0514 creative business time line diagram powerpoint slides. A creative business time line diagram is used in this Business Power Point template. Show all kind of result analysis in any presentation by using this template.
-
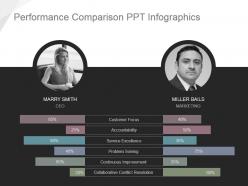 Performance comparison ppt infographics
Presenting performance comparison ppt infographics. This is a performance comparison ppt infographics. This is a two stage. The Stages in this process are customer focus, accountability, service excellence, problem solving, continuous improvement, collaborative conflict resolution.
-
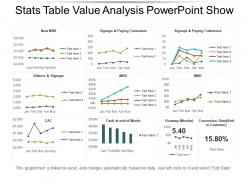 Stats table value analysis powerpoint show
Presenting stats table value analysis PowerPoint show. This layout offers you plenty of space to put in titles and sub titles. High resolution-based layout, does not change the image even after resizing. This presentation icon is fully compatible with Google slides. Quick downloading speed and simple editing options in color text and fonts.PPT icons can easily be changed into JPEG and PDF applications. This diagram has been designed for entrepreneurs, corporate and business managers. Easy to use, edit and you can design attractive slides within few minutes.
-
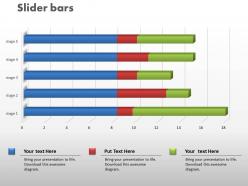 0414 slider time series bar chart powerpoint graph
We are proud to present our 0414 slider time series bar chart powerpoint graph. Our Slider Time Series Bar Chart Powerpoint Graph Powerpoint Templates give you the basic framework of your talk. Give it the shape you desire with your wonderful views. Our Slider Time Series Bar Chart Powerpoint Graph Powerpoint Templates are the lungs of your talk. Fill them with the oxygen of your indepth thought process.
-
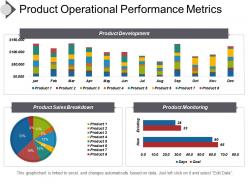 Product operational performance metrics presentation visuals
Easily editable as color, text and layout are editable as required. Presentation template is accessible in similar designs with different nodes and stages. PowerPoint slide is attainable in standard and widescreen view. Precise download and can be easily integrate in the presentation. PPT design is downloadable with different nodes and stages. Presentation graphic is designed with high quality resolution design. Presentation diagram is well familiar with Google slides and can be merged with them.
-
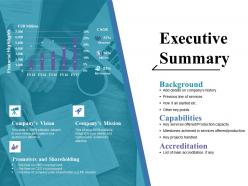 Executive summary ppt pictures
Presenting this set of slides with name - Executive Summary Ppt Pictures. This is a three stage process. The stages in this process are Background, Capabilities, Accreditation, Promoters And Shareholding, Business.
-
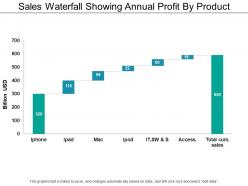 Sales waterfall showing annual profit by product
Presenting this set of slides with name - Sales Waterfall Showing Annual Profit By Product. This is a seven stage process. The stages in this process are Sales Waterfall, Waterfall Chart.
-
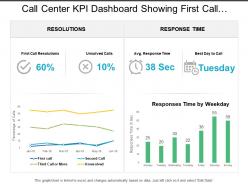 Call center kpi dashboard showing first call resolution response time
Presenting call center KPI dashboard showing first call resolution response time. This deck offers you plenty of space to put in titles and sub titles. This template is Excel linked just right click to input your information. High resolution-based layout, does not change the image even after resizing. This presentation icon is fully compatible with Google slides. Quick downloading speed and simple editing options in color text and fonts.PPT icons can easily be changed into JPEG and PDF applications.
-
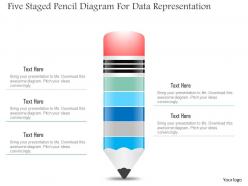 1214 five staged pencil diagram for data representation powerpoint slide
We are proud to present our 1214 five staged pencil diagram for data representation powerpoint slide. Five staged pencil diagram has been used to craft this power point template slide. This PPT slide contains the concept of data representation. Use this PPT slide for your business data related presentation.
-
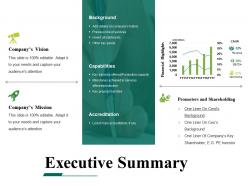 Executive summary powerpoint templates microsoft
Presenting executive summary powerpoint templates microsoft. This is a executive summary powerpoint templates microsoft. This is a four stage process. The stages in this process are accreditation, capabilities, background, promoters and shareholding.
-
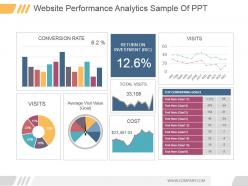 Website performance analytics sample of ppt
Presenting website performance analytics sample of ppt. This is a website performance analytics sample of ppt. This is a three stage process. The stages in this process are conversion rate, visits, average visit value goal, return on investment ric, total visits, cost, visits, top converting goals, jan, feb, mar, apr, may, jun, jul, aug, sep, oct, nov, dec, goal.
-
 Information technology kpi dashboard showing overdue tasks deadlines
Introducing information technology KPI dashboard showing overdue tasks deadlines PowerPoint template. PPT slides offer a thorough editable customization of font, color, and orientation of high powered info-graphics. Quick and easy downloading process. Suitable for business managers and professionals. Sufficient space is available for the easy placement of desired content. Templates are compatible with wide range of software such as pdf/jpeg/Jpg. PPT design can be access in standard and widescreen view. Editing instructions are explained step by step.
-
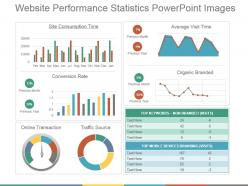 Website performance statistics powerpoint images
We present to you our website performance statistics PowerPoint images. You can change the placement, the size or the color of the graphical images used in the template. You can make numerous changes by following the instructions given in sample slides, as this PPT is fully editable. This template can be saved in either PDF or JPG format. You can view the presentation in widescreen display ratio of 16:9 or standard size display ratio of 4:3. So download, edit and present it.
-
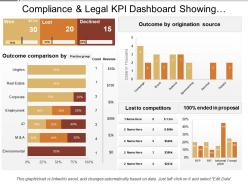 Compliance and legal kpi dashboard showing outcome comparison
Presenting this set of slides with name - Compliance And Legal Kpi Dashboard Showing Outcome Comparison. This is a three stage process. The stages in this process are Compliance And Legal, Legal Governance, Risk Management.
-
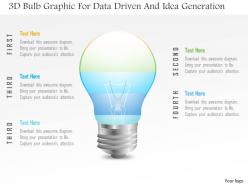 1214 3d bulb graphic for data driven and idea generation powerpoint slide
Multiple choice to display presentation slide in standard and widescreen view. 100% editable PowerPoint design as can be modified easily. These have a futuristic approach. Valuable for business professionals, sales representatives, marketing professionals, students and researchers. These can easily grab the attention of audience. PPT templates are well-matched with Google slides.
-
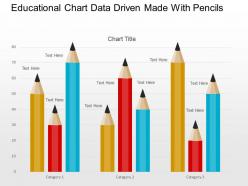 Educational chart data driven made with pencils powerpoint slides
Format slide pie outline is completely changeable. Downloading layout in any format decisions like JPEG, JPG or PDF is simple and brisk. Provide a pro perspective to your format slides. Highly apparent with Google slides. Symbols are in like way being joined. Customization of content, representation, outlines, and substance as appeared by your aching and need. Visuals don't obscure when opened on widescreen. Company logo, name and trademark can be effectively installed.
-
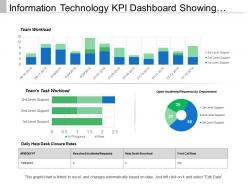 Information technology kpi dashboard showing team task workload
Presenting this set of slides with name - Information Technology Kpi Dashboard Showing Team Task Workload. This is a three stage process. The stages in this process are Information Technology, It, Iot.
-
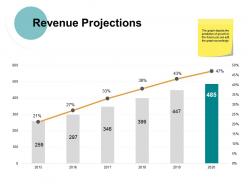 Revenue projections ppt powerpoint presentation file designs download
Presenting this set of slides with name - Revenue Projections Ppt Powerpoint Presentation File Designs Download. This is a two stage process. The stages in this process are Finance, Management, Strategy, Business, Marketing.
-
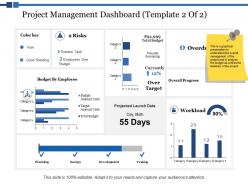 Project management dashboard risks ppt powerpoint presentation styles outfit
This is a threee stages process. The stages in this process are Finance, Marketing, Management, Investment, Analysis.


