- Sub Categories
-
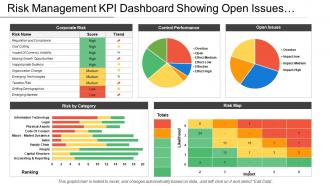 Risk Management Kpi Dashboard Showing Open Issues And Control Performance
Presenting this set of slides with name - Risk Management Kpi Dashboard Showing Open Issues And Control Performance. This is a five stage process. The stages in this process are Risk Management, Risk Assessment, Project Risk.
-
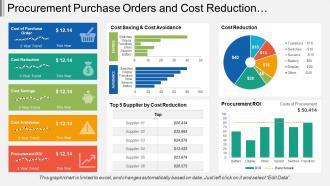 Procurement Purchase Orders And Cost Reduction Dashboard
Presenting this set of slides with name - Procurement Purchase Orders And Cost Reduction Dashboard. This is a five stage process. The stages in this process are Purchase, Procurement, Buy.
-
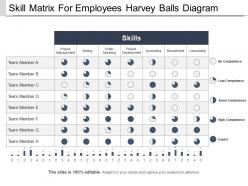 Skill matrix for employees harvey balls diagram ppt background
Presenting this set of slides with name- Skill Matrix for employees Harvey Balls Diagram PPT Background. Get easy access to this customizable template. You can change the color, text and font size as per your need. You can add or delete the content wherever required. Its compatibility with Google Slides makes it readily available. The PPT slide is available both in standard as well widescreen size. Convert and save this PPT slide in both PDF and JPG format.
-
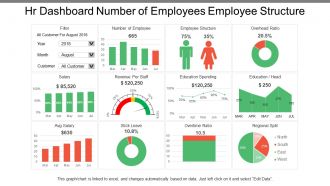 Hr Dashboard Number Of Employees Employee Structure
Presenting this set of slides with name - Hr Dashboard Number Of Employees Employee Structure. This is a four stage process. The stages in this process are Hr Dashboard, Human Resource Dashboard, Hr Kpi.
-
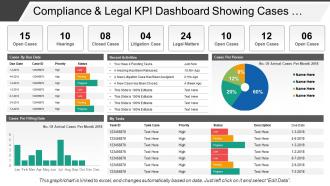 Compliance And Legal Kpi Dashboard Showing Cases By Due Date
Presenting this set of slides with name - Compliance And Legal Kpi Dashboard Showing Cases By Due Date. This is a four stage process. The stages in this process are Compliance And Legal, Legal Governance, Risk Management.
-
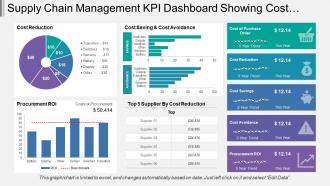 Supply Chain Management Kpi Dashboard Showing Cost Reduction And Procurement Roi
Presenting this set of slides with name - Supply Chain Management Kpi Dashboard Showing Cost Reduction And Procurement Roi. This is a five stage process. The stages in this process are Demand Forecasting, Predicting Future Demand, Supply Chain Management.
-
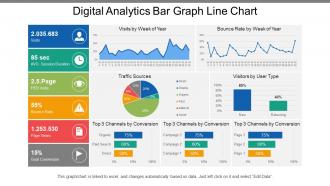 Digital analytics bar graph line chart
Presenting this set of slides with name - Digital Analytics Bar Graph Line Chart. This is a five stage process. The stages in this process are Digital Analytics, Digital Dashboard, Digital Kpis.
-
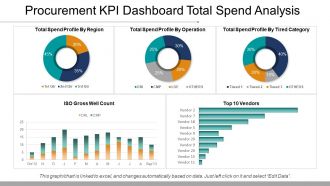 Procurement Kpi Dashboard Total Spend Analysis Ppt Samples
Presenting procurement kpi dashboard total spend analysis ppt samples. This is a procurement kpi dashboard total spend analysis ppt samples. This is a five stage process. The stages in this process are business, strategy, growth, finance, chart and graph.
-
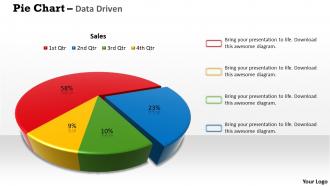 Data driven 3d pie chart for business process powerpoint slides
We are proud to present our data driven 3d pie chart for business process powerpoint slides. Our Data Driven 3D Pie Chart For Business Process Powerpoint Slides Power Point Templates Give Good Value For Money. They Also Have Respect For The Value Of Your Time. Take A Leap Off The Starting Blocks With Our Data Driven 3D Pie Chart For Business Process Powerpoint Slides Power Point Templates. They Will Put You Ahead Of The Competition In Quick Time.
-
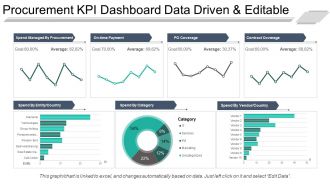 Procurement kpi dashboard snapshot data driven and editable ppt sample file
Presenting procurement kpi dashboard snapshot data driven and editable ppt sample file. This is a procurement kpi dashboard data driven and editable ppt sample file. This is a seven stage process. The stages in this process are business, strategy, growth, finance, chart and graph.
-
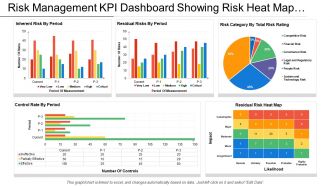 Risk Management Kpi Dashboard Showing Risk Heat Map And Control Rate By
Presenting this set of slides with name - Risk Management Kpi Dashboard Showing Risk Heat Map And Control Rate By Period. This is a five stage process. The stages in this process are Risk Management, Risk Assessment, Project Risk.
-
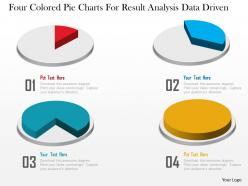 1214 Four Colored Pie Charts For Result Analysis Data Driven Powerpoint Slide
We are proud to present our 1214 four colored pie charts for result analysis data driven powerpoint slide. Four colored pie charts are used to craft this power point template slide. This PPT slide contains the concept of data driven result analysis. This PPT can be used for business and finance related presentations
-
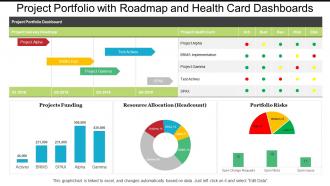 Project portfolio with roadmap and health card dashboards
Presenting, project portfolio with roadmap and health card dashboards. This Design possesses a construction that not only has a high market need but also displays clear judgment about the details and concept of the organization. It is obvious that there are various risks involved in a new business process so selecting an active medium to propose the message and other learning is very vital. These PPT designs have an addition to the advantage that these are pre-designed which makes it even more convenient for the new business.
-
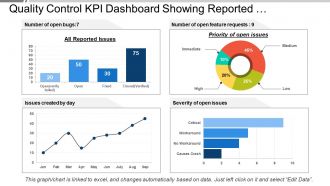 Quality control kpi dashboard showing reported issues and priority
Presenting this set of slides with name - Quality Control Kpi Dashboard Showing Reported Issues And Priority. This is a four stage process. The stages in this process are Quality Management, Quality Control, Quality Assurance.
-
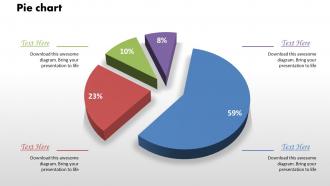 0414 business comparison pie chart powerpoint graph
Useful in business related presentations and professionals working in marketing agencies. No pixilation as the graphics are high end. Convertible into common format like JPEG and PDF. No space constraints when adding titles and sub-titles. Amendable in terms of color, font, text and design ensure pin-point control to the user. Does not occupy much space and is easy to download. Allows adding of company’s logo, name and trademark.
-
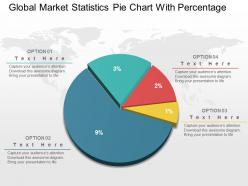 Global market statistics pie chart with percentage powerpoint slides
We are proud to present our global market statistics pie chart with percentage powerpoint slides. Explain the global market statistics with this power point template diagram. This PPT diagram contains the graphic of pie chart and percentage. Use this PPT diagram for global marketing and business related presentations.
-
 Project health card ppt gallery rules
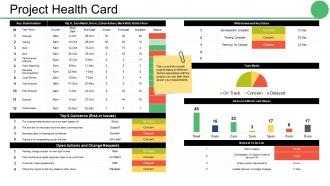
Presenting health card PPT gallery rules. This layout is fully compatible with Google slides and data driven. User can edit the data in linked excel sheet and graphs and charts gets customized accordingly. Easy to put in company logo, trademark or name; accommodate words to support the key points. Images do no distort out even when they are projected on large screen. Adjust colors, text and fonts as per your business requirements
-
 Key design pie chart with idea generation process control powerpoint slides
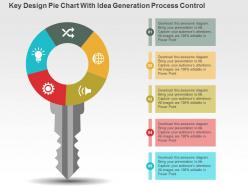
Skillfully crafted Presentation layout. Completely modifiable PowerPoint visual as some elements are editable. Easiness of personalization with your company name and logo. PPT diagram can be downloaded easily and transform into JPG and PDF format. Choice to access similar designs with different stages. PowerPoint slide can be projected in standard and widescreen view. Awesome use of colors and innovatively designed.
-
 Program management kpi dashboard showing project health and progress
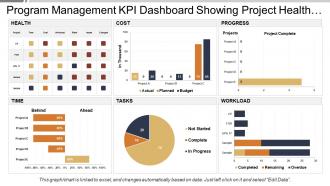
Presenting this set of slides with name - Program Management Kpi Dashboard Showing Project Health And Progress. This is a six stage process. The stages in this process are Program Development, Human Resource Management, Program Management.
-
 Year in review business powerpoint ideas
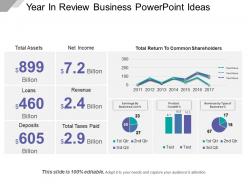
Presenting Year In Review Business PowerPoint Ideas. Get this Excel linked PPT slide and deliver quality presentations to your audience. You are free to make changes in any part of the slide. Modify the colors as per your choice, change the font type and font size and save this in JPG and PDF formats. This is entirely compatible with Google Slides and can be viewed on the standard screen and widescreen.
-
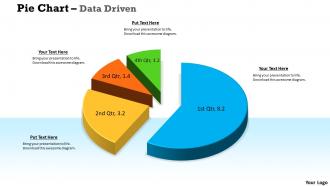 Data driven 3d data in segments pie chart powerpoint slides
We are proud to present our data driven 3d data in segments pie chart powerpoint slides. Whatever The Nuance You Want To Project. We Have A Data Driven 3D Data In Segments Pie Chart Powerpoint Slides Power Point Templates That Will Get It Across. Create A Connection With Your Audience Using Our Data Driven 3D Data In Segments Pie Chart Powerpoint Slides Power Point Templates. Transfer Your Depth Of Knowledge Clearly Across To Them.
-
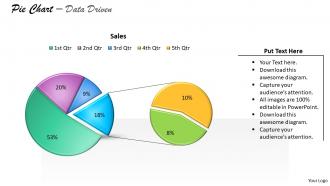 Data driven pie chart for business stratregy powerpoint slides
We are proud to present our data driven pie chart for business stratregy powerpoint slides. Use this diagram to show the steps as they actually occur in the process. Different color has been used in this diagram to represent each step which will help you to understand and depict the flow more accurately.
-
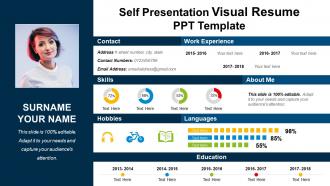 Self presentation visual resume ppt template
Highlighting self presentation visual resume PPT template. Hasty download and easily adapt into JPEG and PDF document. Preferences showcase presentation design in standard and widescreen display view. Availability alters the design with enterprise name, image, icon and picture. High quality PowerPoint layout comes with modification options as color, text and font and other elements can be edited. Presentation PPT template is available with different nodes and stages and can be merged with Google Slides.
-
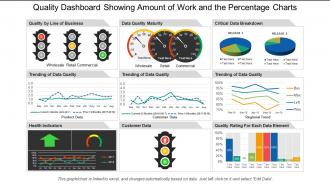 Quality dashboard snapshot showing customer product data with data quality
SlideTeam feels immense pleasure in presenting to you its 100% customizable and user-friendly quality dashboard snapshot showing customer data with data quality. The business slides can be viewed in widescreen display ratio of 16:9 or standard size display ratio of 4:3 after being downloaded. The PPT presentation lets you insert or remove any given feature from the redesigned set of slides. You can also save the slideshow in format of PDF or JPG and also it is compatible with Google Slides. So hit download, edit it and present it.
-
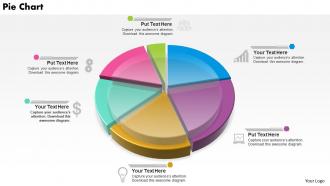 0514 multicolored data driven pie chart powerpoint slides
Perfect presentation slide for highlighting financial and sales data. Presentation slides are fully well-matched with Google slides. Convenient to be used on a wide screen view. No effect on the picture quality whatever be the size of your screen. High resolution quality PPT template designs. Simple to download and convert into JPEG or PDF document. PowerPoint template accessible with different pie slices composition. Reliable and accurate PPT slides.
-
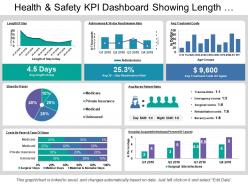 Health and safety kpi dashboard showing length of stay and treatment costs
Presenting this set of slides with name - Health And Safety Kpi Dashboard Showing Length Of Stay And Treatment Costs. This is a seven stage process. The stages in this process are Health And Safety, Health And Security, Health And Protection.
-
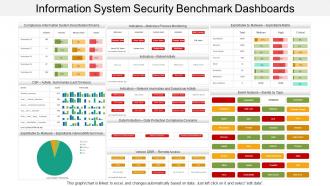 Information system security benchmark dashboards
Presenting this set of slides with name - Information System Security Benchmark Dashboards. This is a three stage process. The stages in this process are Information Security Strategy, Information Security Plan, Information Protection Strategy.
-
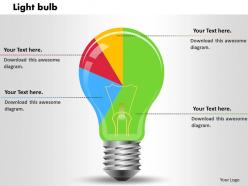 0414 light bulb shapes pie chart powerpoint graph
We are proud to present our 0414 light bulb shapes pie chart powerpoint graph. Dig in to our vast array of Light Bulb Shapes Pie Chart Powerpoint Graph Powerpoint Templates. Be sure to come with many that fit your need perfectly. Unleash the value of your experience with our Light Bulb Shapes Pie Chart Powerpoint Graph Powerpoint Templates. Educate your team with the knowledge you have gained.
-
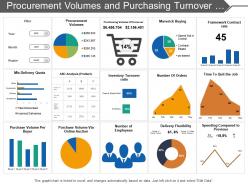 Procurement volumes and purchasing turnover dashboard
Presenting this set of slides with name - Procurement Volumes And Purchasing Turnover Dashboard. This is a four stage process. The stages in this process are Purchase, Procurement, Buy.
-
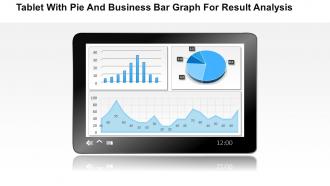 1214 tablet with pie and business bar graph for result analysis powerpoint slide
Exquisitely designed PowerPoint slide with great image quality. Editable images, icons, colors, text and layout as per the industry requisite. Alternative to add brand name and theme to customize. Presentation shape can be downloaded and save into JPG and PDF format. PPT design layout obtainable in standard and widescreen view. Fully flexible slide design with Google slides. Effortless to adjust and present when required. Innovatively designed to share the complex data in easy manner with graphs and charts. Easy to transmit any message effectively when shared even with large audience.
-
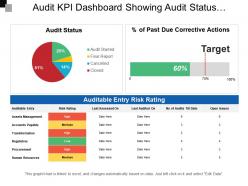 Audit kpi dashboard showing audit status auditable entry risk rating
Presenting this set of slides with name - Audit Kpi Dashboard Showing Audit Status Auditable Entry Risk Rating. This is a four stage process. The stages in this process are Audit, Examine, Survey.
-
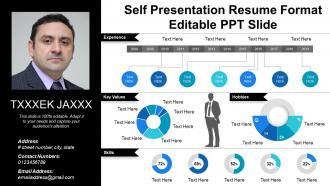 Self presentation resume format editable ppt slide
Presenting self presentation resume format editable PPT slide which is thoroughly editable, data driven i.e. excel linked and fast to download. The presenter can customize and personalize this PPT slide it to meet his / her own specifications. This presentation has been designed by plethora of professional expertise. This PowerPoint shape is fully compatible with Google Slides, multiple software and format options. This slideshow can be saved as JPG and / or in PDF. For your kind assistance, editing instructions are also provided.
-
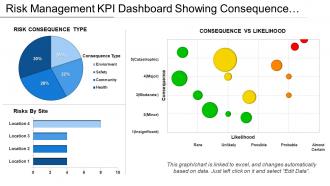 Risk Management Kpi Dashboard Showing Consequence Vs Likelihood
Presenting this set of slides with name - Risk Management Kpi Dashboard Showing Consequence Vs Likelihood. This is a three stage process. The stages in this process are Risk Management, Risk Assessment, Project Risk.
-
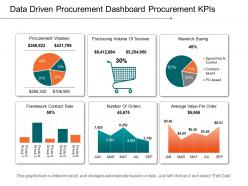 Data driven procurement dashboard snapshot procurement kpis example of ppt
Pre-designed data driven procurement dashboard for Kpis presentation template. Can be used for statistical data analysis. High-resolution PowerPoint presentation backgrounds for better clarity of the information displayed. Offers wide variety of options and colors to alter the appearance. Allows adding of enterprise personal details such as brand name, logo and much more. Enough space available to enter text and its related points in the PPT table. This PPT Slide is available in both Standard and Widescreen slide size. Compatible with multiple formats like JPEG, PDF and Google slides.
-
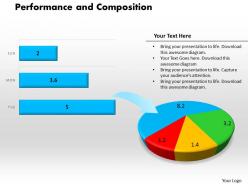 0414 performance and composition bar pie chart powerpoint graph
High resolution visuals. Ease of download. Compatible with numerous format options. Compatible with multiple online and offline software options. Thoroughly editable slide design background. Ease of inclusion and exclusion of slide content as per the need of an hour. Freedom to include the company specific name, logo and trademark, so as to personalize the presentation. Used by business professionals, finance students, marketing students, and teachers.
-
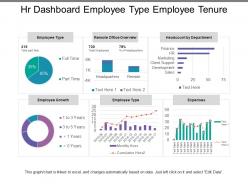 Hr dashboard employee type employee tenure
Presenting this set of slides with name - Hr Dashboard Employee Type Employee Tenure. This is a six stage process. The stages in this process are Hr Dashboard, Human Resource Dashboard, Hr Kpi.
-
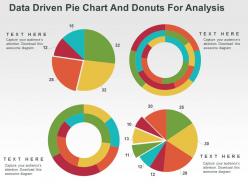 Data driven pie chart and donuts for analysis powerpoint slides
Presenting data driven pie chart and donuts for analysis PowerPoint template. High-resolution PowerPoint presentation backgrounds for better clarity of the information displayed. Offers wide variety of options and colors to alter the appearance. Allows adding of enterprise personal details such as brand name, logo and much more. Enough space available to enter text and its related points in the PPT table. This PPT Slide is available in both Standard and Widescreen slide size. Compatible with multiple formats like JPEG, PDF and Google slides.
-
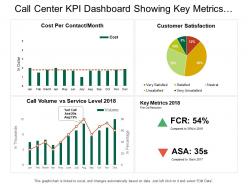 Call center kpi dashboard snapshot showing key metrics customer satisfaction
Introducing call center kpi dashboard snapshot showing key metrics customer satisfaction presentation template. Slide designs quality does not deflect when opened on a wide screen show. Inconvenience free fuse of tweaked shading, content and illustrations. Slide incorporates instructional slides to give direction to change the graphical substance. Spare the presentation graphics in JPG or PDF organize. Successfully valuable for the systems administration experts, mediators and the procedure architects, it administrators, data innovation firms. Format slide with various stages or hubs are accessible. Simplicity of download.
-
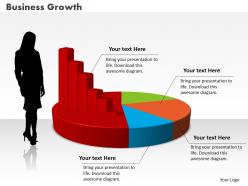 0414 business women with column pie chart powerpoint graph
Access to change the content or insert information. No concession with the quality, once opened on wide screen. Compatible with Microsoft office software and the Google slides. Modify and personalize the presentation by including the company name and logo. Guidance for executing the changes has been provided for assistance. Amendable presentation slide with pie chart. High resolution of diagrams and graphics.
-
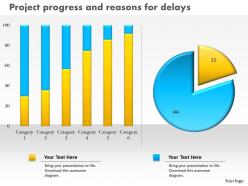 0414 project progress with column and pie chart powerpoint graph
Runs with all the softwares and is compatible with Google slides. Does not use much space and is easy to download. Provision to add name and logo of the company. Picture graphics never pixilate even if projected on bigger screens. Add titles and sub-titles as there is plenty of space. Changeable layout in terms of font text, color, design and orientation. Convertible into JPEG and PDF formats. Useful for business and progress related presentations.
-
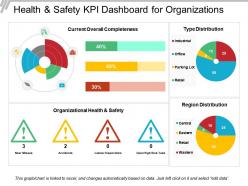 Health and safety kpi dashboard for organizations
Presenting this set of slides with name - Health And Safety Kpi Dashboard For Organizations. This is a four stage process. The stages in this process are Health And Safety, Health And Security, Health And Protection.
-
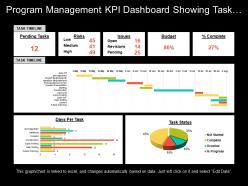 Program management kpi dashboard showing task timeline risks and budget
Presenting Program Management KPI Dashboard Showing Task Timeline Risks And Budget PPT slide. The task timeline dashboard PowerPoint template designed professionally by the team of SlideTeam to present the values over time. The different icons such as pie chart, line chart, as well as other figures and text in the Graphical Chart KPI dashboard slide are customizable in PowerPoint. A user can illustrate the desired numerical information because the graphical management dashboard template gets linked with Excel Sheet. The management dashboard slide is compatible with Google Slide. You may edit the font size, font type, color and dimensions of the different chart to present the desired numerical information.
-
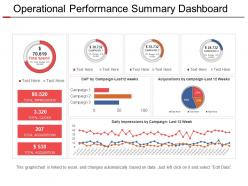 Operational performance summary dashboard presentation design
Presenting operational performance summary dashboard presentation design PowerPoint slide. This deck offers you plenty of space to put in titles and sub titles. High resolution-based layout does not change the image even after resizing. This presentation icon is fully compatible with Google slides. Quick downloading speed and simple editing options in color text and fonts.PPT icons can easily be changed into JPEG and PDF applications. This diagram has been designed for entrepreneurs, corporate and business managers. Easy to use, edit and you can design attractive slides within few minutes.
-
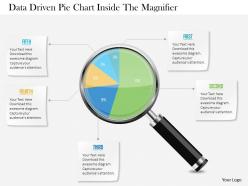 1214 data driven pie chart inside the magnifier powerpoint slide
Presenting, 1214 data-driven pie chart inside the magnifier PowerPoint slide. Hassle free, easy and fast download. Fully modifiable text as per your requirement. Modify the color design and contrast to suit the contextual requirement. Completely editable orientation and size of PPT icons. Enter your own company logo, tagline, watermark, trademark etc. to personalize. The steps in this process determine the objective, identify areas for improvement and much more. Can be projected on wide screens.
-
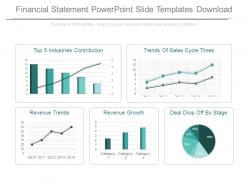 Financial statement powerpoint slide templates download
Presenting financial statement powerpoint slide templates download. This is a financial statement powerpoint slide templates download. This is a five stage process. The stages in this process are top 5 industries contribution, trends of sales cycle times, revenue trends, revenue growth, deal drop off by stage.
-
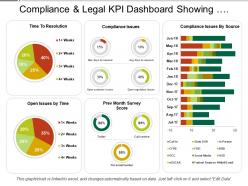 Compliance and legal kpi dashboard showing compliance issues and resolution time
Presenting this set of slides with name - Compliance And Legal Kpi Dashboard Showing Compliance Issues And Resolution Time. This is a three stage process. The stages in this process are Compliance And Legal, Legal Governance, Risk Management.
-
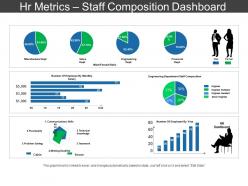 Hr metrics staff composition dashboard sample ppt files
Presenting HR Metrics Staff Composition Dashboard Sample PPT Files which is completely editable. You can open and save your presentation in various formats like PDF, JPG, and PNG. Freely access this template in both 4:3 and 16:9 aspect ratio. Change the color, font, font size, and font type of the slides as per your requirements. This template is adaptable with Google Slides which makes it easily accessible at once.
-
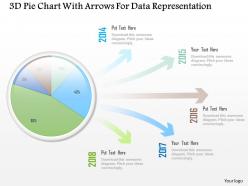 1214 3d pie chart with arrows for data representation powerpoint slide
The PPT images offer compatibility with Google templates. High resolution icons for clear message delivery. An easy access to make the desired changes or edit it anyways. Wide screen view of the slides. Easy conversion into Jpeg or Pdf format. Unique and informational content. Valuable for business professionals, sales representatives, marketing professionals, students and selling investigators.
-
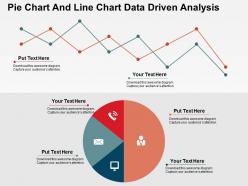 Pie chart and line chart data driven analysis powerpoint slides
PowerPoint Template for professionals for pie chart and line chart data driven analysis. Highly beneficial for professionals from diverse companies. Editable charts, colors and text. Adequate space available in each PowerPoint slide to insert text as desired. Manual option available to alter color or PowerPoint image. Simply click to add company logo, trademark or name.
-
 Compliance and legal kpi dashboard showing high priority violations
Presenting this set of slides with name - Compliance And Legal Kpi Dashboard Showing High Priority Violations. This is a six stage process. The stages in this process are Compliance And Legal, Legal Governance, Risk Management.
-
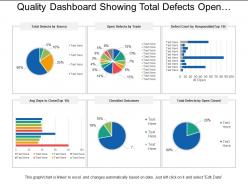 Quality dashboard showing total defects open defects checklist outcome
SlideTeam brings to you its totally editable and user-friendly quality dashboard showing total defects checklist outcome. This set of predesigned slides has been designed in such a manner that you can change the font style, font color and font size, etc. of the text used in the slides. After you download the PPT it can be viewed in standard size display ratio of 4:3 or widescreen display ratio of 16:9. The business template is very easy to use as it is compatible with Google Slides.
-
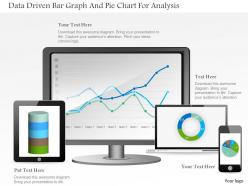 1214 data driven bar graph and pie chart for analysis powerpoint slide
We are proud to present our 1214 data driven bar graph and pie chart for analysis powerpoint slide. This Power point template slide has been crafted with graphic of bar graph and pie chart . These graph and charts are data driven. Display any analysis with this exclusive PPT slide and build professional presentation.
-
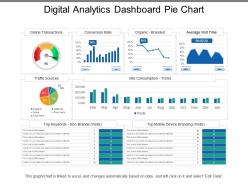 Digital analytics dashboard pie chart
Presenting this set of slides with name - Digital Analytics Dashboard Pie Chart. This is a five stage process. The stages in this process are Digital Analytics, Digital Dashboard, Digital Kpis.
-
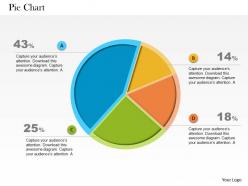 0514 unique designed pie chart data driven powerpoint slides
Easily operate this slide on all compatible software. Swift download and use of slide. Company logo, trademark or name can be aptly placed for specificity. Project on widescreen without worrying about PPT graphics pixelation. Compatible with google slides. Editable layout including font, text, color, design. Show titles and sub titles without feeling constrained in terms of available space. High resolution PPT slides. Useful in businesses, small and large, operational and strategic firms, startups, educational institutes, research institutes (especially PhD students).
-
 Data driven percentage breakdown pie chart powerpoint slides
We are proud to present our data driven percentage breakdown pie chart powerpoint slides. The above PowerPoint template contains a graphic of pie chart.This diagram can be used to represent the relationship and interconnectivity between various stages of a process.This diagram is wonderful tool to serve ypur purpopse.
-
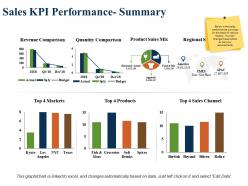 Sales kpi performance summary revenue comparison product sales mix
Presenting this set of slides with name - Sales Kpi Performance Summary Revenue Comparison Product Sales Mix. This is a three stage process. The stages in this process are Revenue Comparison, Quantity Comparison, Product Sales Mix, Regional Sales Mix, Top Sales Channel.
-
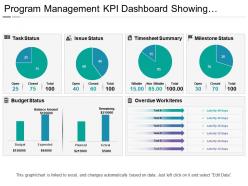 Program management kpi dashboard showing timesheet summary
Presenting Program Management KPI Dashboard Showing Timesheet Summary PPT slide. The Program management KPI dashboard PowerPoint template designed professionally by the team of SlideTeam to present the record of timesheet summary to do any task. The pie chart and line chart figures along with that the text in the timesheet summary dashboard slide are customizable in PowerPoint. A user can illustrate the specific time to do any task because the pie chart dashboard template gets linked with Excel Sheet along with that it is also compatible with Google Slide. A user can alter the font size, font type, color, as well as dimensions of the pie and line chart to present the specific time.
-
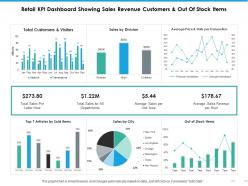 Retail kpi dashboard showing sales revenue customers and out of stock items
Presenting this set of slides with name - Retail Kpi Dashboard Showing Sales Revenue Customers And Out Of Stock Items. This is a six stage process. The stages in this process are Percentage, Product, Management, Marketing, Business.
-
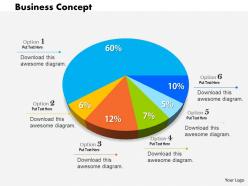 0514 colored pie chart for result data driven analysis powerpoint slides
We are proud to present our 0514 colored pie chart for result data driven analysis PowerPoint slides. • Quick download • Colored infographic which are easily editable with texts and numbers • Can easily be adjusted to screen size of any measurement without any fear of pixilation • Compatibility with Google slides and other software options • Can be transformed into other format options like JPEG, JPG, PDF, etc. • Easy to customize and personalize with company specific information. • Ease of inclusion and exclusion of content as per need. • Widely used by business professionals like financial analysts and others apart from students and teachers.
-
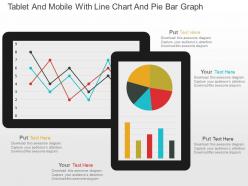 Tablet and mobile with line chart and pie bar graph powerpoint slides
Editable PPT Slide for viewing quarterly track record line chart. Compatible with numerous format options like JPEG, JPG or PDF. Access to inclusion and exclusion of contents as per specific needs of any business. Provides a professional outlook to your PowerPoint presentation. Beneficial for business professionals, students, teachers, business analysts and strategists. Customization of each PowerPoint graphic and text according to your desire and want.


