- Sub Categories
-
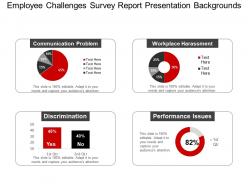 Employee challenges survey report presentation backgrounds
Presenting employee challenges survey report presentation backgrounds. This is a employee challenges survey report presentation backgrounds. This is a four stage process. The stages in this process are survey, forecasting, statistics.
-
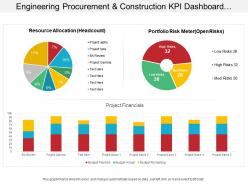 Engineering procurement and construction kpi dashboard having project financials and resource allocation
Presenting this set of slides with name - Engineering Procurement And Construction Kpi Dashboard Having Project Financials And Resource Allocation. This is a three stage process. The stages in this process are Engineering, Procurement And Construction, Construction Management, Engineering, Purchasing And Construction .
-
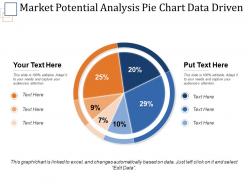 Market potential analysis pie chart data driven ppt slide
Presenting the slide named Market potential analysis Pie chart data driven PPT slide. This template with high-quality graphics is professionally designed. With an option to change the size, style and color of the font, this slide is totally editable. You can customize the text and color of the diagram as well as the background as per your discretion. The slide is compatible with Google Slides which make it easily accessible. You can customize and save the file as JPG or PDF formats. Once the pie chart is linked to excel, it automatically changes based on the data. Use this readymade template to analyse website visits instantly.
-
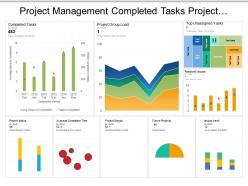 Project management completed tasks project group load dashboard
Preference to present design in standard and widescreen display view. PowerPoint design is goes well with Google slides. Fine quality Presentation template comes with editing options as color, text and font can be edited at any stage. Present the PPT slide by addition of business logo. Fast download and simple transform into JPEG and PDF document. Presentation design is downloadable with different nodes and stages. PowerPoint diagram comes with high resolution pixels.
-
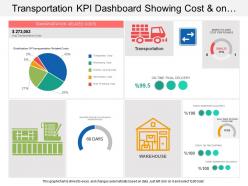 Transportation kpi dashboard showing cost and on time final delivery
Presenting transportation KPI dashboard showing cost and on time final delivery PPT slide. This deck offers you plenty of space to put in titles and sub titles. This template is Excel linked just right click to input your information. High resolution based layout, does not change the image even after resizing. This presentation icon is fully compatible with Google slides. Quick downloading speed and simple editing options in color text and fonts.PPT icons can easily be changed into JPEG and PDF applications.
-
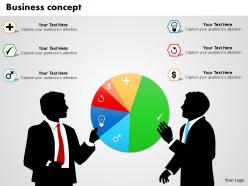 0514 3d pie chart data driven application diagram powerpoint slides
High-resolution images and the slide icons. Allow saving in the multiple formats like JPG or PDF format. Easy to edit and customize the content or the slide icons. 100% access to edit the background, style and orientation of the slide icons once downloaded. Provided guidance to customize the background or the slide icons content. Beneficial for the business leaders, sales and marketing professionals.
-
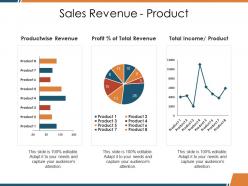 Sales revenue product ppt picture
Presenting this set of slides with name - Sales Revenue Product Ppt Picture. This is a three stage process. The stages in this process are Productwise Revenue, Total Revenue, Total Income, Business, Marketing.
-
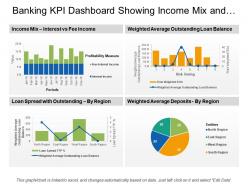 Banking kpi dashboard showing income mix and loan spread
Presenting this set of slides with name - Banking Kpi Dashboard Showing Income Mix And Loan Spread. This is a four stage process. The stages in this process are Banking, Finance, Money.
-
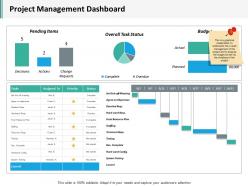 Project management dashboard snapshot ppt inspiration ideas
Presenting this set of slides with name - Project Management Dashboard Snapshot Ppt Inspiration Ideas. This is a three stage process. The stages in this process are Business, Management, Strategy, Analysis, Marketing.
-
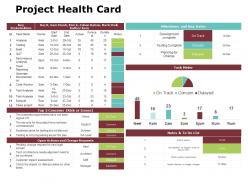 Project health card slide2 ppt powerpoint presentation gallery slides
Presenting this set of slides with name - Project Health Card Slide2 Ppt Powerpoint Presentation Gallery Slides. This is a two stage process. The stages in this process are Business, Management, Strategy, Analysis, Marketing.
-
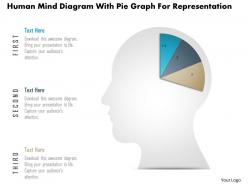 1214 human mind diagram with pie graph for representation powerpoint slide
We are proud to present our 1214 human mind diagram with pie graph for representation powerpoint slide. Human mind diagram with pie graph has been used to design this power point template slide. This PPT slide can be used for business data driven analysis and build an exclusive presentation for your viewers.
-
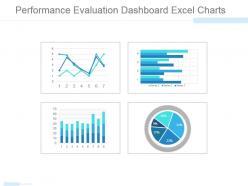 Performance evaluation dashboard excel charts powerpoint topics
Presenting performance evaluation dashboard excel charts powerpoint topics. This is a performance evaluation dashboard excel charts powerpoint topics. This is a four stage process. The stages in this process are graph, finance, dashboard, pie, business.
-
 0414 gear in bulb with pie chart powerpoint graph
We are proud to present our 0414 gear in bulb with pie chart powerpoint graph. Our Gear In Bulb With Pie Chart Powerpoint Graph Powerpoint Templates come in all colours shades and hues. They help highlight every nuance of your views. Our Gear In Bulb With Pie Chart Powerpoint Graph Powerpoint Templates will fulfill your every need. Use them and effectively satisfy the desires of your audience.
-
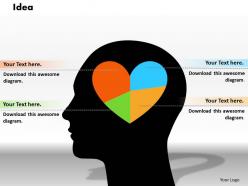 0414 pie chart human heart shape powerpoint graph
We are proud to present our 0414 pie chart human heart shape powerpoint graph. Hit The Right Notes With Our Pie Chart Human Heart Shape Powerpoint Graph Power Point Templates. Watch Your Audience Start Singing To Your Tune. Walk Your Team Through Your Plans Using Our Pie Chart Human Heart Shape Powerpoint Graph Power Point Templates. See Their Energy Levels Rise As You Show Them The Way.
-
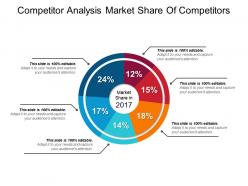 Competitor analysis market share of competitors ppt inspiration
Presenting competitor analysis market share of competitors PPT inspiration PPT slide. This presentation slide is widely applicable by a team of managers and business analyst who foresee the business in light of prosperity, by students and others. PPT has impressive picture quality with high resolution. 100 percent editable slide design. There is freedom to execute the changes in color, font, text and more as per one’s personal choice. Ease of personalization with your company name and logo. PPT is compatible with a wide variety of format options. PPT is harmonious with a set of software options, available both online and offline.
-
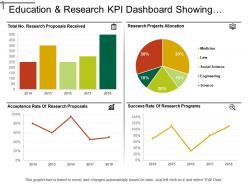 Education and research kpi dashboard showing research project allocation
Presenting education and research KPI dashboard showing research project allocation PPT slide. The project reporting design presentation template designed by professional team of SlideTeam. The research project PPT slide is fully customizable in PowerPoint. The project allocation dashboard PowerPoint slide is also compatible with Google Slide so a user can share this slide with others. A user can make changes in the font size, font type, color as well as dimensions of the allocated project report detail slide as per the requirement. You may edit the value in the education KPI dashboard PowerPoint template as the slide gets linked with the Excel sheet.
-
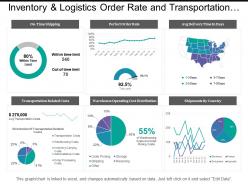 Inventory and logistics order rate and transportation costs dashboards
Presenting this set of slides with name - Inventory And Logistics Order Rate And Transportation Costs Dashboards. This is a three stage process. The stages in this process are Inventory And Logistics, Inventory Management, Warehousing And Inventory Management.
-
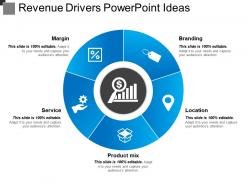 Revenue drivers powerpoint ideas
Presenting revenue drivers PowerPoint ideas PPT template. You can download the template and save into JPG & PDF format and can also display in the standard & widescreen view. You may alter the slide such as color, text, font type, font size and aspect ratio. The template gets synced with Google Slides and editable in PowerPoint. You may share this slide with large segment because it has tremendous pixel quality. You can insert the relevant content in text placeholder of this template.
-
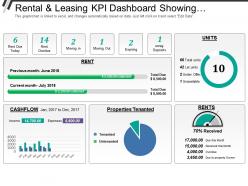 Rental and leasing kpi dashboard showing rent due today rent overdue properties tenanted
Presenting this set of slides with name - Rental And Leasing Kpi Dashboard Showing Rent Due Today Rent Overdue Properties Tenanted. This is a five stage process. The stages in this process are Rental And Leasing, Dealing And Leasing, Rental And Engage.
-
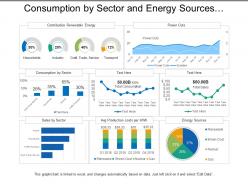 Consumption by sector and energy sources utilities dashboard
Presenting this set of slides with name - Consumption By Sector And Energy Sources Utilities Dashboard. This is a three stage process. The stages in this process are Utilities, Use, Advantage.
-
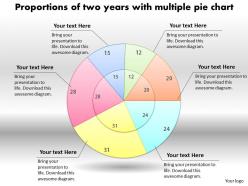 0414 multiple pie chart business layout powerpoint graph
Pixel-rich quality of the images and the graphics in the slides. Allow instant downloading and saving of the slide design. Visually appealing content and the slide graphics. Compatible with the Google Slides and other offline softwares. Easy to insert the company’s logo or brand name. Useful for the marketing professionals, strategy designers and the business entrepreneurs.
-
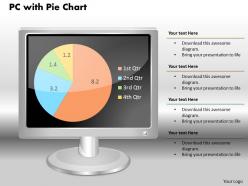 0414 pie chart pc monitor design powerpoint graph
We are proud to present our 0414 pie chart pc monitor design powerpoint graph. Our Pie Chart PC Monitor Design Powerpoint Graph Power Point Templates Are Created With Admirable Insight. Use Them And Give Your Group A Sense Of Your Logical Mind. Use Our Pie Chart PC Monitor Design Powerpoint Graph Power Point Templates To Bullet Point Your Ideas. See Them Fall Into Place One By One.
-
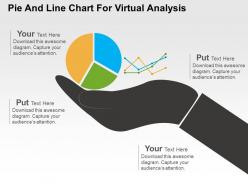 Pie and line chart for virtual analysis powerpoint slides
High resolution PPT example for pie and line chart for virtual analysis. Increase the level of personalization with your company logo and name. Compatible with all software and can be saved in any format. Useful tool for students, business analysts, sales people, sales managers and professionals of any industry. Precise and easy to comprehend information on PPT sample. Useful for marketing and business related presentations.
-
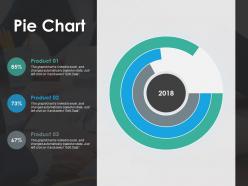 Pie chart ppt show infographic template
Presenting this set of slides with name - Pie Chart Ppt Show Infographic Template. This is a three stage process. The stages in this process are Percentage, Product, Management, Marketing, Business.
-
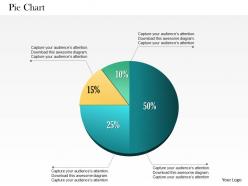 0514 4 staged 3d data driven pie chart powerpoint slides
Easy proofing and editing is added on feature of presentation visual. Presentation slide is useful in business marketing, management and recourse disbursement. Basic theme yet it can modified with respect to font, color and layout. Attractive color scheme gives a professional look to PPT layout. Conversion into PDF or JPG formats is very easy and handy. PPT graphic offers font size which can be read from a distance. Shapes are in vector format and can be edited.
-
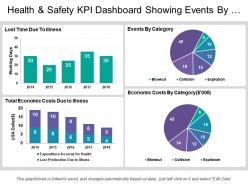 Health and safety kpi dashboard showing events by category
Presenting health and safety presentation template. This modern dashboard design is fully editable and is created under the strict supervision of professionals. You can bring changes to the objects in the slide like font size and font color hassle-free. This presentation slide is fully compatible with Google Slide and can be saved in JPG or PDF file format without any hassle. Fast download this at the click of the button.
-
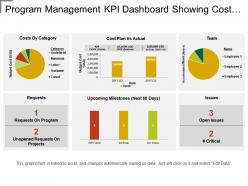 Program management kpi dashboard showing cost plan vs actual
Presenting this set of slides with name - Program Management Kpi Dashboard Showing Cost Plan Vs Actual. This is a six stage process. The stages in this process are Program Development, Human Resource Management, Program Management.
-
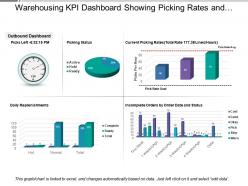 Warehousing kpi dashboard showing picking rates and daily replenishments
The professionally built, business oriented slide is completely editable; you can modify and customize the design according to your business needs. You may include business logo, trademarks to personalize the slideshow. The slideshow can be opened and updated with Google Slides and MS PowerPoint software. Quick and easy downloading available; PPT design can be downloaded as JPEG or PDF format.
-
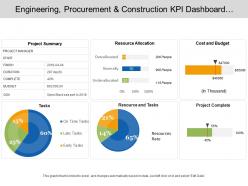 Engineering procurement and construction kpi dashboard showing project summary cost and budget
Presenting this set of slides with name - Engineering Procurement And Construction Kpi Dashboard Showing Project Summary Cost And Budget. This is a four stage process. The stages in this process are Engineering, Procurement And Construction, Construction Management, Engineering, Purchasing And Construction .
-
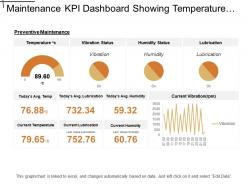 Maintenance kpi dashboard showing temperature and vibration status
Presenting this set of slides with name - Maintenance Kpi Dashboard Showing Temperature And Vibration Status. This is a five stage process. The stages in this process are Maintenance, Preservation, Conservation.
-
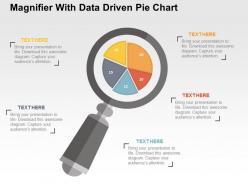 Magnifier with data driven pie chart powerpoint slides
Remarkable Presentation design for business professionals. Incredible picture quality as pixels don’t break when shared in widescreen view. Blend well with online software tools i.e. JPG and PDF. Hundred percent compatible with Google slides. PowerPoint visual can be modified easily as access to change color, text accessible. Pre-designed PPT illustration saves you valuable time.
-
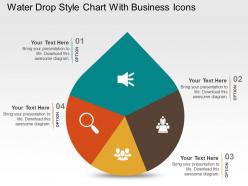 Water drop style chart with business icons powerpoint slides
We are proud to present our water drop style chart with business icons powerpoint slides. This power point template diagram has been crafted with graphic of water drop style chart and business icons. This PPT diagram contains the concept of analysis. Use this PPT diagram for business and sales related presentations.
-
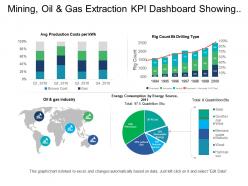 Mining oil and gas extraction kpi dashboard showing average production costs and energy consumption
Presenting this set of slides with name - Mining Oil And Gas Extraction Kpi Dashboard Showing Average Production Costs And Energy Consumption. This is a four stage process. The stages in this process are Mining, Oil And Gas Extraction, Refinery, Natural Gas.
-
 0514 business concept professional data driven diagram powerpoint slides
High resolution visuals. Impressive picture quality. No fear of image pixilation when projected on wide screen. Compatibility with multiple numbers of software options. Compatible with numerous formats like JPEG, JPG and PNG. Ease of download. Thoroughly editable slide deign visual. Ease of inclusion and exclusion of content. Personalize the slide design with company specific name, logo and trademark.
-
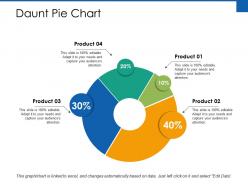 Daunt pie chart ppt powerpoint presentation summary
Presenting this set of slides with name - Daunt Pie Chart Ppt Powerpoint Presentation Summary. This is a four stages process. The stages in this process are Finance, Marketing, Management, Investment, Analysis.
-
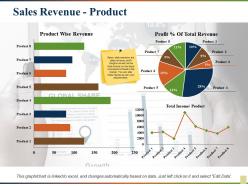 Sales revenue product revenue new customers gross profit
Presenting this set of slides with name - Sales Revenue Product Revenue New Customers Gross Profit. This is a eight stage process. The stages in this process are Product Wise Revenue, Profit Percentage Of Total Revenue, Total Income, Product.
-
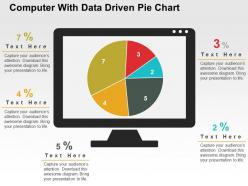 Computer with data driven pie chart powerpoint slides
Easy and swift to download. Fully modifiable color scheme, contrast, size and orientation of PPT infographics. Insert text without any length constraints. No change in the high resolution of PPT images after editing. Easily convertible to JPG or PDF formats and runs smoothly with any software. Perfectly suited for software designers, app developers, product engineers etc.
-
 Key statistics powerpoint slide templates
Presenting this set of slides with name - Key Statistics Powerpoint Slide Templates. This is a four stage process. The stages in this process are Pie Chart, Marketing, Analysis, Strategy, Business.
-
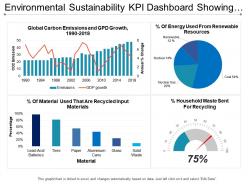 Environmental sustainability kpi dashboard showing global carbon emission and gdp growth
Presenting this set of slides with name - Environmental Sustainability Kpi Dashboard Showing Global Carbon Emission And Gdp Growth. This is a four stage process. The stages in this process are Environment Sustainability, Environment Continual, Environment Feasibility.
-
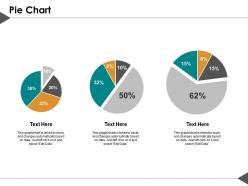 Pie chart ppt summary graphics tutorials
Presenting this set of slides with name - Pie Chart Ppt Summary Graphics Tutorials. This is a three stage process. The stages in this process are Percentage, Product, Business, Management, Marketing.
-
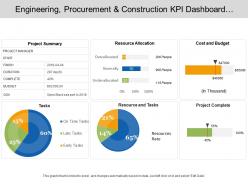 Engineering procurement and construction kpi dashboard showcasing project summary cost and budget
Presenting this set of slides with name - Engineering Procurement And Construction Kpi Dashboard Showcasing Project Summary Cost And Budget. This is a five stage process. The stages in this process are Engineering, Procurement And Construction, Construction Management, Engineering, Purchasing And Construction .
-
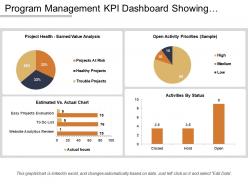 Program management kpi dashboard showing estimated vs actual chart
Presenting this set of slides with name - Program Management Kpi Dashboard Showing Estimated Vs Actual Chart. This is a four stage process. The stages in this process are Program Development, Human Resource Management, Program Management.
-
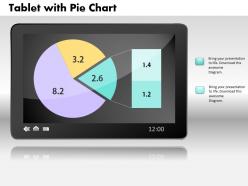 0414 business pie chart tablet layout powerpoint graph
Useful for data analysis firms and professionals working in social media organisations. High definition graphics produce the same quality on bigger or wider screens. Easily convertible into common format like JEPG and PDF. Amendable layout in terms of color, design, orientation and text given pin-point control to user. No space constraints for mentioning sub-titles and titles. Compatible with Google slides and runs with every softwares.
-
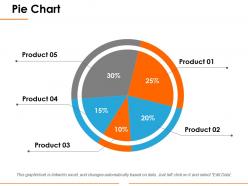 Pie chart ppt introduction
Presenting the flat pie chart PPT template. This presentation template is designed under the supervision of professionals and is 100% modifiable in PowerPoint. The user can bring changes to the objects like font color and font size in this slide and save it in JPG or PDF file format hassle-free. This slide is 100% compatible with Google Slide. Click on the download tab below to download this template in no time.
-
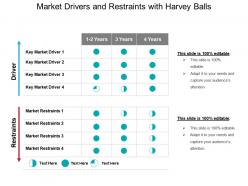 Market drivers and restraints with harvey balls powerpoint slide designs
Presenting market drivers and restraints with harvey balls PPT Slide which is 100% editable. This slideshow is data driven chart and the shapes of the graphics adjust automatically according to your data. Easy to customize and personalize this PowerPoint template and its high resolution visuals are easy to modify as per your need. This PowerPoint theme is compatible with Google Slides , multiple software and format options. This PPT is used by business analysts and professionals belongs to sales and marketing.
-
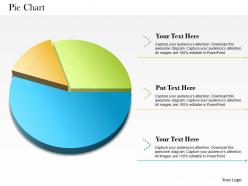 0514 3 staged colored pie chart powerpoint slides
They are magnificently created PPT images constructed by team of experts which are quite convenient for management professional, business researchers and analysts etc. The scheme, intensity, context, symbols etc. can be easily rearrange able according to the need of your matter. These Presentation graphics can also be transformable into various schemes like PDF or JPG. They have an easy and simple downloading procedure.
-
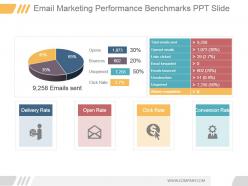 Email marketing performance benchmarks ppt slide
Presenting email marketing performance benchmarks ppt slide. This is a email marketing performance benchmarks ppt slide. This is a two stage process. The stages in this process are opens, bounces, unopened, click rate, emails sent, total emails sent, opened emails, links clicked, email forwarded, emails bounced, unsubscribes, unopened, abuse complaints, delivery rate, open rate, click rate, conversion rate.
-
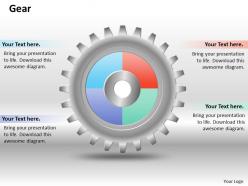 0414 gears mechanism pie chart powerpoint graph
We are proud to present our 0414 gears mechanism pie chart powerpoint graph. Hit the right notes with our Gears Mechanism Pie Chart Powerpoint Graph Powerpoint Templates. Watch your audience start singing to your tune. Walk your team through your plans using our Gears Mechanism Pie Chart Powerpoint Graph Powerpoint Templates. See their energy levels rise as you show them the way.
-
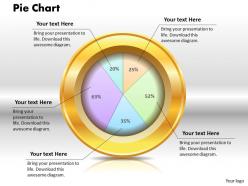 0414 percetage profit ratio pie chart powerpoint graph
High resolution slide design background. Thoroughly editable slide content. Ease of inclusion and exclusion of content at sole discretion. Ease of download. Freedom to personalize the content with company specific name, logo and trademark. Compatible with numerous format options. Compatible with multiple software options available both online and offline. Compatible with Google slides. Used by financiers, business professionals, students and teachers.
-
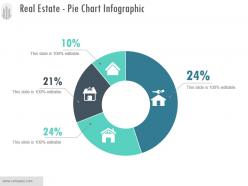 Real estate pie chart infographic sample of ppt presentation
Presenting real estate pie chart infographic sample of ppt presentation. This is a real estate pie chart infographic sample of ppt presentation. This is a four stage process. The stages in this process are icons, strategy, percentage, finance, business.
-
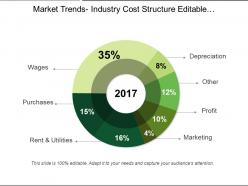 Market trends industry cost structure editable doughnut chart ppt icon
Presenting market trends industry cost structure editable doughnut chart ppt icon. This is a market trends industry cost structure editable doughnut chart ppt icon. This is a seven stage process. The stages in this process are wages, purchases, rent and utilities, marketing, profit, other, depreciation.
-
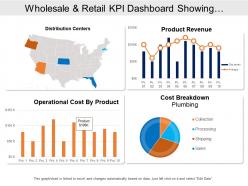 Wholesale and retail kpi dashboard showing distribution centers product revenue
Presenting this set of slides with name - Wholesale And Retail Kpi Dashboard Showing Distribution Centers Product Revenue. This is a four stage process. The stages in this process are Wholesale And Retail, Extensive And Retail, Wholesale And Distribute.
-
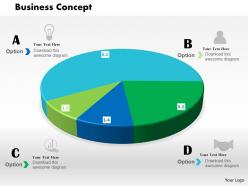 0514 3d colored data driven pie chart for business powerpoint slides
We are proud to present our 0514 3d colored data driven pie chart for business powerpoint slides. A 3d colored data driven chart is used in this Business power Point template. Use this template for sequential data flow in any presentation. Go ahead use this template in your business presentation.
-
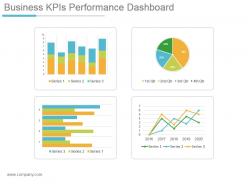 Business kpis performance dashboard snapshot powerpoint slide clipart
Presenting business kpis performance dashboard snapshot powerpoint slide clipart. This is a business kpis performance dashboard powerpoint slide clipart. This is a four stage process. The stages in this process are series, qtr.
-
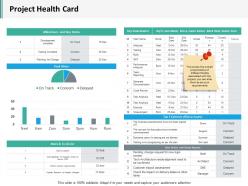 Project health card slide2 ppt infographics structure
Presenting this set of slides with name - Project Health Card Slide2 Ppt Infographics Structure. This is a two stage process. The stages in this process are Business, Management, Strategy, Analysis, Marketing.
-
 Alarm clock with data driven pie chart powerpoint slides
We are proud to present our alarm clock with data driven pie chart powerpoint slides. This power point template diagram has been designed with graphic of alarm clock and pie chart. This pie chart is data driven. Use this PPT diagram can be used for marketing and business related presentations.
-
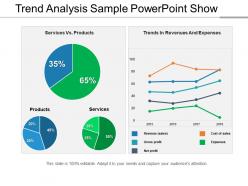 Trend analysis sample powerpoint show
Presenting a PowerPoint slide named Trend Analysis Sample PowerPoint Show. Create a compelling presentation with this PPT diagram, which is both professional and editable. Customize colors, choose font styles, and size. You can choose from a wide variety of icons. Resize and scale the images to fit any content. The PPT slide is compatible with Google Slides and can be fetched at once. You can save it as both PDF and JPG format. This PPT slide is data-driven and linked to the Excel sheet.
-
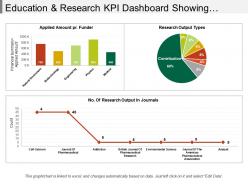 Education and research kpi dashboard Snapshot showing research outputs and amount
Presenting education and research KPI dashboard snapshot showing research outputs and amount PPT slide. The research data metric presentation slide designed by professional team of SlideTeam. The education and research report PPT slide is 100% customizable in PowerPoint. The research amount KPI dashboard slide is also compatible with Google Slide so a user can share this slide with others. A user can make changes in the font size, font type, color as well as dimensions of the research key measure PPT template as per the requirement. You may edit the value in the research key measure PPT template as the slide gets linked with the Excel sheet.
-
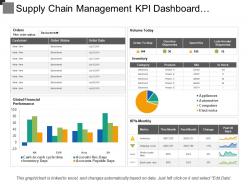 Supply chain management kpi dashboard showing order status volume and inventory
Presenting this set of slides with name - Supply Chain Management Kpi Dashboard Showing Order Status Volume And Inventory. This is a two stage process. The stages in this process are Demand Forecasting, Predicting Future Demand, Supply Chain Management.
-
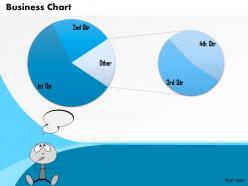 0514 two result business pie chart data driven powerpoint slides
Works vigorously without issues on all compatible software. Easy to convert to JPG and PDF formats. Pixelation does not happen when slide is projected on widescreen. Compatible with google slides for more shared information access. High resolution PPT graphics for crispness. Amendable layout including font, text, color, design. Add company logo, trademark without worries. Zero space constraints when adding titles and sub titles to the design. Employable in businesses, small and major, startups, educational institutes, project management firms and more.


