

New PowerPoint Templates, Presentation Slides and PPT Backgrounds
Filter By Category

-
 Key Elements of Industry 4 0 PPT Presentation VA
Every production line tells a story and in the age of smart factories that story is written in data. Your next corporate presentation needs to translate complex operational shifts into a narrative your stakeholders can grasp in seconds. This deck breaks down the pillars of digital transformation from interconnected machinery to real time analytics turning abstract concepts into clear visual storytelling. You will find modern slide design that explains interoperability and decentralized decisions without the jargon headache. These business slides are fully editable allowing you to customize the strategy deck for your specific operations team. Save hours of design work and walk into your next boardroom ready to define the future of automated manufacturing.
-
 Industry 5 0 maturity model PPT Structure VA
Before your board weighs where human centered automation fits next ask whether your operational spine can actually support it. That is the real question this structure answers. Built around a staged maturity journey these PPT slides walk your team from basic digitization through to fully adaptive human machine collaboration. Each editable slide layers clear assessment criteria against actionable next steps so your strategy stays grounded in measurable progress. With modern slide design and clean data visualization you can present your roadmap with confidence. This professional PPT gives stakeholders a shared language for Industry 5.0 turning abstract ambition into a concrete staged plan.
-
 Industry 4 0 smart factory automation dashboard PPT PowerPoint VA
Your production floor is generating more data than any spreadsheet can tame and that gap between raw output and real insight is costing you decisions. This Industry 4.0 smart factory automation dashboard presentation deck bridges that divide with visual storytelling built for plant managers and C suite stakeholders alike. Every editable slide transforms complex machine telemetry into clear data visualization so you can walk leadership through throughput trends predictive maintenance windows and OEE metrics without drowning in jargon. The modern slide design works beautifully across PowerPoint templates and Google Slides giving you a consulting presentation that feels native to your operations team. Stop narrating chaos and start showing clarity with presentation graphics engineered for the factory floor.
-
 Industry 4 0 smart factory architecture PPT Outline VA
Your next board meeting could hinge on how crisply you explain your manufacturing roadmap and that clarity starts with a strong narrative structure. This outline transforms sprawling technical detail into a focused storyline covering connectivity edge processing and digital twins helping you align engineering teams and CFOs around the same vision. Each segment walks you through cyber physical systems and real time analytics so you can move from abstract strategy to an actionable rollout plan. Built as a flexible presentation deck for cross departmental workshops these business slides let you adapt the flow without losing momentum turning a complex transition into a confident conversation.
-
 Industry 4 0 sap PPT Summary VA
Every operational leader knows the sting of stalled digital initiatives where promising technology fails to bridge the gap between the factory floor and the executive suite. Your next strategy discussion can break that cycle with a presentation that translates complex enterprise architecture into undeniable business value. This focused deck distills the core of Industry 4.0 and SAP integration turning dense technical requirements into a clear roadmap for smart manufacturing. With prebuilt data visualization and workflow presentation elements you can show stakeholders exactly how connected systems drive real efficiency gains. It is a practical strategy deck for aligning technical teams and C level sponsors on a unified vision.
-
 Industry 4 0 robotics PPT Slides VA
Gone are the days when factory floors were rigid one size fits all operations. Your production line is asking for flexibility and your current static documentation simply cannot keep pace with the demands of modern automation. This Industry 4.0 robotics PowerPoint templates collection is your gateway to presenting intelligent manufacturing with absolute clarity. Use these business slides to map out interconnected systems showcase robotic workflows and translate complex data into persuasive visual storytelling for stakeholders. Every editable slide and presentation graphic helps you build a compelling strategy deck that positions your company as a forward thinking leader. Deliver the future of your operations today with this modern slide design.
-
 Industry 4 0 readiness assessment model PPT Demonstration VA
Putting a number on your factorys digital maturity can feel overwhelming when every vendor promises a different roadmap. This presentation deck translates the complex industry 4.0 readiness assessment model into a clear actionable scoring system that your leadership team will actually understand. Use these editable slides to demonstrate where your operations stand today versus where they need to be tomorrow. The modern slide design uses visual storytelling to walk stakeholders through each maturity level from data collection to predictive analytics. Whether you are presenting to plant managers or the C suite these presentation graphics help you build consensus and secure budget for your digital transformation strategy.
-
 Industry 4 0 predictive maintenance dashboard PPT Presentation VA
Downtime is a silent profit killer and your operations team deserves more than reactive firefighting. This predictive maintenance dashboard presentation turns raw sensor data into a clear proactive action plan for your factory floors. With the industry 4.0 predictive maintenance dashboard PPT presentation you can visually spot equipment anomalies before they become costly failures. The modern slide design uses intuitive workflow presentation visuals to communicate complex health metrics simply. Each editable slide is perfect for a corporate presentation helping you secure buy in for smarter asset management. Stop guessing and start predicting. This PowerPoint template gives you the executive slides needed to showcase efficiency gains and drive your digital transformation forward.
-
 Industry 4 0 maturity model PPT Summary VA
Stuck wondering which of your production sites actually delivers value in the age of smart factories Guessing wastes budget and stalls progress so your next step deserves sharper thinking than a generic status report. This Industry 4.0 maturity model PPT summary acts as your practical diagnostic lens converting abstract digital transformation ideas into a staged roadmap you can defend at the next executive review. Pinpoint specific capability gaps benchmark departments against each other and sequence your technology investments with clarity that impresses stakeholders. Each data visualization and professional PPT slide helps you translate complex assessments into actionable next steps. Stop relying on intuition build a strategy deck that proves exactly where your operation stands today and what it takes to reach true industrial intelligence.
-
 Industry 4 0 maturity levels PPT Example VA
Figuring out where your factory truly stands on the road to smart manufacturing can feel like guessing in the dark. This industry 4.0 maturity levels PPT example cuts through the fog with a clear visual roadmap for your transformation journey. You will find a structured progression that helps you audit current operations identify weak spots and plot a realistic path forward. The business slides use a modern slide design that turns complex data into an easy to follow visual storytelling sequence. Perfect for strategy reviews these editable slides work in Google Slides and PowerPoint templates giving your team a practical data visualization tool to align on next steps.
-
 Industry 4 0 maturity assessment PPT Sample VA
Just how ready is your operation for the next wave of industrial change Pinpointing your exact position on the digital adoption curve is the first move toward meaningful upgrades. This presentation deck translates complex evaluations into a clear visual roadmap that leadership can grasp in minutes. The industry 4.0 maturity assessment PPT sample helps you benchmark current capabilities against future opportunities turning abstract concepts into concrete action items. Filled with data visualization and modern slide design these business slides let you showcase gaps and wins with authority. Perfect for strategy reviews this editable slides collection strengthens your consulting presentation and drives confident decision making.
-
 Industry 4 0 framework PPT Sample VA
Old assembly lines rarely whisper their secrets. But yours can when every stage of production becomes legible at a glance. This sample deck translates complex operational shifts into a visual story your board will actually follow mapping automation connectivity and real time data streams onto clear sequential business slides. Built as editable slides for quick customization the presentation graphics turn abstract digital transformation goals into concrete action steps for engineering and executive teams alike. Use these presentation graphics to align departments around shared milestones making your next strategy meeting feel less like a lecture and more like a launch sequence for your smart factory initiatives.
-
 Industry 4 0 factory automation dashboard PPT Structure VA
Stuck translating raw machine data into decisions that actually move the needle This presentation structure cuts through the noise giving you a clear narrative arc for your smart factory initiatives. It walks you through mapping real time KPIs showcasing workflow bottlenecks and illustrating the jump from connected sensors to bottom line savings. Perfect for internal stakeholder buy in or external client workshops these PPT slides use clean data visualization to make complex automation concepts instantly understandable. The modern slide design and editable slides let you tailor the story to your specific production lines. Present your operational transformation with confidence using this strategy deck built for the era of intelligent manufacturing.
-
 Industry 4 0 digital twin dashboard PPT PowerPoint VA
Factory floors are noisy places to make big decisions. Your next review can cut through that chaos with a living model of your entire operation. This Industry 4.0 digital twin dashboard visualizes every machine line and sensor in real time turning raw production data into a clear story for stakeholders. You get presentation graphics that translate complex IoT streams into actionable intelligence not just static charts. Use the workflow presentation to show how your virtual replica drives predictive maintenance and reduces downtime. Built for modern slide design the deck works smoothly in PowerPoint and Google Slides letting you present the future of manufacturing with total confidence.
-
 Industry 4 0 digital manufacturing dashboard PPT Guidelines VA
Guarding the factory floor from information chaos starts with a single focused view and that is exactly what this presentation bundle delivers. Built around the industry 4.0 digital manufacturing dashboard PPT guidelines it turns raw production data into visual storytelling that executives actually understand. You get a complete strategy deck packed with editable slides smart data visualization and modern slide design that clarifies your smart factory journey. Present your operational metrics with confidence using a clean corporate presentation that works flawlessly in Google Slides and PowerPoint. Stop wrestling with messy spreadsheets and start steering your digital transformation narrative with a clear professional PPT that gets your point across.
-
 Key Performance Indicators Web Analytics PPT Demonstration VA
Knowing which metrics actually drive revenue is the difference between guessing and growing. This Key Performance Indicators Web Analytics PPT demonstration turns raw visitor data into a clear narrative that your leadership team will instantly understand. You will move beyond vanity numbers and focus on conversion rates acquisition channels and user behavior that impact the bottom line. The data visualization makes complex trends approachable while the modern slide design keeps your strategy deck crisp and professional. Built as editable slides for PowerPoint Google Slides and Keynote this consulting presentation gives you the visual storytelling power to build consensus and act with confidence.
-
 Key Performance Indicators vs Key Risk Indicators PPT Demonstration VA
Getting your metrics story straight can mean the difference between optimistic growth projections and being blindsided by operational danger. You likely track KPIs to measure success but without a clear view of KRIs hidden threats can quietly derail your strategy. This presentation deck clarifies the crucial distinction between performance outcomes and risk exposure giving your team a shared language for balanced decision making. The modern slide design walks through practical examples mapping where these indicators intersect and how to respond when they conflict. Use the editable slides to build a corporate presentation that aligns executives on both opportunity and caution. Your next strategy review deserves that clarity.
-
 Key Performance Indicators Oil and Gas Industry PPT Template VA
Every barrel counts and so does every data point driving your next strategic move. When margins tighten and operational efficiency becomes the difference between profit and loss your leadership team needs clarity at a glance. This presentation deck translates complex upstream midstream and downstream metrics into visual storytelling your board will actually absorb. You get editable slides built for modern slide design letting you spotlight lagging and leading indicators safety benchmarks and production targets without drowning in spreadsheets. Whether you are preparing an investor briefing or an internal review these business slides help you frame Key Performance Indicators for the Oil and Gas Industry with authority. Professional PPT that turns raw numbers into decisive narratives.
-
 Key Performance Indicators in Teaching and Learning PPT PowerPoint VA
Think your teaching strategy is hitting the mark but the board meeting is asking for cold hard numbers Turn scattered attendance logs and confusing survey data into a compelling story of student success. This Key Performance Indicators in Teaching and Learning PPT PowerPoint presentation gives you a clear executive style slide deck to showcase what is actually working in your classrooms. You get editable slides for visualizing retention rates and module completion making your next corporate presentation or strategy deck feel sharp and professional. Move beyond simple reporting and use data visualization to prove your institutions impact and secure buy in for your next big initiative.
-
 Key Performance Indicators in School PPT Summary VA
Numbers only tell part of the story yet in education the right metrics can transform a struggling institution into a thriving one. This presentation deck translates complex academic data into clear actionable intelligence for administrators and board members. You will learn which measurements truly matter for student success teacher retention and operational efficiency then discover how to present those findings with confidence. The modern slide design simplifies dense reporting into digestible visual storytelling making your next staff meeting or district review far more persuasive. With fully editable slides for Google Slides and PowerPoint you can customize every chart to reflect your unique school community and drive informed decisions.
-
 Key Performance Indicators in Healthcare PPT Outline VA
Numbers tell the real story behind patient outcomes and operational efficiency but presenting those metrics in a way leadership actually absorbs is an entirely different challenge. This deck turns dense healthcare data into clear decision ready visuals so your next board meeting drives action rather than confusion. Built around Key Performance Indicators in Healthcare ppt outline va these editable slides help you walk through readmission rates patient satisfaction scores and staffing productivity with confidence. Modern slide design keeps every chart scannable while flexible layouts let you tailor each section to your facility. Stop wrestling with cluttered spreadsheets and start delivering a strategy deck that makes your numbers impossible to ignore. Perfect for administrators quality officers and clinical directors who need executive slides that persuade.
-
 Key Performance Indicators in BPO PPT Demonstration VA
Outsourcing success lives and dies by the numbers yet translating raw call center metrics into boardroom clarity often gets lost in translation. Your leadership team needs to see exactly where operational efficiency meets client satisfaction without drowning in spreadsheets. That is precisely why this Key Performance Indicators in BPO presentation deck exists. It transforms dense data into persuasive visual storytelling breaking down average handling time first call resolution and service level agreements into digestible infographic templates. Whether you are presenting to executives or coaching frontline teams these business slides offer the modern slide design needed to make your performance reviews actionable. Stop explaining your data and start showing it with professional PPT slides built for the fast paced BPO environment.
-
 Key Performance Indicators Healthcare Dashboard PPT Guidelines VA
Numbers tell the real story of patient outcomes yet translating raw healthcare metrics into boardroom clarity often feels like decoding a foreign language. This complete presentation deck bridges that gap giving your leadership team a direct line from operational data to strategic action. Built around the core principles of Key Performance Indicators Healthcare Dashboard guidelines each business slide transforms complex utilization rates readmission figures and patient satisfaction scores into clean data visualization your audience can grasp in seconds. With editable slides and modern slide design you can tailor every executive level chart to your facilitys specific targets. Stop burying insights in spreadsheets. Present the narrative your stakeholders need to make confident informed decisions.
-
 Key Performance Indicators for Shipping Industry PPT Information VA
Numbers tell the story your shipping operations hide in plain sight. Every voyage carries data that can sharpen margins tighten schedules and expose inefficiencies before they become costly disruptions. This presentation deck translates raw operational metrics into a visual narrative your leadership team will actually absorb turning complex fleet data into clear strategic direction. Built around Key Performance Indicators for the Shipping Industry the PowerPoint templates blend bold infographic templates with clean data visualization helping you contrast fuel consumption turnaround times and cargo utilization at a glance. Editable slides within this modern slide design let you adapt each graph to your specific routes making your next corporate presentation both persuasive and grounded in real performance.
-
 Key Performance Indicators for Research and Development PPT Outline VA
Before a single prototype reaches your bench stakeholders want to know which projects deserve funding and which are draining resources. This presentation deck turns scattered metrics into a clear decision making story helping you translate complex scientific progress into business value that executives immediately understand. You will cover leading versus lagging KPI indicators portfolio balance and timeline efficiency across your entire R and D pipeline. Each slide offers modern slide design with editable slides so you can adapt the data visualization to your actual discoveries. This professional PPT gives your next strategy review the clarity it needs to secure continued investment and drive breakthrough innovation.
-
 Key Performance Indicators for Purchasing Department PPT Template VA
Numbers alone rarely tell the full story of procurement success yet most teams still drown in cluttered spreadsheets. This PowerPoint template gives your purchasing department a clear visual language to demonstrate true value to executives. You will find dedicated slides that transform raw spend data into compelling performance narratives making it easy to spotlight supplier reliability cost savings and cycle times. The modern slide design includes professional PPT graphics and data visualization tools that simplify complex reporting. Whether preparing a corporate presentation for stakeholders or a strategy deck for internal reviews these editable slides in Google Slides format ensure your buying teams achievements finally resonate across the entire organization.
-
 Key Performance Indicators for Nurses PPT Graphics VA
Your next staff meeting deserves visuals that finally do justice to the hard numbers behind patient care. Converting raw metrics into actionable insight is where many nursing leadership plans stall and that is exactly where these presentation graphics step in. Built specifically for the Key Performance Indicators for Nurses topic this deck helps you translate complex data on patient satisfaction response times and care quality into clear compelling stories for administrators and frontline teams alike. With modern slide design and editable charts you can update figures instantly ensuring your corporate presentation always reflects the latest outcomes without starting from scratch.
-
 Key Performance Indicators for Media Industry PPT Slides VA
Numbers tell the real story behind every hit show viral campaign and content partnership. Your next strategy review deserves better than scattered spreadsheets and static charts. This Key Performance Indicators for Media Industry PPT slides visual collection transforms raw audience data into persuasive board ready narratives that executives actually remember. Each slide is crafted for clarity pairing actionable metrics with modern slide design that guides attention straight to what matters most. Whether you are reporting quarterly growth or pitching new revenue streams these editable slides let you customize every visual element without wrestling with complex formatting. Stop explaining your results in words and start showing them with confidence. Your stakeholders will finally see the full picture.
-
 Key Performance Indicators for Information Technology Department PPT Information VA
Numbers only tell a story when theyre tied to real outcomes and thats exactly where most IT leaders struggle. You need to show stakeholders how infrastructure uptime ticket resolution speed and project delivery directly impact business growth not just report raw data. This Key Performance Indicators for Information Technology Department PPT information pack turns scattered metrics into a clear narrative for your next strategy review. The modern slide design includes editable dashboards and data visualization tools that make complex service levels instantly understandable. With these presentation graphics you can confidently present your teams wins and pinpoint areas for investment using clean executive slides built for leadership conversations.
-
 Key Performance Indicators for Hotel Industry PPT Information VA
Guests quietly checking out early housekeeping carts stalled in corridors and revenue figures that refuse to climb these are the silent signals that something is off in your property. You can feel the pulse of your operation but without hard data you are only guessing. This presentation deck turns scattered daily reports into a clear operational story so you can finally spot the patterns that matter. Whether you are courting investors aligning your department heads or revamping your quarterly strategy these editable slides for Google Slides and PowerPoint help you translate occupancy RevPAR and guest satisfaction scores into a narrative that builds confidence. Stop reacting to problems and start steering your hotel toward predictable growth with a data driven approach.
-
 Key Performance Indicators for Hospitals PPT Information VA
Every hospital board room feels the tension between daily clinical demands and the long term financial health of the institution. Your next strategy meeting needs to bridge that gap with clarity and conviction. This presentation deck translates complex operational metrics into a visual story that your executive team will actually discuss not just skim. From patient flow and readmission rates to staffing efficiency and revenue cycle trends the slides turn raw data into actionable insights. Built for busy administrators these editable slides work in PowerPoint and Google Slides letting you focus on the narrative while the modern slide design handles the heavy lifting. Present with confidence and drive real decisions.
-
 Key Performance Indicators for Education PPT Mockup VA
Numbers alone rarely tell the full story of a schools success yet your next board meeting hinges on proving real progress. You need a presentation that turns attendance rates graduation metrics and learning outcomes into a narrative stakeholders can feel. This Key Performance Indicators for Education PPT mockup does exactly that blending creative layouts with clean data visualization to make every figure persuasive. Adapt the editable slides to your districts goals and communicate your achievements with absolute clarity. Stop drowning in spreadsheets and start showcasing your institutions milestones. This visual storytelling approach ensures your next strategy deck earns the applause it deserves.
-
 Key Performance Indicators for Distributors PPT Outline VA
Numbers alone rarely tell the whole story of a distribution network yet they are the first thing your stakeholders will ask about. You need a way to translate complex supply chain metrics into a narrative that drives decisions not just discussion. This business slides solution helps you turn raw inventory turnover fill rate and margin data into clear visual storytelling. With editable slides for your corporate presentation you can quickly adapt the consulting ready structure for your own figures. Whether you are briefing executives or coaching your sales team this presentation deck gives you a professional PPT foundation for monitoring Key Performance Indicators for Distributors with confidence.
-
 Key Performance Indicators for Design and Engineering PPT Template VA
Numbers only tell half the story when your team is juggling design sprints prototype revisions and engineering deadlines. This presentation deck turns scattered metrics into a clear narrative that leadership actually wants to sit through. You get editable slides built around KPIs that matter to both creative and technical stakeholders from cycle time to defect density. Whether you are presenting to executives or aligning your own cross functional teams the visuals handle data visualization and workflow presentation without the usual spreadsheet fatigue. The modern slide design works across PowerPoint templates and Google Slides so your talking points stay sharp and your numbers finally get the attention they deserve.
-
 Key Performance Indicators for Construction Companies PPT Mockup VA
Guarding a construction firms bottom line starts with knowing exactly which numbers matter on every site. Your next boardroom update deserves a presentation that turns raw project data into a clear question and answer session. This PPT slides bundle focuses on the essential Key Performance Indicators for Construction Companies from safety incident rates to budget variance and schedule adherence. You get fully editable slides with modern slide design visual storytelling and data visualization graphics that make progress tangible. The strategy deck works beautifully in Google Slides or PowerPoint helping you communicate priorities to stakeholders without drowning them in spreadsheets.
-
 Key Performance Indicators for Communications PPT Information VA
Numbers tell the story long before a single word is spoken and the right visuals make those figures impossible to ignore. Your next corporate presentation can turn raw data into decisive action with thoughtfully structured business slides focused on Key Performance Indicators for Communications. Move beyond static spreadsheets by using infographic templates and data visualization to spotlight audience growth engagement rates and channel efficiency. This editable PPT deck is built for modern slide design letting you tailor every chart and metric to your stakeholders in minutes. Stop wrestling with cluttered reports and start delivering crisp executive level clarity that drives real conversations forward.
-
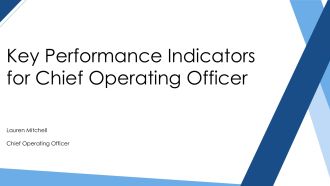 Key Performance Indicators for Chief Operating Officer PPT Mockup VA
Every quarter the pressure to prove operational health lands squarely on your shoulders. You need to translate complex operational data into a clear narrative that resonates with the board and your executive team without drowning them in spreadsheets. This presentation deck transforms raw numbers into compelling visual storytelling built specifically around Key Performance Indicators for Chief Operating Officer priorities. It offers a modern slide design with editable slides that let you highlight efficiency wins cost management and growth trajectories. These professional PPT slides are ready for Google Slides or PowerPoint giving you a polished consulting presentation that makes your operational strategy unmistakably clear and data driven.
-
 Key Performance Indicators for CFO PPT Template VA
Numbers alone rarely tell the whole story. When you step into the boardroom your ability to translate complex financial data into a clear actionable narrative is what sets you apart. That is precisely where a focused presentation deck makes its mark. This professional PPT is built to help finance leaders present strategic insights with authority guiding your audience through liquidity profitability and operational efficiency without getting lost in the weeds. Modern slide design meets practical data visualization allowing you to highlight trends and forecasts instantly. Customizable business slides let you tailor each chart to your specific reporting period ensuring your next finance review lands with clarity and impact.
-
 Key Performance Indicators for Banks PPT Graphics VA
Numbers tell the real story of a financial institution but raw data rarely persuades a boardroom. That is why this banking focused KPI deck transforms dense quarterly figures into clear visual narratives that actually drive decisions. Instead of drowning stakeholders in spreadsheets you get presentation graphics built specifically for return on assets capital adequacy liquidity ratios and net interest margin. Each editable slide turns complex regulatory metrics into digestible charts and executive slides making your strategy deck as sharp as your balance sheet. Whether presenting to investors or internal committees these PowerPoint templates give your analysis the clarity and authority it needs to land with confidence.
-
 Key Performance Indicators for Banking Industry PPT Demonstration VA
Numbers tell the story long before a single word is spoken and in banking the right metrics separate thriving institutions from struggling ones. This presentation deck turns raw financial data into a compelling narrative your board and stakeholders will actually remember. You will walk through profitability ratios asset quality liquidity positions and operational efficiency using clean data visualization that clarifies complex relationships at a glance. The business slides are fully editable allowing you to drop in your own figures and adjust the modern slide design to match your brand guidelines. Stop wrestling with cluttered spreadsheets and start presenting insights that drive confident decisions with these professional PPT slides built for financial storytelling.
-
 Key Performance Indicators for Artificial Intelligence PPT Guidelines VA
Numbers only tell half the story and for AI initiatives the other half is strategy. You need a clear way to measure model impact adoption and business value without drowning in technical noise. That is exactly where these PowerPoint templates for Key Performance Indicators for Artificial Intelligence step in. This presentation deck transforms complex metrics into digestible visual storytelling using crisp data visualization and modern slide design to make your KPIs actionable for stakeholders. Whether you are reporting to executives or aligning your data team these editable slides in Google Slides format help you frame progress flag risks and drive smarter decisions with clarity and confidence.
-
 Key Performance Indicators for Administrative Assistant PPT Structure VA
Winning the trust of an executive team often starts with a clear demonstration of your operational impact and this structure is designed to make that case for you. It moves your reporting beyond simple task lists into a compelling narrative of efficiency gains and time saved focusing on the metrics that actually influence decision makers. You will find dedicated sections for tracking response times scheduling accuracy and cost containment all presented through clean data visualization that does not require design skills to look polished. These PowerPoint templates offer fully editable slides that let you drop in your numbers and instantly build a credible professional PPT that speaks the language of growth and reliability.
-
 Key Performance Indicators for Accounts Receivable PPT Guidelines VA
Numbers tell a story and the right narrative can transform your finance departments impact. When you need to communicate cash flow health to stakeholders a clear visual structure makes complex aging reports digestible in seconds. This presentation deck focuses on Key Performance Indicators for Accounts Receivable translating raw data into actionable insights your team can actually use. From days sales outstanding to collection effectiveness every slide simplifies the metrics that matter most for working capital. Built as flexible business slides you can quickly adapt the modern slide design for monthly reviews or board updates. Save hours of manual formatting with editable slides that let your numbers shine turning routine reporting into a strategic advantage.
-
 Key Partners in Business Model Canvas PPT Designs VA
Every successful venture hinges on the strength of its alliances yet articulating that network can often feel scattered. Your ideas deserve a clear visual stage that turns abstract relationships into a compelling narrative. These Key Partners in Business Model Canvas PPT designs offer a structured way to showcase your strategic ecosystem using modern slide design to highlight each collaborators role. By transforming complex information into digestible visual storytelling you can present your alliances with clarity and confidence. This business slides collection provides the creative layouts needed to build a persuasive consulting presentation that resonates with investors and stakeholders alike.
-
 Key Operational Processes PPT Mockup VA
Every department runs on repeatable workflows yet bottlenecks often hide in plain sight. You need to make those invisible patterns visible to stakeholders and that is exactly where this deck steps in. Built around the Key Operational Processes topic these PPT slides give you flowchart friendly layouts timeline graphics and step by step breakdowns that turn tangled procedures into crystal clear visuals. Use the editable slides to map responsibilities flag inefficiencies or walk a new hire through the daily rhythm. The presentation graphics work in Google Slides and PowerPoint so your team can collaborate without friction. Stop explaining and start showing the exact path your operations take every single day.
-
 Key Milestones in AI Development PPT Guidelines VA
From the first neural network to the era of generative intelligence the journey of artificial intelligence is packed with breakthroughs that continue to reshape entire industries. You need a way to present this complex evolution with clarity and impact and this presentation deck delivers exactly that. Built around the key milestones in AI development these PPT slides transform dense technical history into a visual storytelling experience that keeps any audience engaged. Each editable slide features modern slide design and dynamic data visualization making it simple to highlight pivotal moments. Whether you are crafting a strategy deck for leadership or a consulting presentation for clients these professional PPT formats help you command the room.
-
 Key Metrics in Social Media Analytics PPT Example VA
Numbers alone wont tell you if your content is truly resonating. You need to know which posts spark genuine conversation versus which ones just scroll past silently. That is exactly where this presentation deck steps in turning raw data into clear strategic direction. Built around the essential Key Metrics in Social Media Analytics these PPT slides help you cut through the noise and focus on what actually drives engagement and growth. Each editable slide uses crisp data visualization and creative layouts making it simple to build a compelling report for stakeholders or your own team. Stop guessing and start measuring what matters with a corporate presentation that delivers real clarity.
-
 Key Metrics in Lean Canvas PPT Outline VA
Numbers only tell half the story until you know which ones actually drive your business forward. That is exactly where this presentation deck earns its keep translating raw data into the vital signs your startup should monitor daily. Built around the lean canvas model these PPT slides walk you through identifying actionable metrics over vanity numbers complete with data visualization graphics that make complex relationships instantly clear. Perfect for investor updates or internal strategy reviews the editable slides let you swap in your own figures while keeping the consulting grade structure intact. Stop guessing what matters and start measuring what moves the needle with this focused corporate presentation.
-
 Key Metrics in a Business Plan PPT Demonstration VA
Numbers tell the story your business plan narrative cant. When investors flip through your deck they scan for the proof points that separate a solid venture from a hopeful guess. This presentation bundle turns your raw performance data into persuasive visual storytelling making every customer acquisition cost and profit margin impossible to ignore. Instead of drowning in spreadsheets you get modern slide design that frames your Key Metrics in a Business Plan context with clear data visualization and executive slides built to command attention. The editable slides adapt quickly to your strategy deck ensuring your growth story lands with absolute clarity every time you present.
-
 Key Metrics for Maintenance Planning Performance PPT Information VA
Keeping a plant running without surprises is an operations act that starts long before a wrench ever turns. Your maintenance planning performance directly drives uptime budget control and crew productivity yet bridging that gap between the boardroom and the shop floor often feels elusive. This PowerPoint templates collection helps you translate complex availability data and schedule compliance rates into a clear actionable narrative for stakeholders. Featuring editable slides and modern slide design you can map your workflow presentation against real operational targets making every review meeting a consultative session. Use these presentation graphics to spotlight backlogs and asset health turning raw numbers into a strategy deck that aligns teams and executives on the next critical move.
-
 Key Metrics for Effective Fleet Monitoring PPT Sample VA
Numbers tell the real story of your fleet long before a dashboard warning light ever flashes. Yet most operations drown in raw data while missing the signals that actually protect margins and driver safety. This presentation deck turns that noise into clear decision ready intelligence. You will explore the essential Key Metrics for Effective Fleet Monitoring from fuel burn rates to idle time patterns all framed through sharp data visualization that makes trends obvious at a glance. Every slide offers editable charts and modern slide design so your team can adapt the analysis to their own operational reality. Walk into your next review armed with a corporate presentation that proves exactly where performance improves and where it stalls.
-
 Key Metrics for Demand Planning PPT Information VA
Forecasting accuracy can make or break a quarter yet most teams still wrestle with data scattered across spreadsheets. You need a clear way to communicate the numbers that truly drive inventory decisions and this Key Metrics for Demand Planning PPT information provides exactly that structure. This corporate presentation translates complex forecasting data into digestible visual storytelling helping you align stakeholders on the critical KPIs like forecast bias service level and inventory turnover. With these editable slides you can quickly adapt the modern slide design to your specific workflow presentation needs. Stop drowning in raw data and start presenting a clear confident strategy that wins buy in from finance and operations alike.
-
 Key Metrics for Construction Companies PPT Template VA
Keeping a construction firm profitable means knowing exactly which numbers deserve your attention before problems surface on site. This presentation deck translates complex operational data into clear actionable insights that support smarter daily decisions. From project margins and labor productivity to equipment utilization and safety incident rates each slide frames the metrics that truly drive construction performance. The modern slide design pairs bold visuals with straightforward data visualization making it easy to present financial health to stakeholders or align your team during weekly reviews. With fully editable slides you can adapt these presentation graphics for any project phase or audience. Give your next corporate presentation the clarity your projects demand.
-
 Key Messaging Pillars PPT Summary VA
Tired of audiences scrolling past your core ideas You need a structure that turns scattered thoughts into a persuasive unified voice. This presentation deck provides the perfect architecture for building a compelling narrative helping you distill complex strategies into memorable talking points. With these business slides you can clearly define what matters most ensuring every stakeholder walks away with the same powerful takeaways. The modern slide design makes it simple to visualize your priorities while the fully editable slides allow for quick customization to fit any audience. Strengthen your brands story with a coordinated corporate presentation that drives alignment and action.
-
 Key Messaging Framework PPT Outline VA
When your sales calls stall because every conversation sounds the same the problem isnt your product its how you frame it. This Key Messaging Framework PPT outline gives you a repeatable structure to align your team around one core narrative. Instead of scrambling for the right words you get a practical set of presentation graphics that guide you through positioning proof points and audience specific value props. Use these editable slides to craft a professional PPT that turns scattered ideas into a clear persuasive story. Stop letting your best pitches get lost in translation and start delivering consistent messaging that actually moves deals forward.
-
 Key Learnings from a Project PPT Guidelines VA
Finishing a major initiative is one thing capturing the wisdom it generated is another. You need to translate raw experiences into actionable insights your team can actually use moving forward. A structured corporate presentation ensures those hard won lessons dont get lost in the post project shuffle. These PPT slides give you a clear visual storytelling path to document successes flag process bottlenecks and outline your next set of strategic steps. The modern slide design is fully editable so your team can adapt the workflow presentation to fit specific project phases. Turn project outcomes into a lasting knowledge asset with this professional deck.
-
 Key Leader Engagement PPT Information VA
Closing the gap between stakeholder expectations and day to day execution often hinges on one critical factor the people at the top. This corporate presentation gives you the structure to map out influence networks align leadership on shared priorities and turn quiet buy in into active advocacy. Built as a consulting ready deck the PowerPoint templates feature clean data visualization for mapping relationships and clear creative layouts for action planning. You can adjust every editable slide in Google Slides to reflect your internal reality. Stop relying on guesswork start directing the conversation where it matters most with these professional PPT slides.
-
 Key Issue Matrix PPT Information VA
Sorting through competing priorities can stall even the sharpest strategy sessions. You need a way to crystallize what truly demands attention and fast. That is exactly where this Key Issue Matrix PPT information resource steps in giving you a visual system to rank concerns by impact and urgency. These presentation graphics turn scattered notes into a clear decision point highlighting exactly where your team should focus next. The modern slide design makes complex trade offs instantly digestible so stakeholders grasp the reasoning without a lengthy walkthrough. Use this editable slide set to build alignment speed up conversations and prove you have a handle on what matters most.
-
 Key Factors of Economic Growth PPT Sample VA
Your next board meeting or investor update deserves more than a dry list of stats. This deck translates complex drivers like labor productivity capital investment and technological innovation into a clear compelling narrative that stakeholders will actually remember. Whether you are presenting macroeconomic trends to an executive team or breaking down policy impacts for a classroom these presentation graphics help you turn raw data into persuasive visual storytelling. Each editable slide is built for clarity allowing you to customize charts and graphs without breaking your workflow. Make your case with confidence using a modern slide design that positions your analysis as both authoritative and accessible.
-
 Key Factors for Competitive Success PPT Presentation VA
Outlasting rivals rarely comes down to luck it comes down to deliberate focus. Your strategy deserves a presentation that clarifies exactly where to concentrate resources for maximum market impact. This PowerPoint template turns complex strategic analysis into a clear action oriented path forward. Professional PPT slides help you map internal strengths against external opportunities making it easy to show stakeholders precisely which moves will create distance from competitors. The modern slide design works seamlessly for corporate strategy reviews board meetings or investor conversations. With clean data visualization and custom business slides you can translate high level vision into operational priorities that everyone understands. Stop explaining and start leading with a visual storytelling deck built for decisive action.