


Example Budget Presentation Powerpoint Presentation Slides
Worried about creating budget PPT? Need not to stress anymore. We offer you a content-ready example budget presentation PowerPoint presentation slides. Steer your business performance effectively by using our readymade professional quality sample capital PowerPoint templates. These capital forecasting PPT stock photos can also be utilized to give a presentation on varied topics like business plan operational strategy, revenue cost, financial plan, performance budget, cash flow, capital budgeting, cost and expenses, cost accounting finance, income statement, personal finance, sales volume, media finance and many more. Our expenditure capital PowerPoint visuals will help you analyze explicitly where you stand with your finances. Our cash allocation presentation illustration encompasses all the suited templates such as company resources, event cost, budget icon slide, budgeting comparison, product launch capital plan, etc. Download our customizable example budget PPT templates and show finance account with no hassles!. Our Example Budget Presentation Powerpoint Presentation Slides enable you to endure hardship. They come forward to bear the brunt.
Worried about creating budget PPT? Need not to stress anymore. We offer you a content-ready example budget presentation Pow..


-

- Google Slides is a new FREE Presentation software from Google.
- All our content is 100% compatible with Google Slides.
- Just download our designs, and upload them to Google Slides and they will work automatically.
- Amaze your audience with SlideTeam and Google Slides.
-

Want Changes to This PPT Slide? Check out our Presentation Design Services
-

- WideScreen Aspect ratio is becoming a very popular format. When you download this product, the downloaded ZIP will contain this product in both standard and widescreen format.
-

- Some older products that we have may only be in standard format, but they can easily be converted to widescreen.
- To do this, please open the SlideTeam product in Powerpoint, and go to
- Design ( On the top bar) -> Page Setup -> and select "On-screen Show (16:9)” in the drop down for "Slides Sized for".
- The slide or theme will change to widescreen, and all graphics will adjust automatically. You can similarly convert our content to any other desired screen aspect ratio.
Compatible With Google Slides

Get This In WideScreen
You must be logged in to download this presentation.


Do you want to remove this product from your favourites?
PowerPoint presentation slides
These slides can be downloaded quickly. Completely editable templates. These designs contain 40 slides and encircle all the relevant information. High-resolution template designs. Compatible PowerPoint layout. Easily convertible into PDF and JPG formats. We have used standardize position, colors, and styles. Our visuals can be used by promoters, marketers, organizations, business professionals, sales, and consultant.The stages in this process are example budget presentation, example financial plan outline, example financial estimate ppt.

People who downloaded this PowerPoint presentation also viewed the following :
Content of this Powerpoint Presentation
Presenting and discussing the budget before starting a new business period/project is crucial for businesses. A well-crafted budget presentation helps stakeholders understand the organization's financial priorities and strategies, fostering transparency and trust among management.
An effective budget presentation facilitates informed decision-making. It allows strategic adjustments in response to financial performance or market changes.
Budget presentations must include key elements such as revenue forecasts, detailed expense breakdowns, funding needs, and financial goals. Clear visuals like charts and graphs and a narrative explaining the numbers help illustrate the organization's financial strategy and priorities.
It can be difficult to ensure the presentation's clarity and conciseness while including all necessary financial details. It is challenging to balance technical and financial information while making your budget presentation accessible and engaging for stakeholders. That is where our ready-to-use and customizable Budget Presentation Template will save you the day!
Let’s walk you through the best way to present financial information, using clear and professional visuals like colorful charts, graphs, and well-structured tables.
After that, you can download this expert-designed PPT and tweak it to match your business or budget requirements. The PowerPoint Deck is 100% customizable and easy to edit.
Let's begin!
Template 1: Budgeting Template (Layout 1)
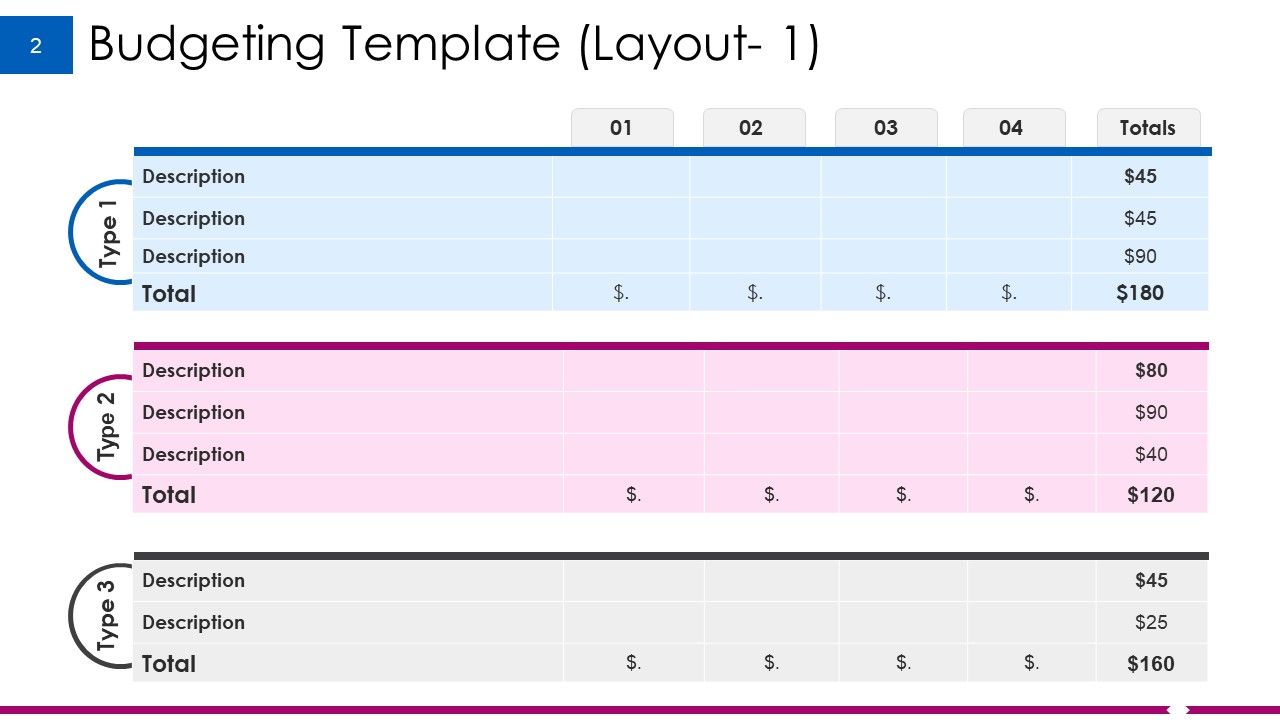
This budgeting layout helps in detailed financial planning by providing a structured and color-coded layout to itemize costs across multiple categories and timeframes. Each category has space to share a description of at least two items along with financial figures for four months/quarters and the total at the right end. Its clear format allows for easy input, tracking, and comparison of expenditures, supporting detailed budget analysis presentations. This template offers a straightforward way for businesses to maintain fiscal oversight and ensure that financial strategies align with company goals.
Template 2: Budgeting Template (Layout 2)
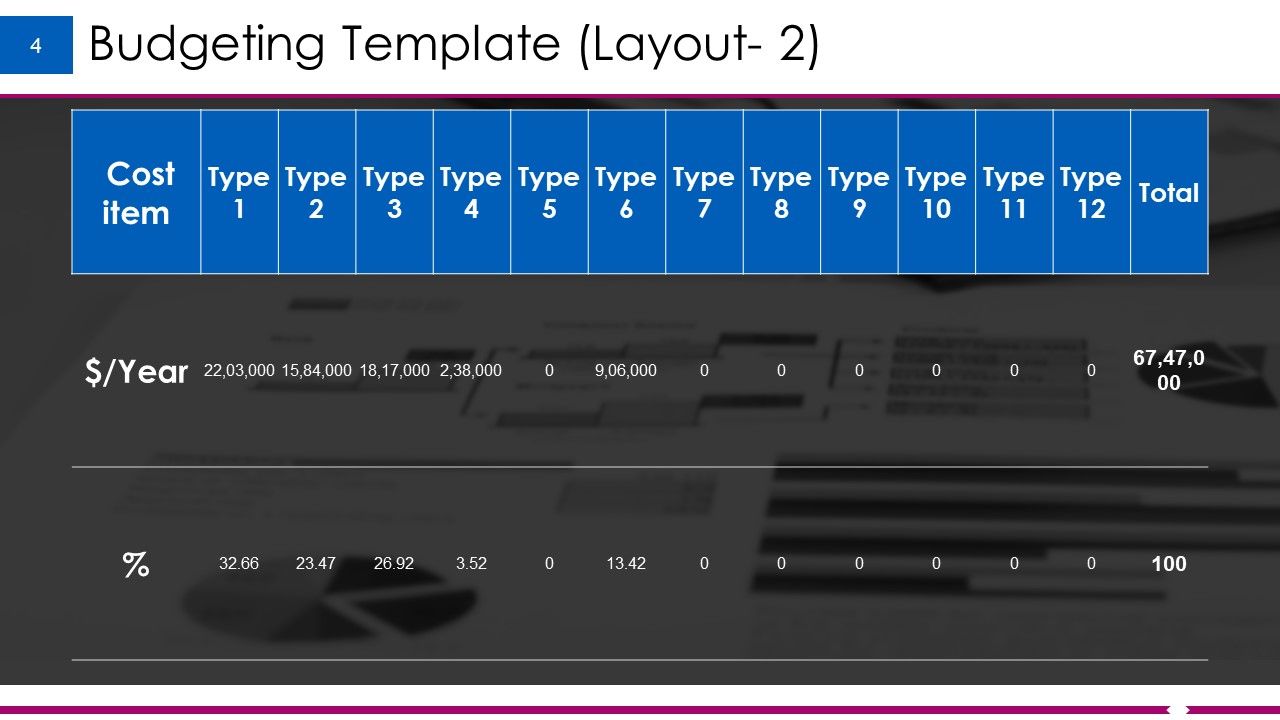
This Budgeting Template offers a clear and concise layout for financial planning across cost items throughout the year. It allows sharing the cost per year for each item, with an annual overview and percentage breakdown for each category. The design has well-designed spaces for presenting twelve items with their financial figures and percentages. It enables financial analysts to track fiscal health, allocate resources, and identify areas for cost optimization in budget presentations.
Template 3: Channel Marketing Budget
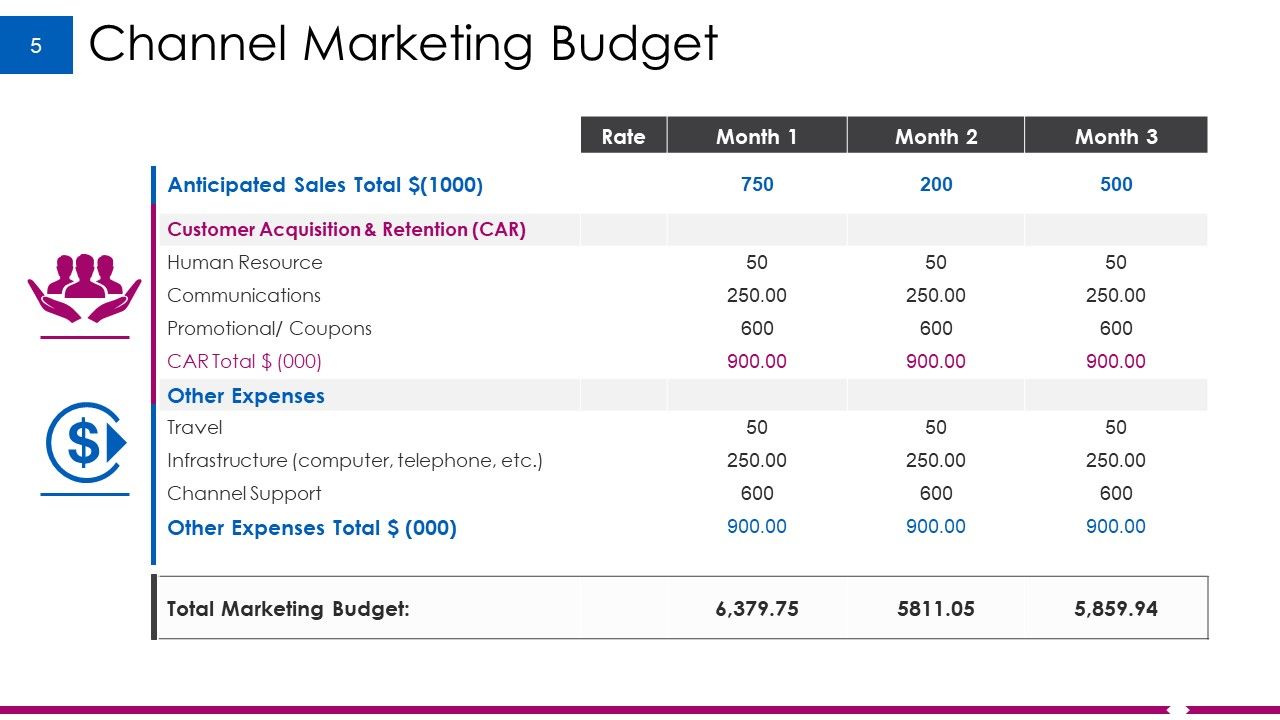
Financial strategists can use this channel marketing budget slide to showcase a detailed, month-by-month breakdown of marketing expenditures. The slide categorizes the marketing expenses in Customer Acquisition & Retention (CAR) and Other Expenses. CAR includes costs of human resources, communication, and promotional/coupons. Travel, infrastructure, and channel support are included in other expenses. The design records and compares these numbers for three months to assess expense patterns and comprehensive budget planning. Its clear structure and cumulative totals enable quick assessments of marketing spend over time, aligning with anticipated sales figures. This template will help marketers balance budget allocations with campaign goals and share precise, concise financial projections with stakeholders.
Template 4: Budgeting - Planned/Actual Comparison
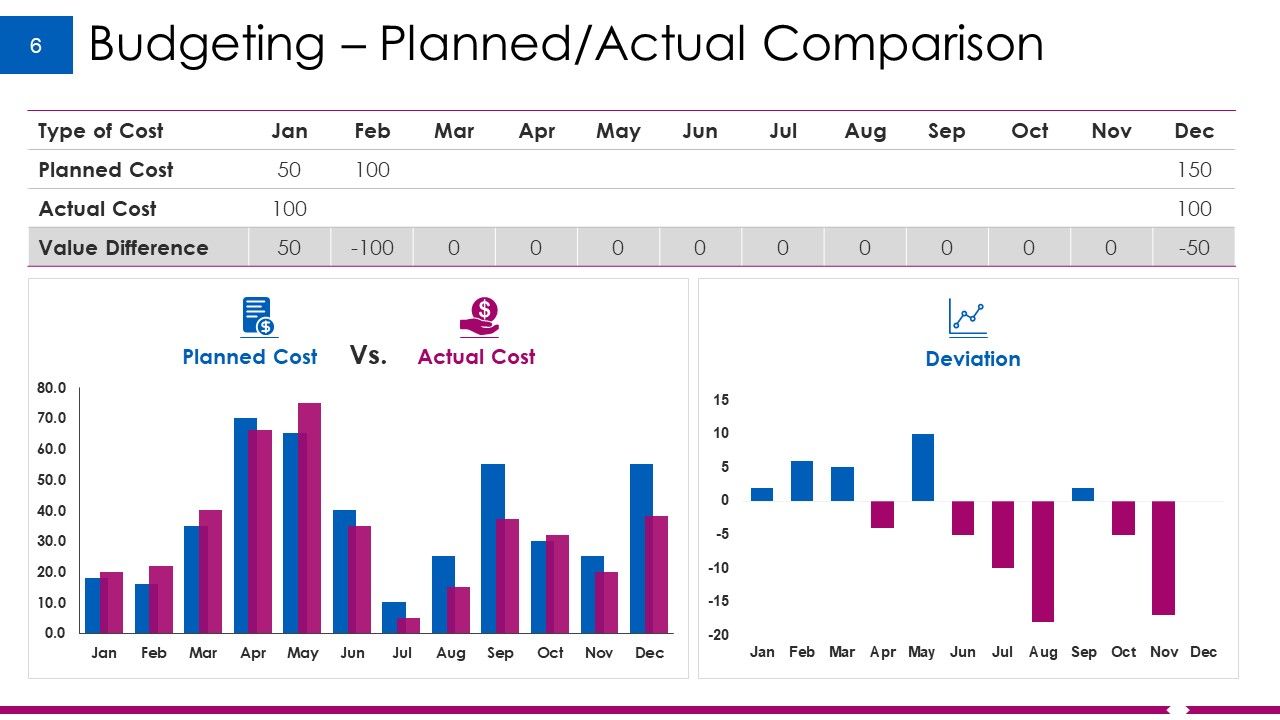
This budget comparison slide showcases a side-by-side comparison of monthly planned versus actual expenses throughout the year. It features a bar chart for a direct monthly comparison and a deviation chart for tracking over or underspend. A table over these charts presents planned and actual costs in numbers and value differences for easy reading and interpretation. This template will be an invaluable resource for businesses to facilitate financial analysis, budget management, strategic decision-making, and fiscal transparency.
Template 5: Product Launch Budget Plan
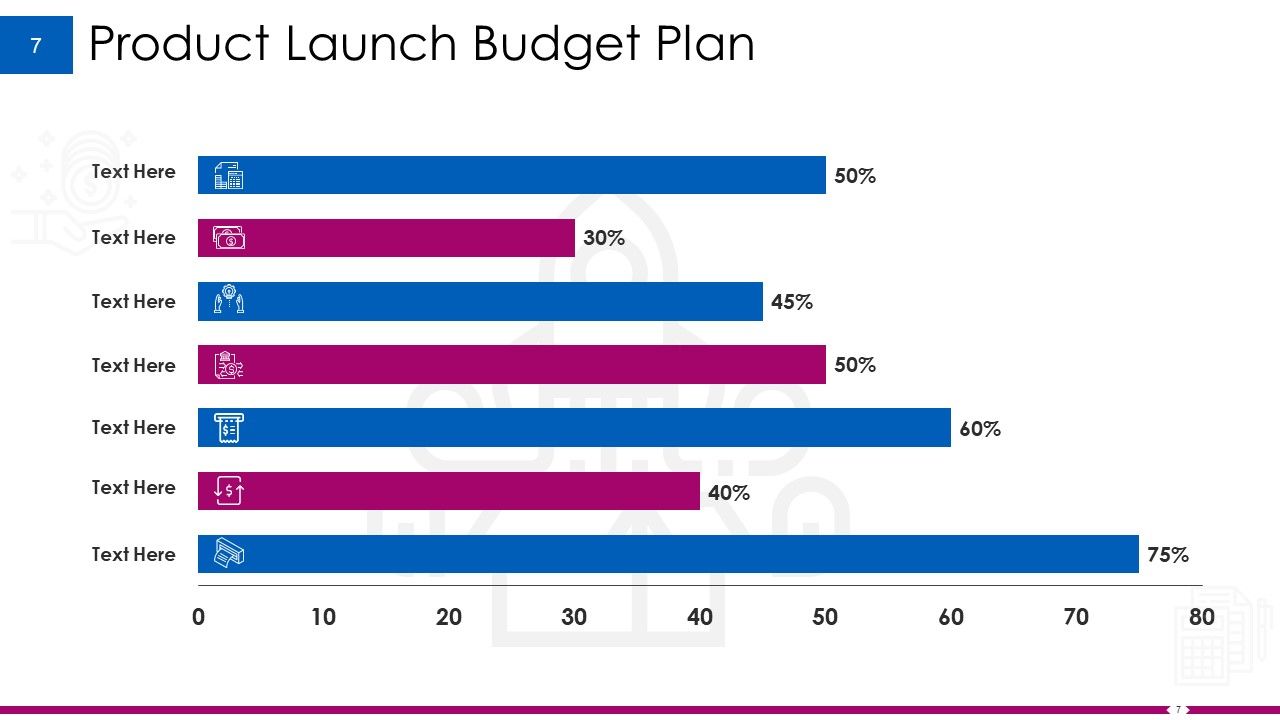
Use this budget plan slide to allocate financial resources across different categories in the product launch phase. Each category is visually represented by progress bars, indicating the percentage of the budget allocated, with color-coding for clear differentiation. You can customize the categories in this layout to match your product launch plan needs. This layout allows an immediate understanding of budget distribution and progress in presentations that require concise financial overviews and strategic planning.
Template 6: Company Budget
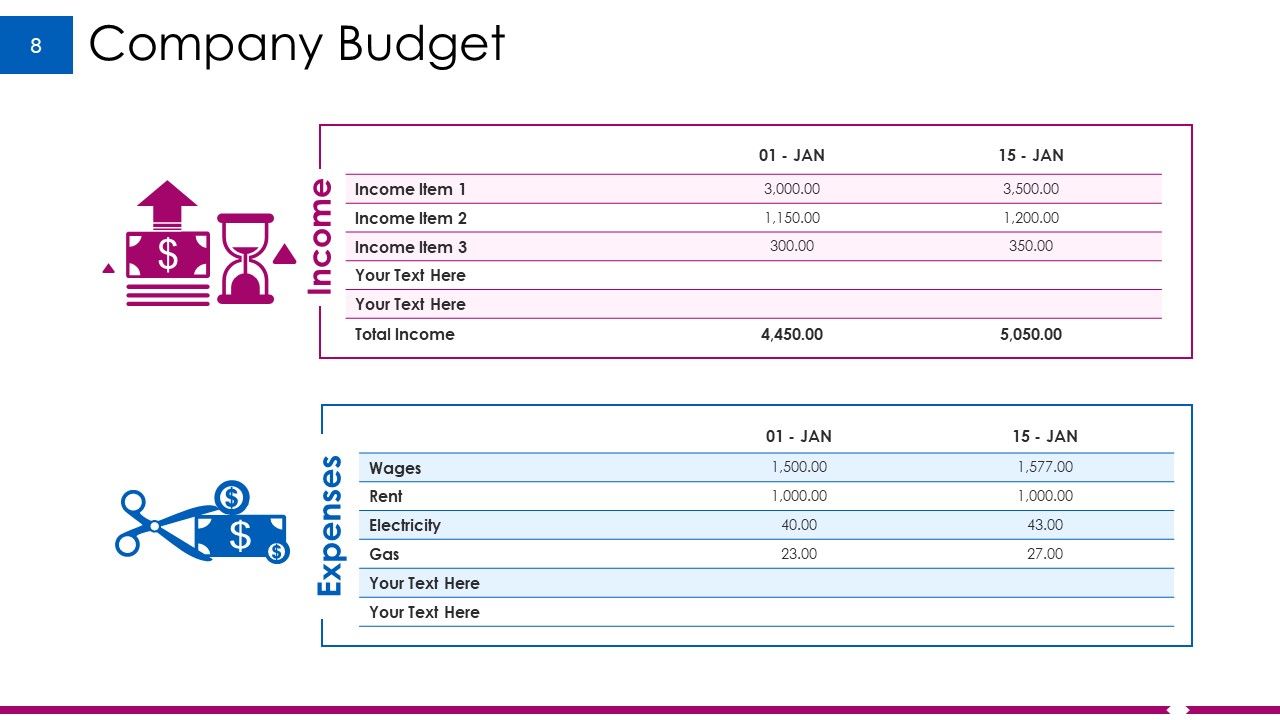
This company budget slide is a streamlined visual financial tool designed to organize and present a company's income and expenses clearly. With designated sections for various income streams and a detailed breakdown of costs like wages, rent, and utilities, this slide will help in meticulous budget planning. It offers a comparative snapshot of financial data across two different time frames, allowing for easy financial health and planning visualization.
Template 7: Product Launch Marketing Budget
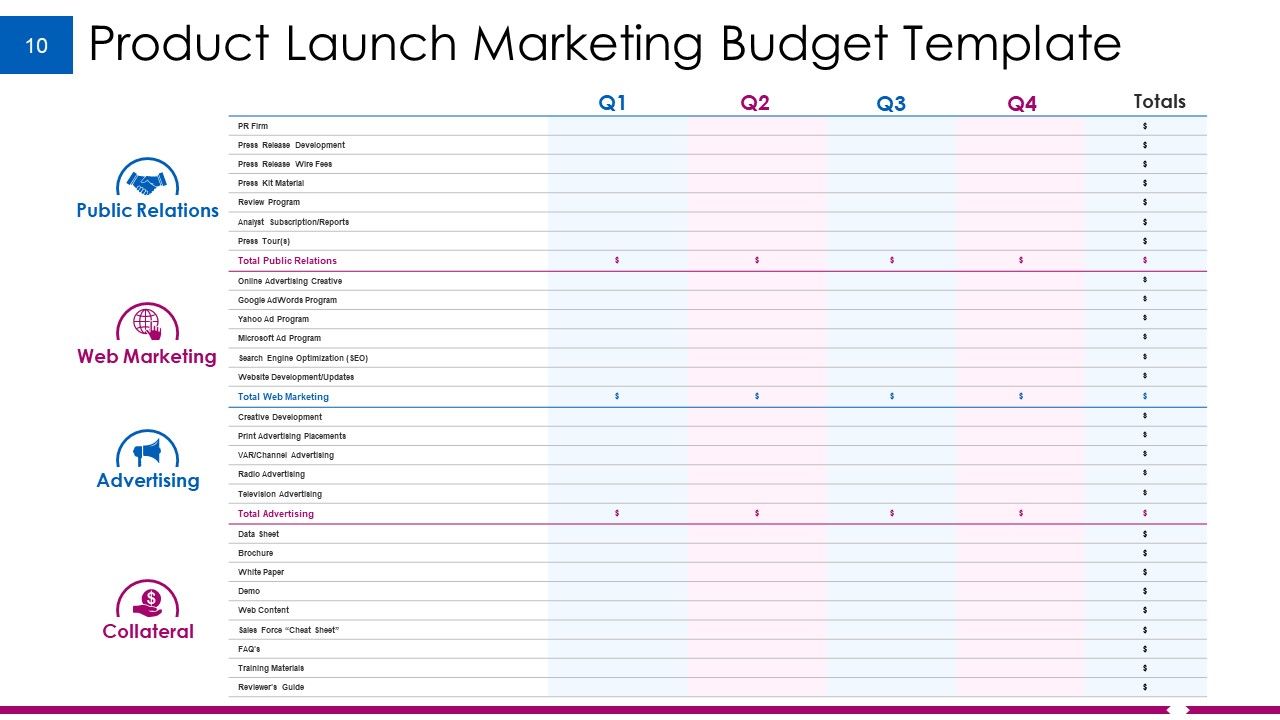
Planning a product launch in your next financial year? This product launch budget template will help you strategize the fiscal aspects of marketing campaigns. It categorizes expenses into public relations, web marketing, advertising, and collateral over quarterly intervals, ensuring comprehensive and balanced financial planning. This slide will allow the financial planning and product launch team to allocate resources efficiently across various marketing channels and track expenditure trends throughout the product launch lifecycle.
Template 8: Social Media Budget
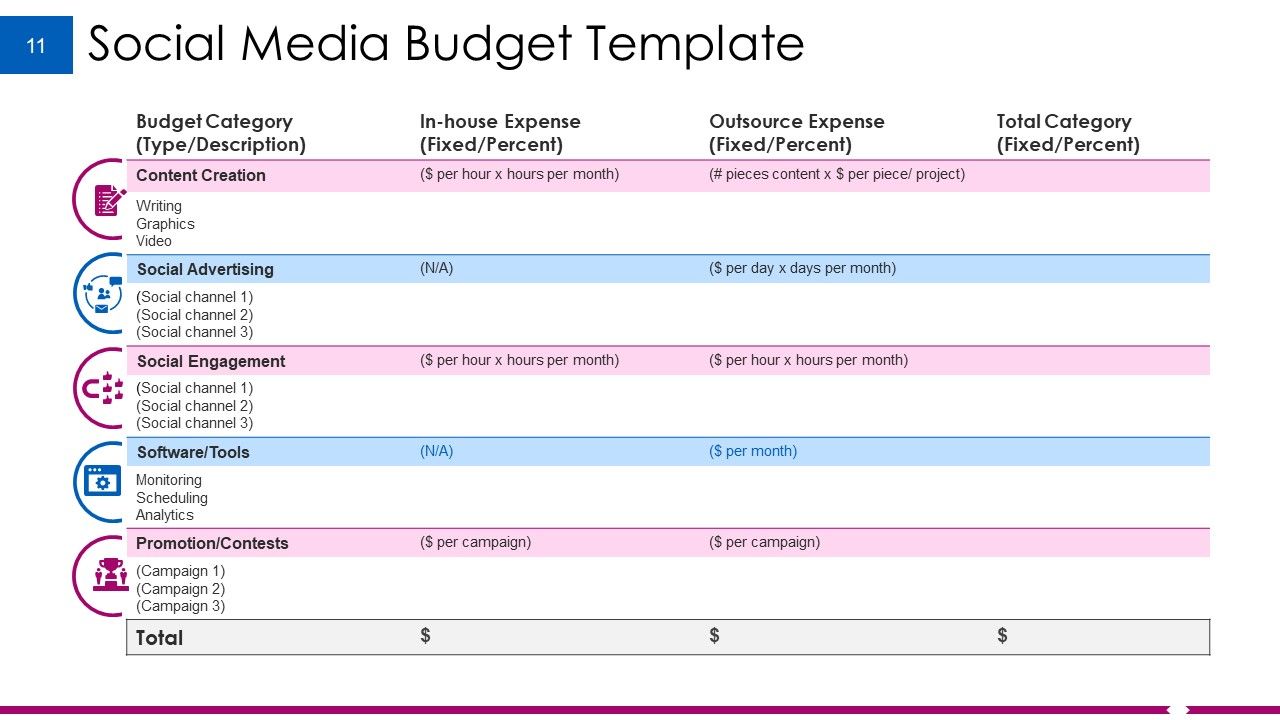
The Social Media Budget slide is designed to streamline financial planning by including social media strategies and budgets. Featuring clearly defined categories like content creation, social advertising, software, promotions, and social engagement, the template allows users to outline in-house and outsourced expenses to ensure a comprehensive view of costs. This template aids budget presentations by providing a snapshot of total expenditures per category and total expenses across categories for in-house and outsourced services. It helps in precise and strategic resource allocation for optimal social media management.
Template 9: Stacked Line with Markers
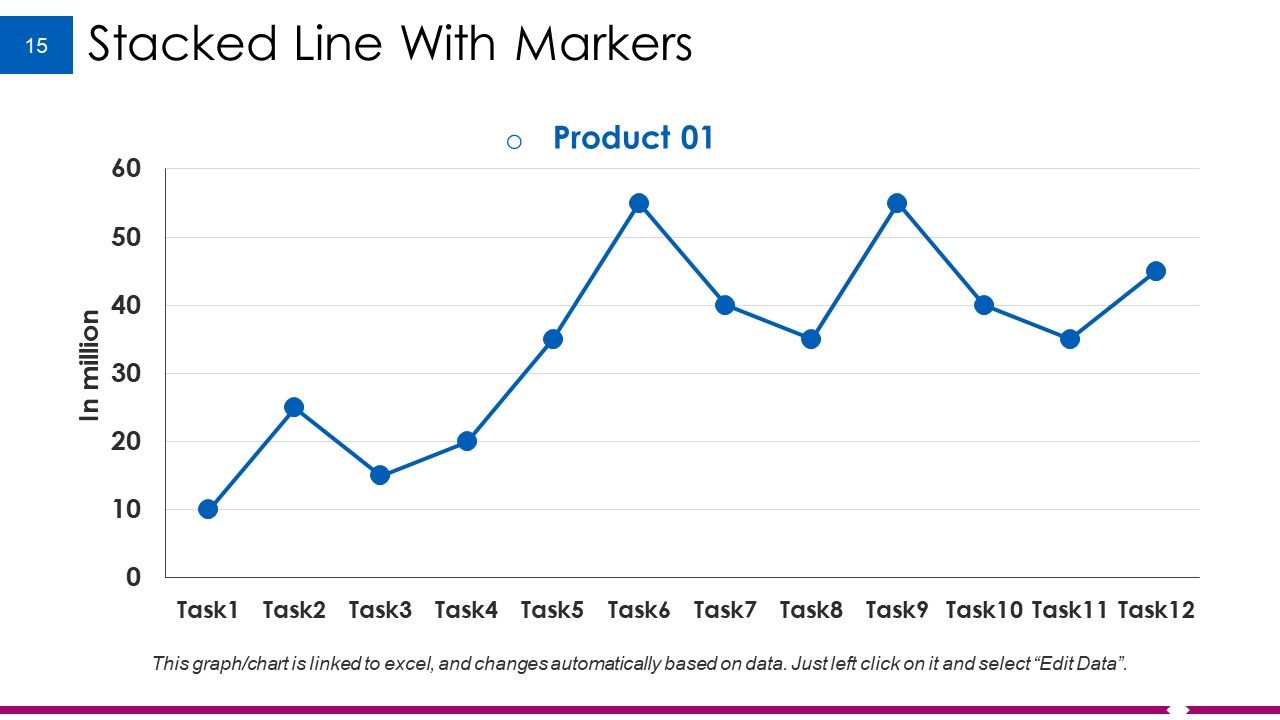
Use this line graph to present data trends for a product use for various tasks. With data nodes and ample space to write insights for each data point, it presents axis values like customers or products sold in millions on a horizontal axis. On the vertical axis, it showcases the task numbers. The connected line between two points highlights fluctuations over time and facilitates quick analysis of performance metrics. It will help you gather insights like how many customers use the product for which task or for which task most customers use the product. It is a must-have slide for easy data representation.
Template 10: Volume Open High Low Close Chart
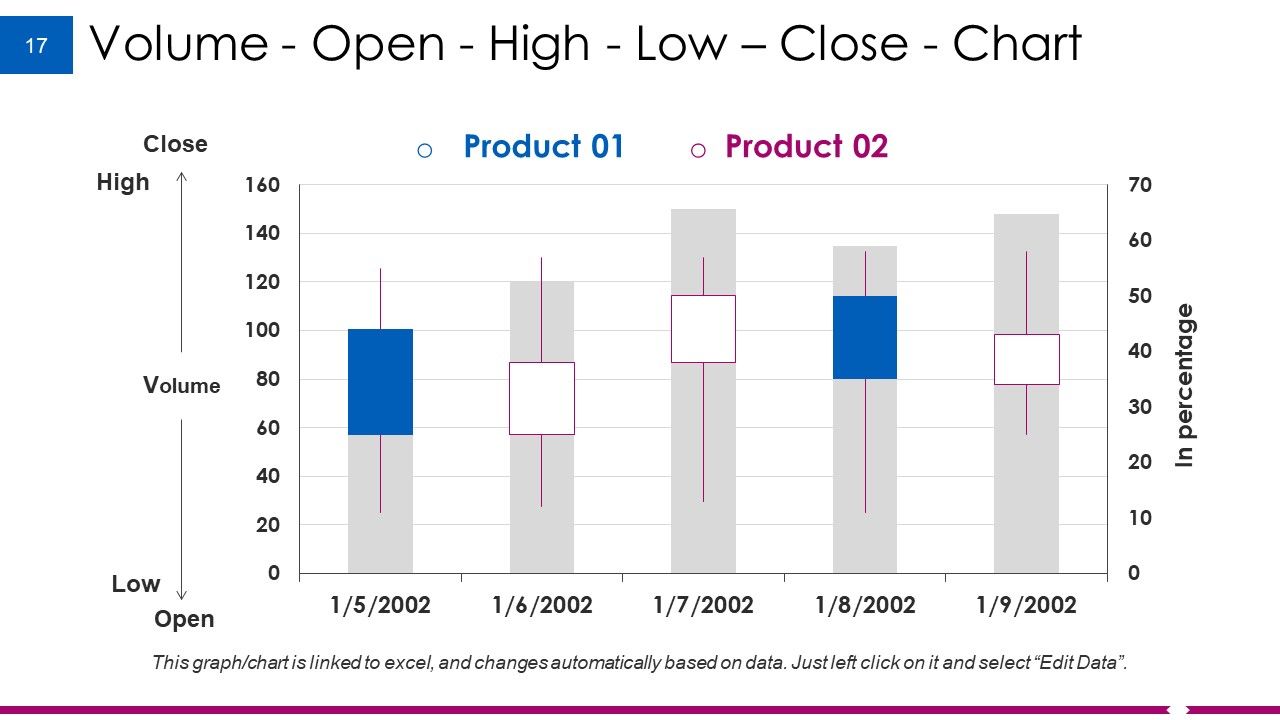
With this volume chart slide, budget presenters can compare and highlight the open, high, low, and close values of two products over a series of dates. It's useful for budget and financial presentations, providing a clear and concise overview of market trends or sales performance with a color-coded volume bar and line graph interface. The design is interactive and easy to edit to create comparison slides in budget presentations.
Tallying the Final Ledger!
A budget presentation is a strategic tool that guides an organization's financial planning and management, ensuring fiscal discipline and long-term sustainability. Use this budget presentation with the required neat and professional visuals, like charts and graphs, to make the most of your budget discussions. Strategize and sort your business finances, marketing campaign budgets, and product launch expenses, all while keeping things transparent and digestible. Break the stereotype of boring finance meetings with this engaging budget presentation!
Example Budget Presentation Powerpoint Presentation Slides with all 40 slides:
Block your distractions with our Example Budget Presentation Powerpoint Presentation Slides. Acquire the ability to achieve fine focus.
FAQs
The purpose of this presentation is to provide a budgeting template, charts, graphs, and various slides for businesses to create their own budget presentations, as well as showcase their mission, vision, team, financial scores, and goals.
The presentation includes Budgeting Template (Layout-1) and Budgeting Template (Layout-2) in percentage, Channel Marketing Budget, Event Budget, Product Launch Marketing Budget Template, and Social Media Budget Template.
The presentation includes Stacked Line With Markers, Clustered Bar, Volume-Open-High-Low-Close, Stacked Area-Clustered Column, and Open-High-Low-Close-Chart charts and graphs.
The presentation includes slides for mission and vision, about us, our team, our goals, dashboard, financial scores, quotes, comparison, location, our targets, puzzles, circular image, lego blocks, silhouettes, hierarchy, Venn diagram, mind map, magnifying glass, and bulb or idea.
Yes, the content in the presentation can be customized as per the business requirement.
-
Nice
-
Excellent
-
excellent
-
good
-
EXCELLENT
-
EXCELLENT
-
Best Representation of topics, really appreciable.
-
Visually stunning presentation, love the content.
