- Sub Categories
-
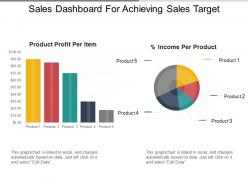 Sales dashboard for achieving sales target ppt templates
SlideTeam would like to introduce all of you with this totally alterable and user-friendly sales dashboard for achieving sales target PPT templates. This PowerPoint presentation is fully editable which allows you to make changes to its predesigned slides. It allows you to change the size, color, and orientation of various features. By simply following the instructions given in the sample slides you can make these changes. The presentation allows you to save it in the format of either JPG or PDF. You can add or delete any given information from the already prepared slides.
-
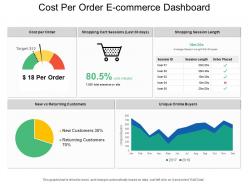 Cost per order e commerce dashboard
Presenting this set of slides with name - Cost Per Order E Commerce Dashboard. This is a five stage process. The stages in this process are Mercantilism, Commercialism, Ecommerce.
-
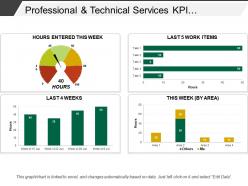 Professional and technical services kpi dashboard snapshot showing timesheet
Presenting this set of slides with name - Professional And Technical Services Kpi Dashboard Snapshot Showing Timesheet. This is a four stage process. The stages in this process are Professional And Technical Services, Services Management, Technical Management.
-
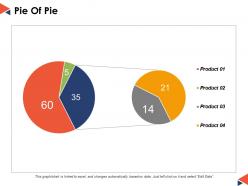 Pie of pie ppt powerpoint presentation file portfolio
This is a four stages process. The stages in this process are Pie Chart, Percentage, Marketing, Business, Analysis.
-
 Pie chart ppt file design templates
Presenting this set of slides with name - Pie Chart Ppt File Design Templates. This is a four stage process. The stages in this process are Product, Pie, Process, Percentage, Finance.
-
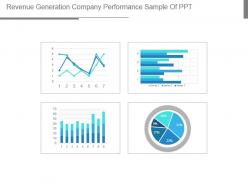 Revenue generation company performance sample of ppt
Presenting revenue generation company performance sample of ppt. This is a revenue generation company performance sample of ppt. This is a four stage process. The stages in this process are business, marketing, graph, percentage, success.
-
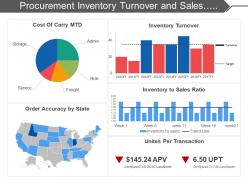 Procurement inventory turnover and sales ratio dashboard
Presenting this set of slides with name - Procurement Inventory Turnover And Sales Ratio Dashboard. This is a five stage process. The stages in this process are Purchase, Procurement, Buy.
-
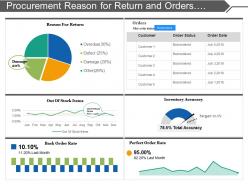 Procurement reason for return and orders detail dashboard
Presenting this set of slides with name - Procurement Reason For Return And Orders Detail Dashboard. This is a six stage process. The stages in this process are Purchase, Procurement, Buy.
-
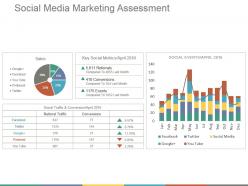 Social media marketing assessment ppt background designs
Presenting the social media marketing PowerPoint PPT. This slide is fully customizable PowerPoint template to communicate your ideas clearly. You can easily edit the charts and graphs in excel sheet. This presentation slide is designed with elegant shapes and visuals. You can convert this slide into numerous format options like JPEG, JPG or PDF. This template gives a professional outlook to your PowerPoint presentation. It is easy to customize each graphics and text as per your need. You can download it easily at a click of button.
-
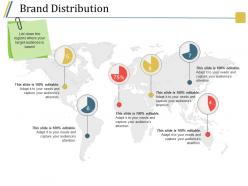 Brand distribution powerpoint show
Presenting brand distribution powerpoint show. This is a brand distribution powerpoint show. This is a six stage process. The stages in this process are pie, location, percentage, map, geographical.
-
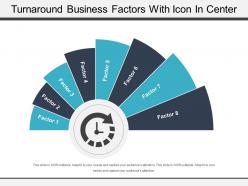 Turnaround business factors with icon in center
Presenting turnaround business factors with icon in center. This is a turnaround business factors with icon in center. This is a eight stage process. The stages in this process are turnaround, looking back, u turn.
-
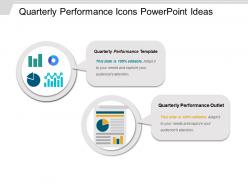 Quarterly performance icons powerpoint ideas
Presenting quarterly performance icons PowerPoint ideas. This PPT template has an ample amount of space to put in titles and subtitles. This slide offers high resolution based presentation which does not change the image even after resizing. This presentation icon is completely compatible with Google Slides. Quick downloading speed and simple editing options in color text and fonts.PPT icons can easily be changed into JPEG and PDF applications. This diagram has been designed for entrepreneurs, corporate and business managers.
-
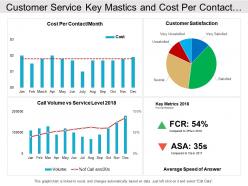 Customer service key mastics and cost per contact dashboard
Introducing customer service key mastics and cost per contact dashboard PowerPoint design. This template design is fully compatible with Google Slide. You can modify the color, text style, font size of the template as per requirement. The slide is simple to download and can be saved in PDF, and JPEG formats. Additional instructional slides are provided for guidance. Best quality graphics are employed. The graphics of the slide does not distort when projected on a large screen. Content can be added with other valuable data. You can personalize the template by adding your organization name, and copyright.
-
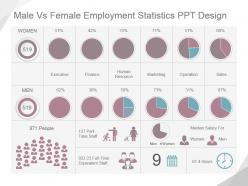 Male vs female employment statistics ppt design
Presenting male vs female employment statistics ppt design. This is a male vs female employment statistics ppt design. This is a two stage process. The stages in this process are women, men, executive, finance, human resource, marketing, operation, sales, people, part time staff, full time equivalent staff, median salary for, hours.
-
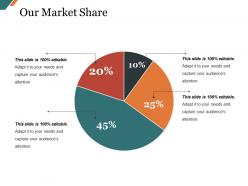 Our market share presentation pictures
Presenting this set of slides with name - Our Market Share Presentation Pictures. This is a four stage process. The stages in this process are Pie, Percentage, Finance, Chart, Planning.
-
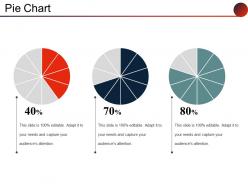 Pie chart powerpoint slide backgrounds
Presenting this Pie Chart PowerPoint Slide Backgrounds PowerPoint presentation. The PPT can be downloaded and saved in common images or document formats like JPEG and PDF. The PPT supports both the standard(4:3) and widescreen(16:9) sizes. It is compatible with Google Slides and other related software. Alter the style, size, and the background of the slides. High-quality graphics ensure that distortion does not occur.
-
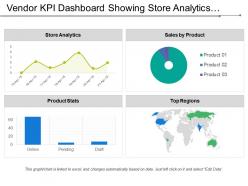 Vendor kpi dashboard showing store analytics sales by product and product stats
Presenting this set of slides with name - Vendor Kpi Dashboard Showing Store Analytics Sales By Product And Product Stats. This is a four stage process. The stages in this process are Vendor, Supplier, Retailer.
-
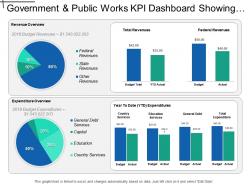 Government and public works kpi dashboard showing revenue and expenditure overview
Presenting this set of slides with name - Government And Public Works Kpi Dashboard Showing Revenue And Expenditure Overview. This is a four stage process. The stages in this process are Government And Public Works, Government And Public Tasks.
-
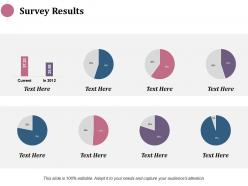 Survey results finance ppt infographics design inspiration
Presenting this set of slides with name - Survey Results Finance Ppt Infographics Design Inspiration. This is a eight stage process. The stages in this process are Finance, Analysis, Business, Investment, Marketing.
-
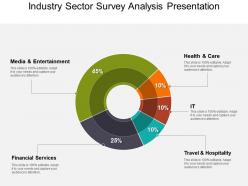 Industry sector survey analysis presentation powerpoint templates
Presenting industry sector survey analysis presentation PowerPoint template PPT slide. The template has a high-definition editable slide. It contains colorful flat design infographics, clipart, and shapes. Moreover, the shapes, charts, and icons are also changeable. The industry analysis graphic is ideal for MBA students who require pre-designed thoroughly editable PPT slide for their numerous presentations. Also, the business consultants and analysts can make use of it to present their research and findings to the executive class audience for making smart decisions. Also, the slide is compatible with multiple software and format options too.
-
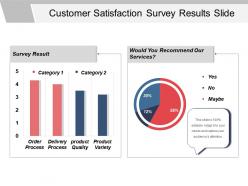 Customer satisfaction survey results slide powerpoint slide introduction
Presenting Customer Satisfaction Survey Results Slide PowerPoint Slide Introduction. A presenter can even do changes in the icon size of the satisfaction survey as per his requirement. Customize the aspect ratio, font style, and font size, etc. because this survey template is a fully editable template. Its compatibility with Google Slides makes it accessible at once. This template is linked with the excel sheet. You can save this infographic survey template in other formats such as JPEG & PDF. Download this slide now in standard screen and widescreen.
-
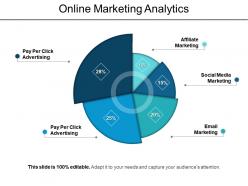 Online marketing analytics ppt design templates
Presenting a slide named Online Marketing Analytics PPT Design Templates. Customize the font color, font style, and font size. You can resize and reshape the icon as per your requirement. Change the color of the background. Export this slide anywhere as it is compatibility with Google Slides. Convert and save this template as PDF or JPG formats. Download it in standard and widescreen size. This slide is data-driven and can be linked to Excel sheet.
-
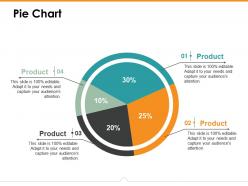 Pie chart ppt icon example introduction
This is a four stage process. The stage in this process are Business, Management, Marketing, Sales, Strategy.
-
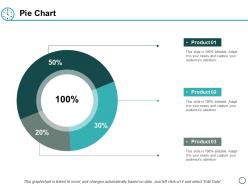 Pie chart finance ppt powerpoint presentation layouts pictures
Presenting this set of slides with name - Pie Chart Finance Ppt Powerpoint Presentation Layouts Pictures. This is a three stages process. The stages in this process are Pie Chart, Finance, Marketing, Business, Analysis.
-
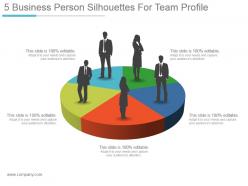 5 business person silhouettes for team profile sample ppt presentation
Presenting 5 business person silhouettes for team profile sample ppt presentation. This is a 5 business person silhouettes for team profile sample ppt presentation. This is a five stage process. The stages in this process are silhouettes, management, communication, business, marketing.
-
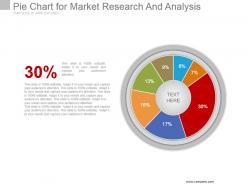 Pie chart for market research and analysis powerpoint ideas
Presenting pie chart for market research and analysis powerpoint ideas. This is a pie chart for market research and analysis powerpoint ideas. This is a seven stage process. The stages in this process are pie chart, percentage, analysis, marketing, strategy, business, success.
-
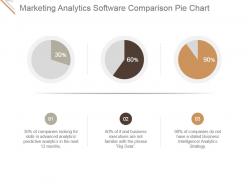 Marketing analytics software comparison pie chart powerpoint images
Presenting marketing analytics software comparison pie chart powerpoint images. This is a marketing analytics software comparison pie chart powerpoint images. This is a three stage process. The stages in this process are marketing, analysis, measure, pie chart, comparison.
-
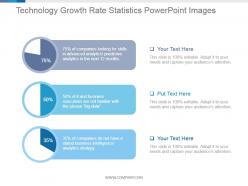 Technology growth rate statistics powerpoint images
Presenting technology growth rate statistics powerpoint images. This is a technology growth rate statistics powerpoint images. This is a three stage process. The stages in this process are business, marketing, percentage, finance, success.
-
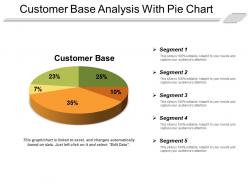 Customer base analysis with pie chart
Presenting customer base analysis with pie chart. This is a customer base analysis with pie chart. This is a five stage process. The stages in this process are customer base, recurring customers, customer services.
-
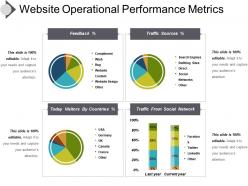 Website operational performance metrics presentation powerpoint
Presenting, website operational performance metrics presentation PowerPoint. This PowerPoint presentation is fully customizable; allowing you to edit the color patterns, text, and icons shown here. This PPT slide is free of space constraints to mention titles and subtitles. Include your company logo here in the PPT to personalize further. The colors of the elements shown in the diagram can be changed according to your liking. This PPT layout is available in both standard 4:3 and widescreen format 16:9 after downloading. This PPT slide is compatible with Google slides and can be edited in any PowerPoint software. Download this PowerPoint deck in a snap and explore full features.
-
 Pie chart ppt file designs
Presenting this set of slides with name - Pie Chart Ppt File Designs. This is a four stage process. The stages in this process are Pie, Process, Percentage, Finance, Business.
-
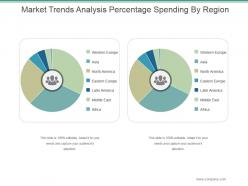 Market trends analysis percentage spending by region powerpoint slide introduction
Presenting market trends analysis percentage spending by region powerpoint slide introduction. This is a market trends analysis percentage spending by region powerpoint slide introduction. This is a two stage process. The stages in this process are western europe, asia, north america, eastern europe, latin america, middle east, africa.
-
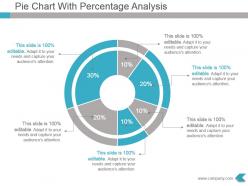 Pie chart with percentage analysis ppt template slide
Presenting pie chart with percentage analysis ppt template slide. This is a pie chart with percentage analysis ppt template slide. This is a six stage process. The stages in this process are pie chart, analysis, process, management, business.
-
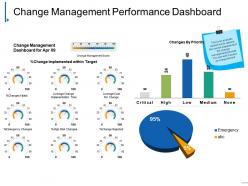 Change management performance dashboard powerpoint slide images
Presenting change management performance dashboard powerpoint slide images. This is a change management performance dashboard powerpoint slide images. This is a two stage process. The stages in this process are critical, high, low, medium, none.
-
 Pie of pie powerpoint slide design templates 1
Presenting this set of slides with name - Pie Of Pie Powerpoint Slide Design Templates 1. This is a two stage process. The stages in this process are Pie, Business, Management, Strategy, Analysis.
-
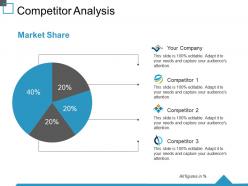 Competitor analysis ppt summary skills
Presenting this set of slides with name - Competitor Analysis Ppt Summary Skills. This is a four stage process. The stages in this process are Market Share, Your Company, Analysis, Business, Marketing.
-
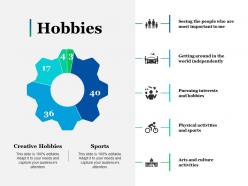 Hobbies ppt pictures slide download
Presenting this set of slides with name - Hobbies Ppt Pictures Slide Download. This is a five stage process. The stages in this process are Business, Management, Strategy, Analysis, Icons.
-
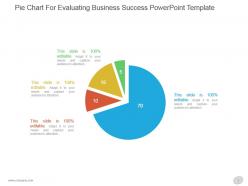 Pie chart for evaluating business success powerpoint template
Presenting pie chart for evaluating business success powerpoint template. This is a pie chart for evaluating business success powerpoint template. This is a four stage process. The stages in this process are marketing, pie, circle, success, business.
-
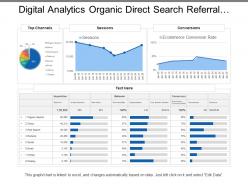 Digital analytics organic direct search referral social
Presenting this set of slides with name - Digital Analytics Organic Direct Search Referral Social. This is a five stage process. The stages in this process are Digital Analytics, Digital Dashboard, Digital Kpis.
-
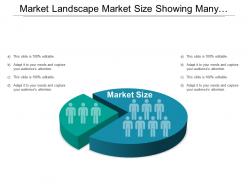 Market landscape market size showing many silhouette segments
Presenting this set of slides with name - Market Landscape Market Size Showing Many Silhouette Segments. This is a two stage process. The stages in this process are Current Landscape, Competitor Landscape, Market Landscape.
-
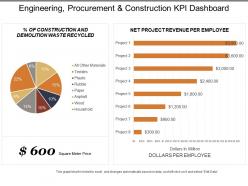 Engineering procurement and construction kpi dashboard showing net project revenue per employee
Presenting this set of slides with name - Engineering Procurement And Construction Kpi Dashboard Showing Net Project Revenue Per Employee. This is a two stage process. The stages in this process are Engineering, Procurement And Construction, Construction Management, Engineering, Purchasing And Construction .
-
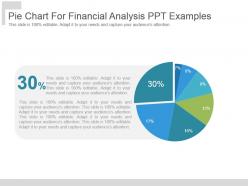 Pie chart for financial analysis ppt examples
Presenting pie chart for financial analysis ppt examples. This is a pie chart for financial analysis ppt examples. This is a seven stage process. The stages in this process are business, marketing, strategy, management, success.
-
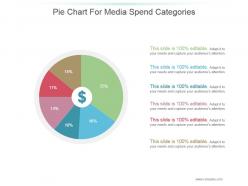 Pie chart for media spend categories presentation portfolio
Presenting pie chart for media spend categories presentation portfolio. This is a pie chart for media spend categories presentation portfolio. This is a six stage process. The stages in this process are business, success, strategy, finance, circular.
-
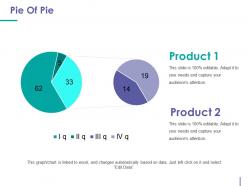 Pie of pie powerpoint templates microsoft
Presenting Pie Of Pie PowerPoint Template Microsoft template. Transform and save this slide in JPG, PNG, PDF, and JPEG formats. You can change everything on this slide. It is compatible with all the major Microsoft versions, and Google Slides as well. Customize the slide as per your wants by changing its colors, font type, and font size. Adjust the size of the clock icon and increase or decrease the number of points. Avail it in standard screen and full-screen size. The slide does not pixelate when viewed in fullscreen.
-
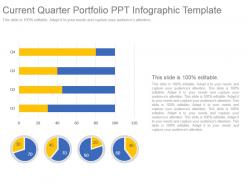 Current quarter portfolio ppt infographic template
Presenting current quarter portfolio ppt infographic template. This is a current quarter portfolio ppt infographic template. This is a four stage process. The stages in this process are pie, finance, business, management, marketing.
-
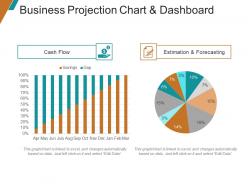 Business projection chart and dashboard ppt samples download
Presenting financial projection graph PPT samples Download which is 100% editable. The inserted features in this PPT are easy with modifications and all the features used in this PowerPoint presentation are compatible with Google Slides, multiple format and software options. This PPT is easy to download in a very short span of time. In case of any assistance, the presenter may refer to presentation designs services being provided along with this PowerPoint presentation. This PPT slide can be saved as JPG or in pdf format.
-
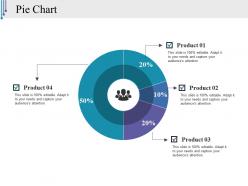 Pie chart ppt styles graphics template
Presenting pie chart PPT styles graphics template PPT slide. The graphical pie chart PowerPoint template designed professionally by the team of SlideTeam for developing different visual representations. The pie chart graphic slide is the data driven slide and the user can edit data as the slide gets linked with the Excel data sheet. The graphical pie chart template is customizable in PowerPoint as well as compatible with Google Slide so a user can share it on internet. You can make changes in the pie chart design template such as font size, font type, color and dimensions to plot cyclic events.
-
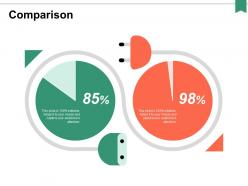 Comparison finance ppt powerpoint presentation portfolio slideshow
Presenting this set of slides with name - Comparison Finance Ppt Powerpoint Presentation Portfolio Slideshow. This is a two stage process. The stages in this process are Finance, Analysis, Business, Investment, Marketing.
-
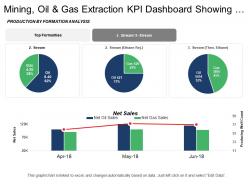 Mining oil and gas extraction kpi dashboard showing net sales and production by formation analysis
Presenting this set of slides with name - Mining Oil And Gas Extraction Kpi Dashboard Showing Net Sales And Production By Formation Analysis. This is a two stage process. The stages in this process are Mining, Oil And Gas Extraction, Refinery, Natural Gas.
-
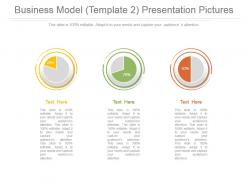 Business model with new market share analysis presentation pictures
Presenting business model with new market share analysis presentation pictures. This is a business model with new market share analysis presentation pictures. This is a three stage process. The stages in this process are percentage, process, business, marketing, strategy, management.
-
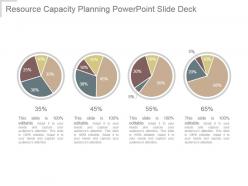 Resource capacity planning powerpoint slide deck
Presenting resource capacity planning powerpoint slide deck. This is a resource capacity planning powerpoint slide deck. This is a four stage process. The stages in this process are pie chart, planning, business, finance, marketing.
-
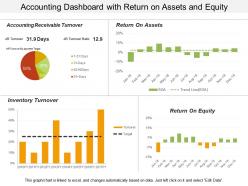 Accounting dashboard with return on assets and equity
Stunning accounting dashboard with return on assets and equity PPT template. Modify and personalize the presentation by including the company name and logo. Guidance for executing the changes has been provided for assistance. Easy and convenient downloading by following simple steps. Professional and business oriented PPT presentation slides. No concession with the quality, once opened on wide screen. Editable visuals, colors and text. Useful for sales leaders, marketers, business professionals, analysts, strategists, etc. Can be used with Google slides.
-
 Business model and revenue model powerpoint shapes
Presenting business model and revenue model powerpoint shapes. This is a business model and revenue model powerpoint shapes. This is a three stage process. The stages in this process are pie, finance, percentage, business, marketing.
-
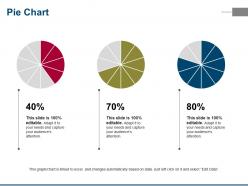 Pie chart powerpoint slide design templates
Presenting this set of slides with name - Pie Chart Powerpoint Slide Design Templates. This is a three stage process. The stages in this process are Pie Chart, Marketing, Analysis, Business, Strategy.
-
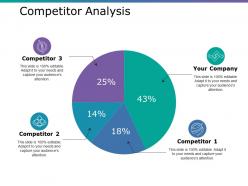 Competitor analysis ppt layouts slide portrait
Presenting this set of slides with name - Competitor Analysis Ppt Layouts Slide Portrait. This is a four stage process. The stages in this process are Your Company, Competitor, Pie Chart, Finance, Percentage.
-
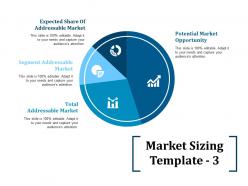 Market sizing ppt file graphics pictures
Presenting this set of slides with name - Market Sizing Ppt File Graphics Pictures. This is a four stage process. The stages in this process are Potential Market Opportunity, Total Addressable Market, Segment Addressable Market.
-
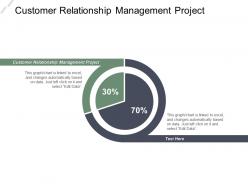 Customer relationship management project ppt powerpoint presentation infographic template picture cpb
Presenting this set of slides with name - Customer Relationship Management Project Ppt Powerpoint Presentation Infographic Template Picture Cpb. This is an editable two stages graphic that deals with topics like Customer Relationship Management Project to help convey your message better graphically. This product is a premium product available for immediate download, and is 100 percent editable in Powerpoint. Download this now and use it in your presentations to impress your audience.
-
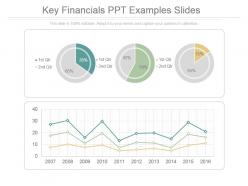 Key financials ppt examples slides
Presenting key financials ppt examples slides. This is a key financials ppt examples slides. This is a three stage process. The stages in this process are business, pie chart, finance, marketing, strategy, success.
-
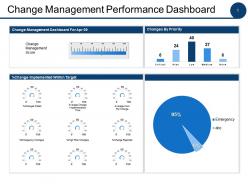 Change management performance dashboard ppt powerpoint presentation file layouts
This is a stages process. The stages in this process are.
-
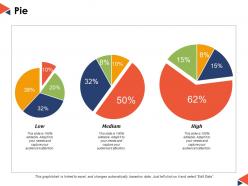 Pie finance ppt powerpoint presentation file outline
This is a three stages process. The stages in this process are Pie Chart, Finance, Business, Analysis, Management.


