Data Driven Sliding Bars and and other powerpoint diagrams and templates
- Sub Categories
-
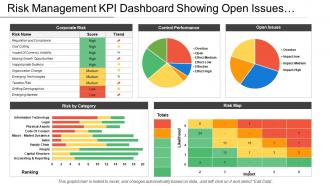 Risk Management Kpi Dashboard Showing Open Issues And Control Performance
Presenting this set of slides with name - Risk Management Kpi Dashboard Showing Open Issues And Control Performance. This is a five stage process. The stages in this process are Risk Management, Risk Assessment, Project Risk.
-
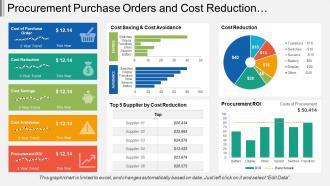 Procurement Purchase Orders And Cost Reduction Dashboard
Presenting this set of slides with name - Procurement Purchase Orders And Cost Reduction Dashboard. This is a five stage process. The stages in this process are Purchase, Procurement, Buy.
-
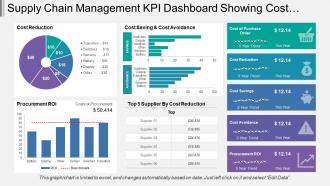 Supply Chain Management Kpi Dashboard Showing Cost Reduction And Procurement Roi
Presenting this set of slides with name - Supply Chain Management Kpi Dashboard Showing Cost Reduction And Procurement Roi. This is a five stage process. The stages in this process are Demand Forecasting, Predicting Future Demand, Supply Chain Management.
-
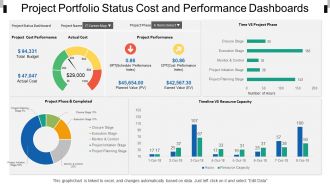 Project portfolio status cost and performance dashboards snapshot
Presenting, project portfolio status cost and performance dashboards snapshot. This is an appealing design for project portfolio status cost and performance focused PowerPoint presentation. This PPT template can be used by experts from various backgrounds to present their ideas in a contemporary way. This slide is cooperative with google slides and after downloading you can use it in full version and insert your company's logo for your best practice. Unique thinking to mesmerize your audience. Fully editable PowerPoint colors, orientation, text, and graphics.
-
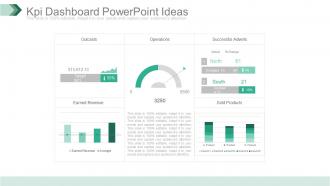 Kpi Dashboard Snapshot Powerpoint Ideas
Fabulously composed PPT design useful for business professionals, organizational experts or researchers , students and many more from diverse areas , Comprehensive and convenient PPT Images with ductile dummy data options, Consonant with all available graphic software’s and Google slides, Accessible to other file configurations like PDF or JPG. Multi-color options, background images, styles and other characteristics are fully editable, Expeditious downloading process, Allows to introduce your company logo or brand name in the PPT slides.
-
 Key Human Resource Metrics Dashboard Snapshot Ppt Slide
Presenting key human resource metrics dashboard snapshot ppt slide. This is a key human resource metrics dashboard ppt slide. This is a four stage process. The stages in this process are key health metrics, previous 4 quarters, change year over year, voluntary, turnover rate, involuntary, q, registration rate, manager instability rate, top talent turnover rate, top 3 potential areas of concern, for smb services in vancouver, for products in u k, for human resources in denver, key health metrics, previous 4 quarters, change year over year, flow through rate, headcount flow, out, in, span of control, direct compensation change.
-
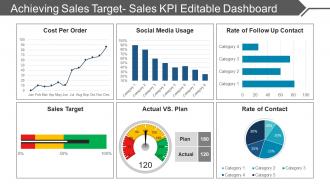 Achieving Sales Target Sales Kpi Editable Dashboard Snapshot Ppt Diagrams
Presenting achieving sales target sales kpi editable dashboard PPT diagrams. Simple data input like company logo, name or trademark. This PowerPoint theme is fully supported by Google slides. Picture quality of these slides does not change even when projected on large screen. Fast downloading speed and formats can be easily changed to JPEG and PDF applications. This template is suitable for marketing, sales persons, business managers and entrepreneurs. Adjust PPT layout, font, text and color as per your necessity.
-
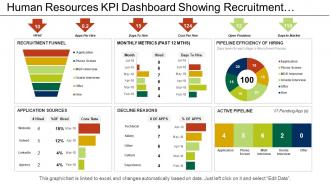 Human resources kpi dashboard showing recruitment funnel application sources
Presenting this set of slides with name - Human Resources Kpi Dashboard Showing Recruitment Funnel Application Sources. This is a six stage process. The stages in this process are Human Resource, Hrm, Human Capital.
-
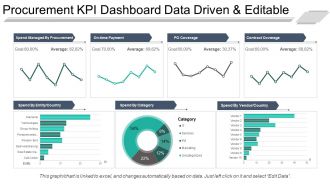 Procurement kpi dashboard snapshot data driven and editable ppt sample file
Presenting procurement kpi dashboard snapshot data driven and editable ppt sample file. This is a procurement kpi dashboard data driven and editable ppt sample file. This is a seven stage process. The stages in this process are business, strategy, growth, finance, chart and graph.
-
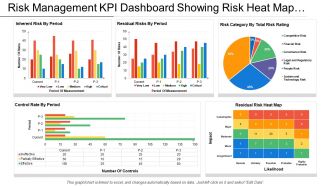 Risk Management Kpi Dashboard Showing Risk Heat Map And Control Rate By
Presenting this set of slides with name - Risk Management Kpi Dashboard Showing Risk Heat Map And Control Rate By Period. This is a five stage process. The stages in this process are Risk Management, Risk Assessment, Project Risk.
-
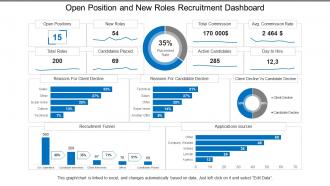 Open position and new roles recruitment dashboard
Presenting this set of slides with name - Open Position And New Roles Recruitment Dashboard. This is a three stage process. The stages in this process are Staffing Plan, Recruitment, Staff Management.
-
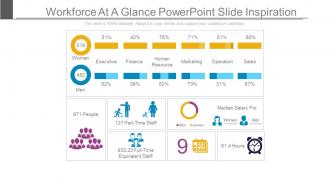 Workforce at a glance powerpoint slide inspiration
Presenting workforce at a glance powerpoint slide inspiration. This is a workforce at a glance powerpoint slide inspiration. This is a two stage process. The stages in this process are women, executive, finance, human resource, marketing, operation, sales, median salary for,part time staff,full time equivalent staff.
-
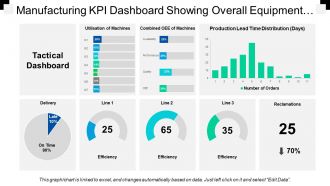 Manufacturing kpi dashboard showing overall equipment effectiveness
Presenting this set of slides with name - Manufacturing Kpi Dashboard Showing Overall Equipment Effectiveness. This is a eight stage process. The stages in this process are Manufacturing, Production, Manufacture.
-
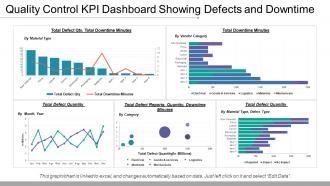 Quality control kpi dashboard showing defects and downtime
Presenting this set of slides with name - Quality Control Kpi Dashboard Showing Defects And Downtime. This is a five stage process. The stages in this process are Quality Management, Quality Control, Quality Assurance.
-
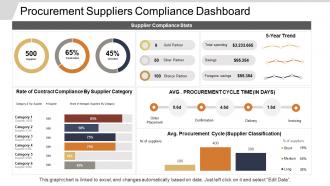 Procurement suppliers compliance dashboard
Presenting this set of slides with name - Procurement Suppliers Compliance Dashboard. This is a four stage process. The stages in this process are Purchase, Procurement, Buy.
-
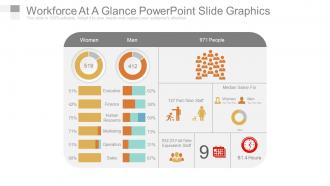 Workforce at a glance powerpoint slide graphics
Presenting this workforce analysis and planning PowerPoint presentation slide. The PPT slide is available in both widescreen size (16:9) and standard screen size (4:3). This template has been designed by our team of qualified designers and is editable in PowerPoint. You can change the font type, font size, font style, icons and background color of the slide as per your requirement. It is convenient to insert your company name and logo in the slide. You can remove the sample content in text placeholders and add your presentation’s content. The slide is fully compatible with Google slides and can be saved in JPG or PDF format easily. High resolution graphic image ensures that there is no deterioration in quality on enlarging the size of the image. You can download the slide quickly at the click of a button.
-
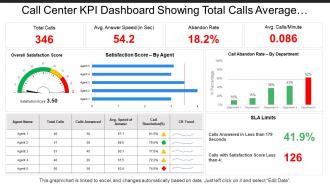 Call center kpi dashboard showing total calls average answer speed abandon rate
Presenting this set of slides with name - Call Center Kpi Dashboard Showing Total Calls Average Answer Speed Abandon Rate. This is a five stage process. The stages in this process are Call Center Agent, Customer Care, Client Support.
-
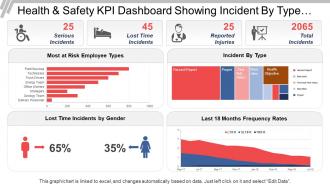 Health and safety kpi dashboard showing incident by type and frequency rates
Presenting the dashboard presentation slide. This KPI dashboard is fully editable and is designed by professionals looking for professional presentation design. You can edit the objects in the slide like font size and font color easily. This presentation slide is fully compatible with Google Slide and can be saved in JPG or PDF file format without any hassle. Click on the download button below.
-
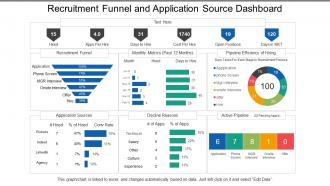 Recruitment funnel and application source dashboard
Presenting this set of slides with name - Recruitment Funnel And Application Source Dashboard. This is a three stage process. The stages in this process are Staffing Plan, Recruitment, Staff Management.
-
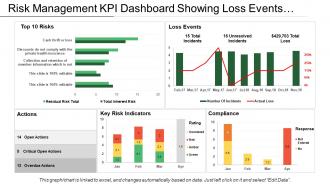 Risk management kpi dashboard showing loss events actions and compliance
Presenting this set of slides with name - Risk Management Kpi Dashboard Showing Loss Events Actions And Compliance. This is a four stage process. The stages in this process are Risk Management, Risk Assessment, Project Risk.
-
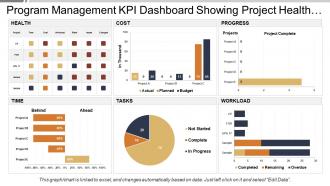 Program management kpi dashboard showing project health and progress
Presenting this set of slides with name - Program Management Kpi Dashboard Showing Project Health And Progress. This is a six stage process. The stages in this process are Program Development, Human Resource Management, Program Management.
-
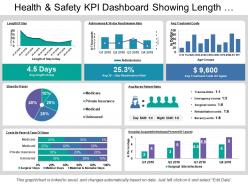 Health and safety kpi dashboard showing length of stay and treatment costs
Presenting this set of slides with name - Health And Safety Kpi Dashboard Showing Length Of Stay And Treatment Costs. This is a seven stage process. The stages in this process are Health And Safety, Health And Security, Health And Protection.
-
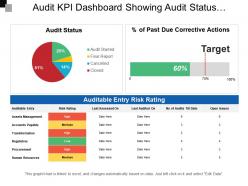 Audit kpi dashboard showing audit status auditable entry risk rating
Presenting this set of slides with name - Audit Kpi Dashboard Showing Audit Status Auditable Entry Risk Rating. This is a four stage process. The stages in this process are Audit, Examine, Survey.
-
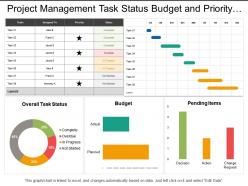 Project management task status budget and priority dashboard
Stunning project management task status budget and priority dashboard PowerPoint template. Choice to display PowerPoint template in standard and widescreen view. Presentation designs are well-suited with Google slides or MS Office PowerPoint programs. Can be transformed into JPG and PDF format. Trouble-free replacement of your company’s logo. Access to open on a big screen display. Perfect for business professionals, managers and industry leaders. Trustworthy and accurate PowerPoint slide show. Customize the fonts, colors, layout, etc.as per your requirements and business needs.
-
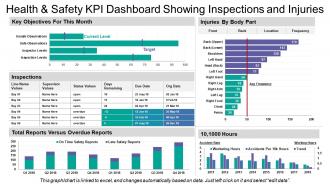 Health and safety kpi dashboard showing inspections and injuries
Presenting this set of slides with name - Health And Safety Kpi Dashboard Showing Inspections And Injuries. This is a five stage process. The stages in this process are Health And Safety, Health And Security, Health And Protection.
-
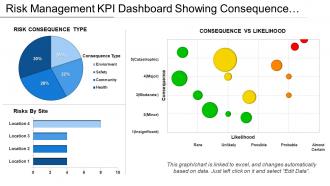 Risk Management Kpi Dashboard Showing Consequence Vs Likelihood
Presenting this set of slides with name - Risk Management Kpi Dashboard Showing Consequence Vs Likelihood. This is a three stage process. The stages in this process are Risk Management, Risk Assessment, Project Risk.
-
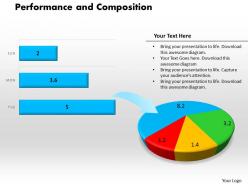 0414 performance and composition bar pie chart powerpoint graph
High resolution visuals. Ease of download. Compatible with numerous format options. Compatible with multiple online and offline software options. Thoroughly editable slide design background. Ease of inclusion and exclusion of slide content as per the need of an hour. Freedom to include the company specific name, logo and trademark, so as to personalize the presentation. Used by business professionals, finance students, marketing students, and teachers.
-
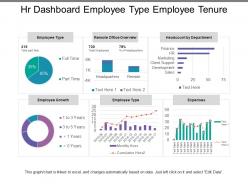 Hr dashboard employee type employee tenure
Presenting this set of slides with name - Hr Dashboard Employee Type Employee Tenure. This is a six stage process. The stages in this process are Hr Dashboard, Human Resource Dashboard, Hr Kpi.
-
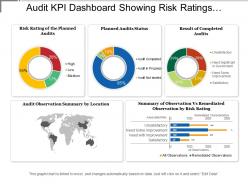 Audit kpi dashboard showing risk ratings planned audit status
Presenting this set of slides with name - Audit Kpi Dashboard Showing Risk Ratings Planned Audit Status. This is a five stage process. The stages in this process are Audit, Examine, Survey.
-
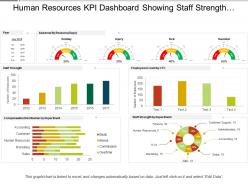 Human resources kpi dashboard showing staff strength compensation distribution
SlideTeam presenting Human Resources Kpi Dashboard Showing Staff Strength Compensation Distribution PPT. It will not only help you in knowing the exact strength of the staff but also about actual staff required in the organization. This slideshow is entirely editable and you can edit it whenever you want. All the slides in this presentation are compatible with Google slides. You can enter thousands of relatable icons of your own choice. You can also change from 4:3 standard screen size to 16:9 widescreen size.
-
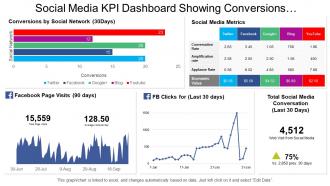 Social media kpi dashboard showing conversions by social network and metrics
Presenting this set of slides with name - Social Media Kpi Dashboard Showing Conversions By Social Network And Metrics. This is a five stage process. The stages in this process are Social Media, Digital Marketing, Social Marketing.
-
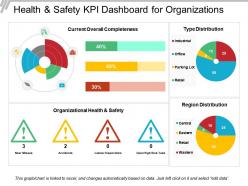 Health and safety kpi dashboard for organizations
Presenting this set of slides with name - Health And Safety Kpi Dashboard For Organizations. This is a four stage process. The stages in this process are Health And Safety, Health And Security, Health And Protection.
-
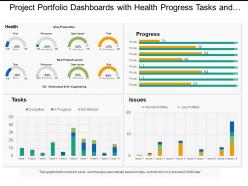 Project portfolio dashboards snapshot with health progress tasks and issues
Presenting, project portfolio dashboards snapshot with health progress tasks and issues. This PPT Template can be used by specialists for designing their project portfolio dashboards and health progress matters for data analysis. You can change the color of the components shown in the figure and also edit the text to write a short brief about your company's financial affairs. This PowerPoint template is also compatible with google slides and can be projected to a widescreen for business meetings without pixelating.
-
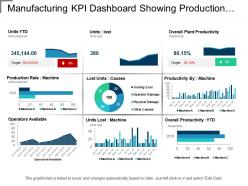 Manufacturing kpi dashboard showing production rate and lost units
Presenting manufacturing KPI dashboard showing production rate and lost units. This layout is compatible with Google slides and data can be updated with excel linked file. Easy to put in company logo, trademark or name; accommodate words to support the key points. Images do no blur out even when they are projected on large screen.PPT template can be utilized by sales and marketing teams and business managers. Instantly downloadable slide and supports formats like JPEG and PDF.
-
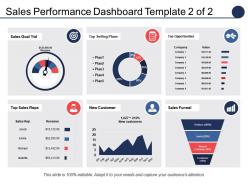 Sales Performance Dashboard Top Selling Plans Top Opportunities
Presenting sales performance dashboard top selling plans top opportunities PPT template. Completely amendable by any user at any point of time without any hassles. Error free performance to put an everlasting impression on the viewers. Great for incorporating business details such as name, logo and trademark. Can be utilized by students, entrepreneurs, investors and customers. Professionally designed presentation slides. Personalize the presentation with individual company name and logo. Available in both Standard and Widescreen slide size.
-
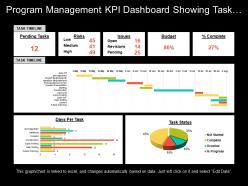 Program management kpi dashboard showing task timeline risks and budget
Presenting Program Management KPI Dashboard Showing Task Timeline Risks And Budget PPT slide. The task timeline dashboard PowerPoint template designed professionally by the team of SlideTeam to present the values over time. The different icons such as pie chart, line chart, as well as other figures and text in the Graphical Chart KPI dashboard slide are customizable in PowerPoint. A user can illustrate the desired numerical information because the graphical management dashboard template gets linked with Excel Sheet. The management dashboard slide is compatible with Google Slide. You may edit the font size, font type, color and dimensions of the different chart to present the desired numerical information.
-
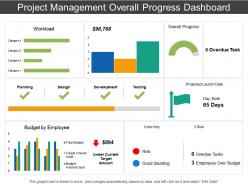 Project management overall progress dashboard
Preference to amend and personalize the PPT slide by adding business details i.e. name, logo, image or even tag line. Quick download and can be shared with large audience. Staggering balance colors, font and shape. Comparable Presentation design comes with different nodes and stages. Familiar with Google slides and easy to alter into JPEG and PDF.PPT diagram can be shared in both standard and widescreen view depending upon your requirement. High resolution and tremendous quality PowerPoint template
-
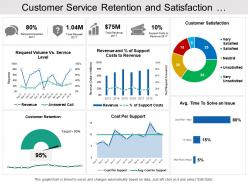 Customer service retention and satisfaction dashboard
Presenting this set of slides with name - Customer Service Retention And Satisfaction Dashboard. This is a six stage process. The stages in this process are Customer Base, Recurring Customers, Customer Services.
-
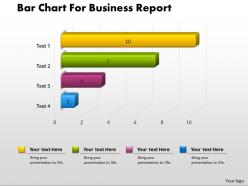 0414 bar chart for business report powerpoint graph
Edit and modify it the way you want to. Replace the icons images and enter the content in the provided text spaces. Download and save instantly. Use your brand’s name at the place of watermark and make it your own slide template. No effect on picture quality when opened on a big screen. Beneficial for the Business presenters and marketing professionals.
-
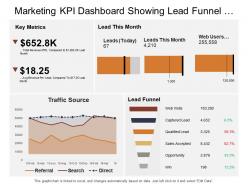 Marketing kpi dashboard snapshot showing lead funnel traffic sources key metrics
Presenting this set of slides with name - Marketing Kpi Dashboard Snapshot Showing Lead Funnel Traffic Sources Key Metrics. This is a three stage process. The stages in this process are Marketing, Branding, Promoting.
-
 Human resources kpi dashboard showing employee number by salary staff composition
Presenting this set of slides with name - Human Resources Kpi Dashboard Showing Employee Number By Salary Staff Composition. This is a four stage process. The stages in this process are Human Resource, Hrm, Human Capital.
-
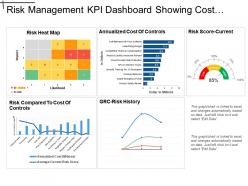 Risk Management Kpi Dashboard Showing Cost Of Control And Risk Score
Presenting this set of slides with name - Risk Management Kpi Dashboard Showing Cost Of Control And Risk Score. This is a five stage process. The stages in this process are Risk Management, Risk Assessment, Project Risk.
-
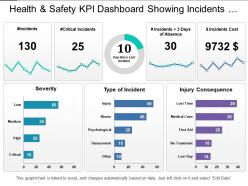 Health and safety kpi dashboard showing incidents severity and consequences
Presenting the health and safety PPT slide. This PPT slide is fully editable and is designed by professionals looking for a professional presentation. You can edit the objects in the slide like font size and font color easily. This presentation slide is fully compatible with Google Slide and can be saved in JPG or PDF file format easily. Click on the download button below.
-
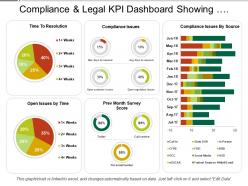 Compliance and legal kpi dashboard showing compliance issues and resolution time
Presenting this set of slides with name - Compliance And Legal Kpi Dashboard Showing Compliance Issues And Resolution Time. This is a three stage process. The stages in this process are Compliance And Legal, Legal Governance, Risk Management.
-
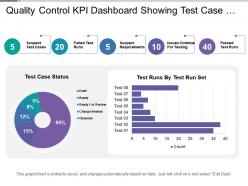 Quality control kpi dashboard showing test case status
Presenting this set of slides with name - Quality Control Kpi Dashboard Showing Test Case Status. This is a two stage process. The stages in this process are Quality Management, Quality Control, Quality Assurance.
-
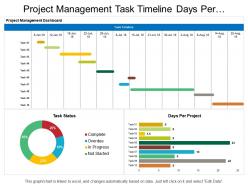 Project management task timeline days per project dashboard
Introducing project management task timeline days per project dashboard PPT template. Access to convert the presentation design into JPG and PDF. Offer 100% access to change the values, size and style of the slides once downloaded and saved in the desired format. High quality charts, images and visuals used in the designing process. Choice to get presentation slide in standard or in widescreen view. Easy to convert in JPEG and PDF document. Compatible with Google slides. Easy and hassle-free downloading process.
-
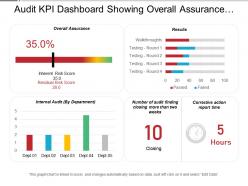 Audit kpi dashboard showing overall assurance internal audit and results
Presenting audit kpi dashboard showing overall assurance internal audit and results presentation slide. The PPT layout is extremely easy to understand as it enables you to roll out various improvements to the editable slides. You can change the text dimension, textual style and furthermore the textual style shading according to your prerequisites. Layout slide can be downloaded rapidly and taxi be spared in configuration of PDF or JPG effectively. The format slide in the wake of being downloaded can be seen in extensive screen show proportion of 16:9 or standard size presentation proportion of 4:3.
-
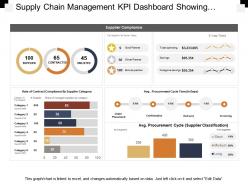 Supply chain management kpi dashboard showing supplier compliance stats
Presenting this set of slides with name - Supply Chain Management Kpi Dashboard Showing Supplier Compliance Stats. This is a four stage process. The stages in this process are Demand Forecasting, Predicting Future Demand, Supply Chain Management.
-
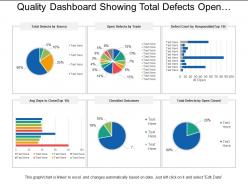 Quality dashboard showing total defects open defects checklist outcome
SlideTeam brings to you its totally editable and user-friendly quality dashboard showing total defects checklist outcome. This set of predesigned slides has been designed in such a manner that you can change the font style, font color and font size, etc. of the text used in the slides. After you download the PPT it can be viewed in standard size display ratio of 4:3 or widescreen display ratio of 16:9. The business template is very easy to use as it is compatible with Google Slides.
-
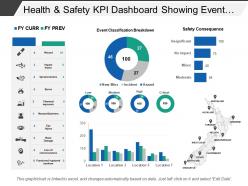 Health and safety kpi dashboard showing event classification breakdown
Presenting the modern dashboard PPT template. This dashboard PPT design is 100% editable and is created by professionals. You can bring changes to the objects in the template like font size and font color very easily. This presentation slide is fully compatible with Google Slide and can be saved in JPG or PDF file format without any hassle. Fast download this at the click of the button.
-
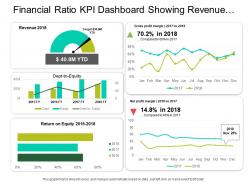 Financial ratio kpi dashboard showing revenue net profit margin and debt to equity
Presenting this set of slides with name - Financial Ratio Kpi Dashboard Showing Revenue Net Profit Margin And Debt To Equity. This is a five stage process. The stages in this process are Accounting Ratio, Financial Statement, Financial Ratio.
-
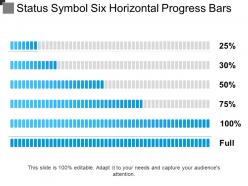 Status symbol six horizontal progress bars
Presenting status symbol six horizontal progress bars. This is a status symbol six horizontal progress bars. This is a six stage process. The stages in this process are status symbol, status icon.
-
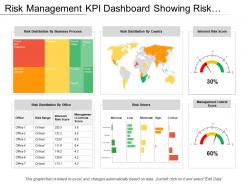 Risk Management Kpi Dashboard Showing Risk Distribution By Country Office
Presenting this set of slides with name - Risk Management Kpi Dashboard Showing Risk Distribution By Country Office And Business Process. This is a six stage process. The stages in this process are Risk Management, Risk Assessment, Project Risk.
-
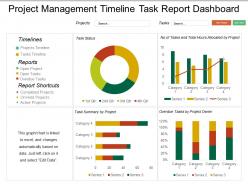 Project management timeline task report dashboard snapshot
Introducing project management timeline task report dashboard snapshot PPT template. An easy access to make the desired changes or edit it anyways. Wide screen view of the slides. Easy conversion into Jpeg or Pdf format. The PPT images offer compatibility with Google Slides. High resolution icons for clear message delivery. Unique and informational content. Valuable for business professionals, sales representatives, marketing professionals, students and selling investigators. High quality charts and visuals used in the designing process. They enhance the performance of the presentation.
-
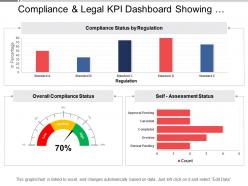 Compliance and legal kpi dashboard showing overall compliance status
Presenting this set of slides with name - Compliance And Legal Kpi Dashboard Showing Overall Compliance Status. This is a three stage process. The stages in this process are Compliance And Legal, Legal Governance, Risk Management.
-
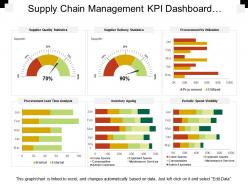 Supply chain management kpi dashboard showing procurement vs utilization
Presenting this set of slides with name - Supply Chain Management Kpi Dashboard Showing Procurement Vs Utilization. This is a six stage process. The stages in this process are Demand Forecasting, Predicting Future Demand, Supply Chain Management.
-
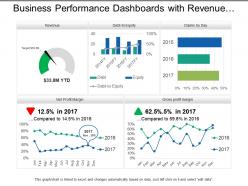 Business performance dashboards with revenue and ratios
Presenting, our business performance dashboards with revenue and ratios PPT deck. Pre-designed chart sheet directed PowerPoint Presentation template. Administration of high-resolution images, graphs, and comparison diagrams. Filled with methods and effects to create an impact. Can be quickly converted into JPEG/JPG or PDF formats as per the requirements. Congenial with Google Slides for ease. Project to widescreen without cringing about pixelating, after downloading explore these characteristics.
-
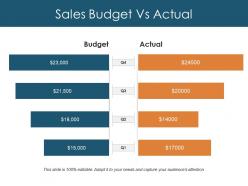 Sales budget vs actual ppt design templates
Presenting this set of slides with name - Sales Budget Vs Actual Ppt Design Templates. This is a four stage process. The stages in this process are Business, Budget, Actual, Marketing, Graph.
-
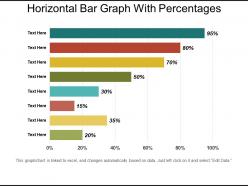 Horizontal bar graph with percentages
Presenting Horizontal Bar Graph With Percentages PowerPoint slide. This PowerPoint slide is completely editable so you can modify, font type, font color, shape and image according to your requirements. This Google Slides compatible PPT is available in 4:3 and 16:9 aspect ratios. Easy to download PPT layout and can be saved in different formats like JPG, PDF, and PNG.
-
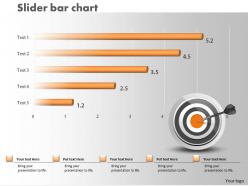 0414 slider bar chart with target powerpoint graph
We are proud to present our 0414 slider bar chart with target powerpoint graph. Our Slider Bar Chart With Target Powerpoint Graph Powerpoint Templates come in all colours shades and hues. They help highlight every nuance of your views. Our Slider Bar Chart With Target Powerpoint Graph Powerpoint Templates will fulfill your every need. Use them and effectively satisfy the desires of your audience.


