- Sub Categories
-
 Financials what are we expecting powerpoint themes
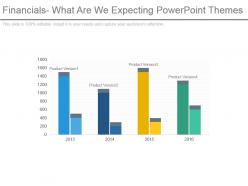
Presenting financials what are we expecting powerpoint themes. This is a financials what are we expecting powerpoint themes. This is a four stage process. The stages in this process are product version, business, marketing, financials, success.
-
 Mean earnings of the population in us by sex for 2013-2022
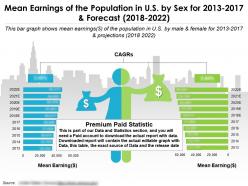
Presenting this set of slides with name - Mean Earnings Of The Population In Us By Sex For 2013-2022. Mean Earnings of the Population in U.S. by Sex for 2013 to 2017 and Forecast 2018 to 2022. This is part of our Data and Statistics products selection, and you will need a Paid account to download the actual report with accurate data. Downloaded report will contain the actual editable graph with the actual data, an excel table with the actual data, the exact source of the data and the release date. This bar graph shows mean earnings dollar of the population in U.S. by male and female for 2013 to 2017 and projections 2018 to 2022. It covers topic Mean Earnings by Sex for region USA and is for date range 2013 to 2022. Download it immediately and use it for your business.
-
 Earnings per share powerpoint slide information
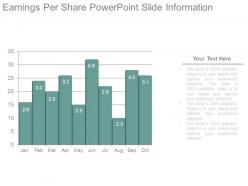
Presenting earnings per share powerpoint slide information. This is a earnings per share powerpoint slide information. This is a ten stage process. The stages in this process are business, growth, strategy, management, success.
-
 Employee engagement initiatives powerpoint images
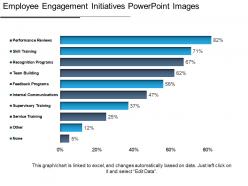
Presenting employee engagement initiatives PowerPoint Images. Change PPT slide arrangement, font, text, color and design as per your requirements. This slideshow allows you easy data entry options to put in company logo, brand or name .Ideal for marketing professionals, business managers, entrepreneurs and big organizations to present ideas. This presentation theme is totally in sync with Google Slides. Easy conversion to other software’s like JPG and PDF formats. Image quality remains the unchanged even when resize the image or portray on large screens.
-
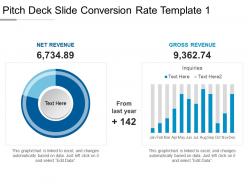 Pitch deck slide conversion rate template 1 ppt slides
Presenting Pitch Deck Slide Conversion Rate Template 1 PPT Slides. Customize the slide as per your choice. The template is entirely under your control. Change the position of the icon and modify the colors, background, font type, and font size. Save it in JPG and PDF file formats. Its compatibility with the Google Slides makes it easily accessible. Avail it in standard screen and widescreen size.
-
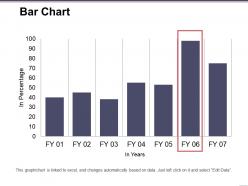 Bar chart sample ppt files
Presenting Bar Chart Sample PPT Files . This slide is completely customizable and you can make any kind of changes as per your requirements. Change the colors of this slide and make alterations in the font size and font type. We offer you high-resolution images that do not hamper the quality when viewed on widescreen. You can also download this in the standard screen. This is fully adaptable to Google Slides. Download this now in JPG and PDF formats. Add your own text in the text placeholders.
-
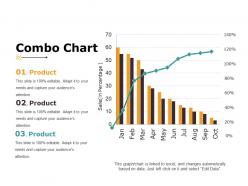 Combo chart presentation portfolio
Presenting combo chart presentation portfolio. This is a combo chart presentation portfolio. This is a ten stage process. The stages in this process are business, marketing, product, sales in percentage, percentage.
-
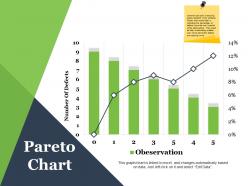 Pareto chart powerpoint slide images
Presenting pareto chart powerpoint slide images. This is a pareto chart powerpoint slide images. This is a seven stage process. The stages in this process are number of defects, observation, graph, finance, business.
-
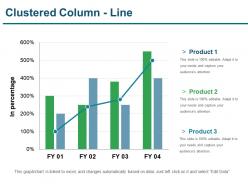 Clustered column line presentation portfolio
Presenting clustered column line presentation portfolio. This is a clustered column line presentation portfolio . This is a four stage process. The stages in this process are financial, clustered column line, analysis, strategy, business.
-
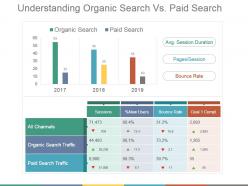 Understanding organic search vs paid search powerpoint topics
Presenting to you the organic vs. paid search PowerPoint template. This slide is fully customizable PowerPoint template to communicate your ideas clearly. You can easily edit the charts and graphs in excel sheet. This presentation slide is designed with elegant shapes and visuals. You can convert this slide into numerous format options like JPEG, JPG or PDF. This template is compatible with Google slides. It is easy to customize each graphics and text as per your need. You can download it easily at a click of a button.
-
 Drill down country wise breakdown having bar graph and pie chart
Presenting this set of slides with name - Drill Down Country Wise Breakdown Having Bar Graph And Pie Chart. This is a three stage process. The stages in this process are Drill Down, Hierarchy, Top Downwards.
-
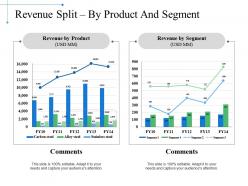 Revenue split by product and segment ppt slide template
Presenting this set of slides with name - Revenue Split By Product And Segment Ppt Slide Template. This is a two stage process. The stages in this process are Business, Marketing, Finance, Planning, Analysis.
-
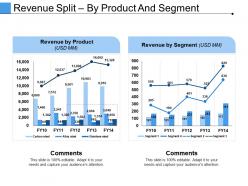 Revenue split by product and segment ppt examples slides
Presenting this set of slides with name - Revenue Split By Product And Segment Ppt Examples Slides. This is a two stage process. The stages in this process are Finance, Marketing, Bar, Planning, Growth.
-
 P and l kpis ppt styles layout
Presenting this set of slides with name - P And L Kpis Ppt Styles Layout. This is a four stage process. The stages in this process are Revenue, Cogs, Operating Profit, Net Profit.
-
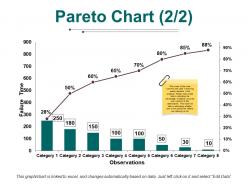 Pareto chart ppt pictures file formats
Presenting Pareto chart PPT pictures file formats PPT slide. The Pareto graph picture style PowerPoint slide designed by the professional team of SlideTeam is useful for illustrating the count of failures. The Pareto chart file style template is the data driven template and you can edit the value as the file style slide gets linked with the Excel sheet. The graphical Pareto chart picture style slide is customizable in PowerPoint as well as compatible with Google Slide. A presenter can modify the visual Pareto chart file format template such as font size, font type, color and dimensions of the charts.
-
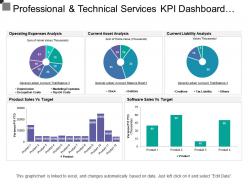 Professional and technical services kpi dashboard showing current asset and liabilities
Presenting this set of slides with name - Professional And Technical Services Kpi Dashboard Showing Current Asset And Liabilities. This is a five stage process. The stages in this process are Professional And Technical Services, Services Management, Technical Management.
-
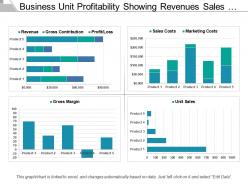 Business unit profitability showing revenues sales costs unit sales
Presenting this set of slides with name - Business Unit Profitability Showing Revenues Sales Costs Unit Sales. This is a four stage process. The stages in this process are Business Unit Profitability, Profitable Organization, Corporate Unit Profitability.
-
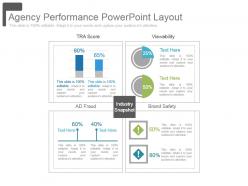 Agency performance powerpoint layout
Presenting agency performance powerpoint layout. This is a agency performance powerpoint layout. This is a four stage process. The stages in this process are tra score, ad fraud, viewability, brand safety, industry snapshot.
-
 Market trends analysis powerpoint slide design templates
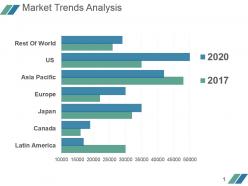
Presenting market trends analysis powerpoint slide design templates. This is a market trends analysis powerpoint slide design templates. This is a seven stage process. The stages in this process are rest of word, us, asia pacific, europe, japan, canada, latin america.
-
 Graphical representation for total business revenue presentation layout
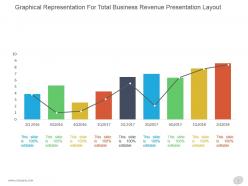
Presenting graphical representation for total business revenue presentation layout. This is a graphical representation for total business revenue presentation layout. This is a nine stage process. The stages in this process are graph, success, business, marketing, growth, management.
-
 Real estate mortgage rates ppt design templates
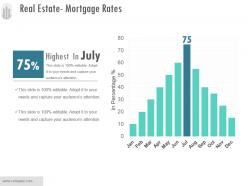
Presenting real estate mortgage rates ppt design templates. This is a real estate mortgage rates ppt design templates. This is a twelve stage process. The stages in this process are business, marketing, percentage, management, graph.
-
 Vertical bar graph of manpower supply covering figure of recruitment across different departments
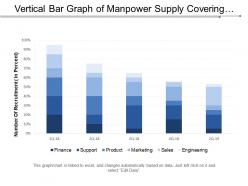
Presenting this set of slides with name - Vertical Bar Graph Of Manpower Supply Covering Figure Of Recruitment Across Different Departments. This is a five stage process. The stages in this process are Manpower Supply, Manpower Service, Manpower Recruitment.
-
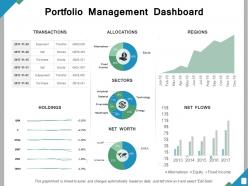 Portfolio management dashboard ppt powerpoint presentation file guide
Presenting this set of slides with name - Portfolio Management Dashboard Ppt Powerpoint Presentation File Guide. This is a five stage process. The stages in this process are Percentage, Product, Management, Marketing, Business.
-
 Selected economic characteristics for the families in the us from 2015-17
Presenting this set of slides with name - Selected Economic Characteristics For The Families In The US From 2015-17. Selected Economic Characteristics For The Families In The U.S From 2015 to 17. This is part of our Data and Statistics products selection, and you will need a Paid account to download the actual report with accurate data. Downloaded report will contain the actual editable graph with the actual data, an excel table with the actual data, the exact source of the data and the release date. This graph shows the selected economic characteristics for the families categorized by income and benefits inflation adjusted dollars as from less than dollar10,000 to dollar200,000 or more etc. in the U.S from the years 2015 to 17. It covers topic Selected economic characteristics for the families by income and benefits for region USA and is for date range 2015 to 17. Download it immediately and use it for your business.
-
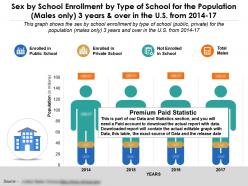 Sex by school enrollment by type of school population males only 3 years in us 2014-17
Presenting this set of slides with name - Sex By School Enrollment By Type Of School Population Males Only 3 Years In US 2014-17. Sex By School Enrollment By Type Of School For The Population Males Only 3 Years And Over In The U.S From 2014 TO 17. This is part of our Data and Statistics products selection, and you will need a Paid account to download the actual report with accurate data. Downloaded report will contain the actual editable graph with the actual data, an excel table with the actual data, the exact source of the data and the release date. This graph shows the sex by school enrollment by type of school public, private for the population males only 3 years and over in the U.S from 2014 TO 17. It covers topic School Enrollment for the population 3 years and over for males for region USA and is for date range 2014 TO 17. Download it immediately and use it for your business.
-
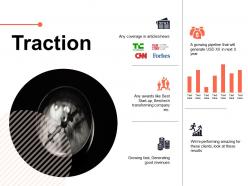 Traction business ppt powerpoint presentation visual aids files
Presenting this set of slides with name - Traction Business Ppt Powerpoint Presentation Visual Aids Files. This is a five stage process. The stages in this process are Business, Planning, Strategy, Marketing, Management.
-
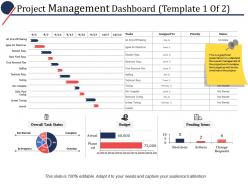 Project management dashboard ppt powerpoint presentation file example introduction
Presenting this set of slides with name - Project Management Dashboard Ppt Powerpoint Presentation File Example Introduction. This is a three stage process. The stages in this process are Business, Management, Marketing, Percentage, Product.
-
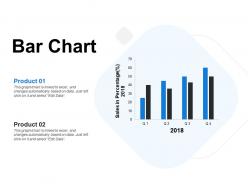 Bar chart marketing ppt powerpoint presentation model
Presenting this set of slides with name - Bar Chart Marketing Ppt Powerpoint Presentation Model. This is a two stage process. The stages in this process are Finance, Analysis, Business, Investment, Marketing.
-
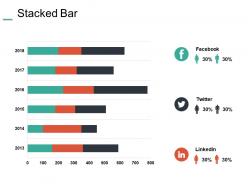 Stacked bar finance ppt summary example introduction
Presenting this set of slides with name - Stacked Bar Finance Ppt Summary Example Introduction. This is a three stage process. The stages in this process are Finance, Analysis, Business, Investment, Marketing.
-
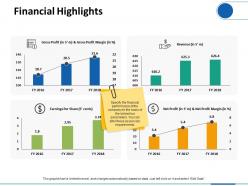 Financial highlights finance ppt visual aids infographic template
Presenting this set of slides with name - Financial Highlights Finance Ppt Visual Aids Infographic Template. This is a four stage process. The stages in this process are Finance, Analysis, Business, Investment, Marketing.
-
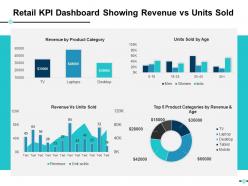 Retail kpi dashboard showing revenue vs units sold ppt slides example file
Presenting this set of slides with name - Retail Kpi Dashboard Showing Revenue Vs Units Sold Ppt Slides Example File. This is a four stage process. The stages in this process are Business, Management, Strategy, Analysis, Marketing.
-
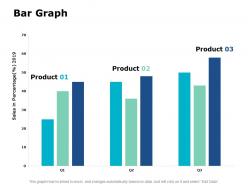 Bar graph ppt powerpoint presentation model professional
Presenting this set of slides with name - Bar Graph Ppt Powerpoint Presentation Model Professional. This is a three stage process. The stages in this process are Business, Management, Strategy, Analysis, Marketing.
-
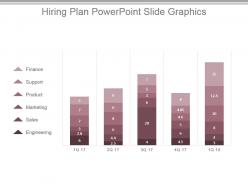 Hiring plan powerpoint slide graphics
Presenting hiring plan powerpoint slide graphics. Presenting hiring plan powerpoint slide graphics. Presenting hiring plan powerpoint slide graphics. This is a hiring plan powerpoint slide graphics. This is five stage process. The stages in this process are finance, support, product, marketing, sales, engineering.
-
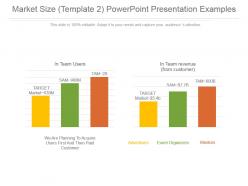 Market size and customer revenue analysis powerpoint presentation examples
Presenting market size and customer revenue analysis powerpoint presentation examples. This is a market size and customer revenue analysis powerpoint presentation examples. This is a six stage process. The stages in this process are in team users, in team revenue, from customer, we are planning to acquire users first and then paid customer, advertisers, event organizers.
-
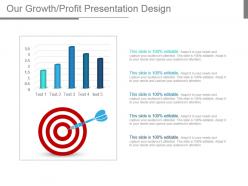 Our growth profit presentation design
Presenting our growth profit presentation design. This is a our growth profit presentation design. This is a five stage process. The stages in this process are business, marketing, achievement, success, graph, target, arrows.
-
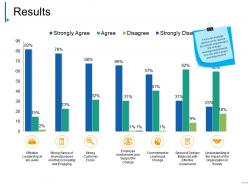 Results presentation diagrams
Presenting results presentation diagrams. This is a results presentation diagrams. This is a seven stage process. The stages in this process are strong customer focus, commitment to learning and change, effective leadership at all levels, agree, disagree.
-
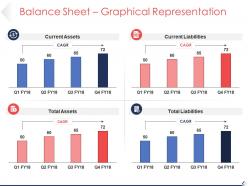 Balance sheet graphical representation sample of ppt
Presenting balance sheet graphical representation sample of ppt. This is a balance sheet graphical representation sample of ppt. This is a four stage process. The stages in this process are current assets, current liabilities, total assets, total liabilities.
-
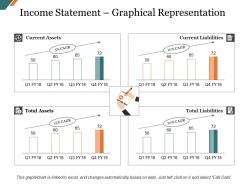 Income statement graphical representation presentation visual aids
Presenting this set of slides with name - Income Statement Graphical Representation Presentation Visual Aids. This is a four stage process. The stages in this process are Current Assets, Current Liabilities, Total Assets, Total Liabilities.
-
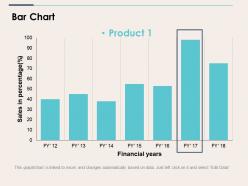 Bar chart ppt files
Presenting this set of slides with name - Bar Chart Ppt Files. This is a one stage process. The stages in this process are Sales In Percentage, Financial Years, Business, Marketing, Graph.
-
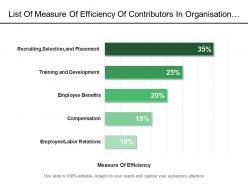 List of measure of efficiency of contributors in organisation development in percent
Presenting this set of slides with name - List Of Measure Of Efficiency Of Contributors In Organisation Development In Percent. This is a five stage process. The stages in this process are Contributor, Writer, Reporter.
-
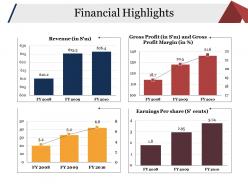 Financial highlights powerpoint templates microsoft
Presenting our Financial Highlights Powerpoint Templates Microsoft PPT set of slides with editable and adaptable graphics and icons. It provides you with the choice to give it your own orientation with modifiable color, font, font size, and font types of the template. The slide is available in both 4:3 and 16:9 aspect ratios. These PPT slides are also compatible with Google Slides.
-
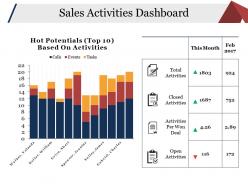 Sales activities dashboard presentation pictures
Presenting this set of slides with name - Sales Activities Dashboard Presentation Pictures. This is a two stage process. The stages in this process are Business, Marketing, Finance, Strategy, Growth.
-
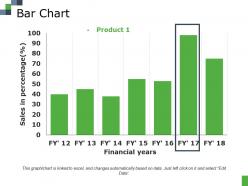 Bar chart ppt file summary
Presenting our Bar Chart PPT slides. This is a 100% editable and adaptable PPT slide. You can create your own custom template in our PPT layout. Use our design template and high-quality icons, colors, and styles to give your presentation a charm. You can save it in different formats like PDF, JPG, and PNG. It can also be modified into a different color, font, font size, and font types of the template as per your requirements. This template also supports the standard (4:3) and widescreen (16:9) sizes. It is also accessible with Google slides making it highly compatible.
-
 Cash flow statement kpis ppt styles sample
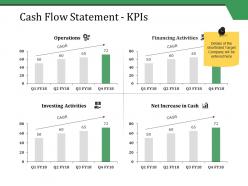
Presenting this set of slides with name - Cash Flow Statement Kpis Ppt Styles Sample. This is a four stage process. The stages in this process are Operations, Investing Activities, Financing Activities, Net Increase In Cash, Business.
-
 Cash flow statement kpis ppt file professional
Presenting this set of slides with name - Cash Flow Statement Kpis Ppt File Professional. This is a four stage process. The stages in this process are Operations, Financing Activities, Investing Activities, Net Increase In Cash.
-
 Combo chart ppt file summary
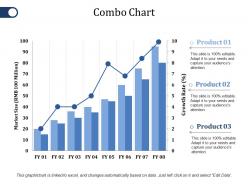
Presenting this set of slides with name - Combo Chart Ppt File Summary. This is a three stage process. The stages in this process are Product, Market Size, Growth Rate, Success, Bar Graph.
-
 School enrollment for population 18 to 24 years old enrolled in college or graduate school by sex in us 2015-17
Presenting this set of slides with name - School Enrollment For Population 18 To 24 Years Old Enrolled In College Or Graduate School By Sex In US 2015-17. School Enrollment For Population 18 To 24 Years Old Enrolled In College Or Graduate School By Sex In The U.S From 2015 TO 17. This is part of our Data and Statistics products selection, and you will need a Paid account to download the actual report with accurate data. Downloaded report will contain the actual editable graph with the actual data, an excel table with the actual data, the exact source of the data and the release date. This graph shows the total population 18 to 24 years old enrolled in college or graduate school categorized by public and private schools by male and female in the U.S from 2015 TO 17. It covers topic School Enrollment for population 18 to 24 years old by sex for region USA and is for date range 2015 TO 17. Download it immediately and use it for your business.
-
 Financial years performance management ppt sample download
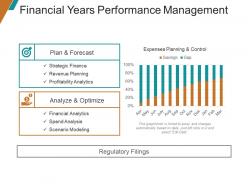
Presenting Financial Years Performance Management PPT Sample Download. Customize the slide as per the requirements. Change the colors, font type and font size and match it to your presentation theme. You can alter anything in this slide because it totally works on your command . Convert and save it in various formats. It is completely compatible with the Google Slides and can be projected on full screen as well. Get this in 2 screen sizes i.e. standard screen and widescreen.
-
 Service offering and availability powerpoint show
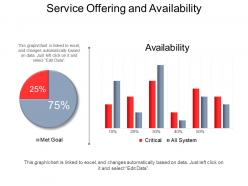
Presenting service offering and availability PowerPoint show. PPT is useful for customer service departments, executives, managers and professionals. The best feature of the PPT template is that it is fully amendable. You can modify and customize the design the way you want. Include business name, logo and trademarks to personalize the design. Design template can easily be downloaded into JPEG and PDF formats.
-
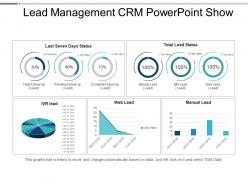 Lead management crm powerpoint show
Presenting lead management crm powerpoint show. This is a lead management crm powerpoint show. This is a five stage process. The stages in this process are lead management, lead generation, lead creation.
-
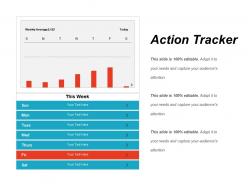 Action tracker powerpoint guide
Presenting Action Tracker PowerPoint Guide. The slide is entirely customizable. Change the background, colors, font type, and size as per your needs. Save it in formats like JPG and PDF. Completely compatible with the Google Slides. Avail this template in standard screen and widescreen as well.
-
 Clustered column line powerpoint images
Presenting clustered column line powerpoint images. This is a clustered column line powerpoint images. This is a three stage process. The stages in this process are clustered column line, finance, analysis, strategy, business.
-
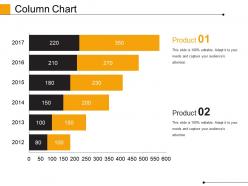 Column chart powerpoint slide deck samples
Presenting Column Chart PowerPoint Slide Deck Samples. Made up of high-resolution graphics. Easy to download and can be saved in a variety of formats. Access to open on a widescreen preview. Compatible with the Google Slides and PowerPoint software. Alter the style, size, and the background of the slide icons as per your needs. Useful for business owners, students, and managers. Can be viewed on standard screen and widescreen without any fear of pixelation.
-
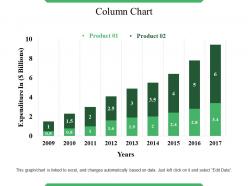 Column chart good ppt example
Presenting this set of slides with name - Column Chart Good Ppt Example. This is a two stage process. The stages in this process are Bar Graph, Marketing, Strategy, Finance, Analysis.
-
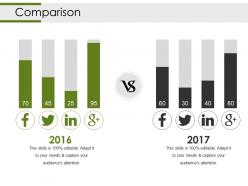 Comparison powerpoint slide background image
Presenting comparison powerpoint slide background image. This is a comparison powerpoint slide background image. This is a two stage process. The stages in this process are compare, marketing, planning, finance, bar graph.
-
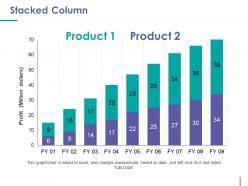 Stacked column ppt presentation examples
Presenting stacked column ppt presentation examples. This is a stacked column ppt presentation examples. This is a nine stage process. The stages in this process are profit million dollars, business, graph, marketing.
-
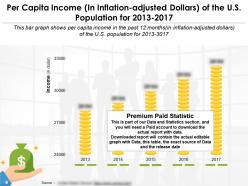 Per capita income in inflation adjusted dollars of the us population for 2013-2017
Presenting this set of slides with name - Per Capita Income In Inflation Adjusted Dollars Of The Us Population For 2013-2017. Per capita income in inflation adjusted dollars of the U.S. Population for 2013 to 2017. This is part of our Data and Statistics products selection, and you will need a Paid account to download the actual report with accurate data. Downloaded report will contain the actual editable graph with the actual data, an excel table with the actual data, the exact source of the data and the release date. This bar graph shows per capita income in the past 12 months in inflation adjusted dollars of the U.S. population for 2013 to 3017. It covers topic Per capita income for region USA and is for date range 2013 to 2017. Download it immediately and use it for your business.
-
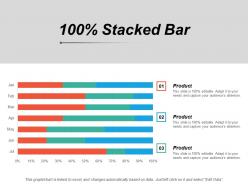 100 percent stacked bar finance marketing management investment analysis
Presenting this set of slides with name - 100 Percent Stacked Bar Finance Marketing Management Investment Analysis. This is a three stage process. The stages in this process are Finance, Marketing, Management, Investment, Analysis.
-
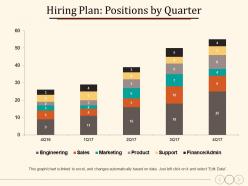 Hiring plan positions by quarter marketing strategy business
Presenting this set of slides with name - Hiring Plan Positions By Quarter Marketing Strategy Business. This is a five stage process. The stages in this process are Finance, Marketing, Management, Investment, Analysis.
-
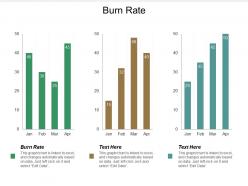 Burn rate ppt powerpoint presentation file background images cpb
Presenting this set of slides with name - Burn Rate Ppt Powerpoint Presentation File Background Images Cpb. This is an editable three stages graphic that deals with topics like Burn Rate to help convey your message better graphically. This product is a premium product available for immediate download,and is 100 percent editable in Powerpoint. Download this now and use it in your presentations to impress your audience.


