- Sub Categories
-
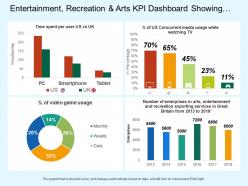 Entertainment recreation and arts kpi dashboard showing of media usage and time spent per user
Presenting this set of slides with name - Entertainment Recreation And Arts Kpi Dashboard Showing Of Media Usage And Time Spent Per User. This is a four stage process. The stages in this process are Entertainment, Recreation And Arts, Attractions, Culture, Entertainment.
-
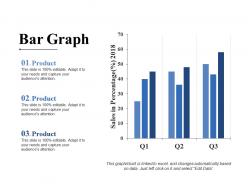 Bar graph sample ppt files
Presenting bar graph sample PPT files PPT slide. The bar graph components presentation slide designed professionally by the designing team of SlideTeam to compare the project progress and data. The bubble chart and text placeholder in the bar graph example presentation template is customizable in PowerPoint. A user can do changes in numerical values as the bubble chart excel PowerPoint template get linked with Excel sheet. The bar graph maker presentation template is also compatible with Google Slide. A user can edit the font size, font type, color and dimensions of the bar graph challenge art PPT template.
-
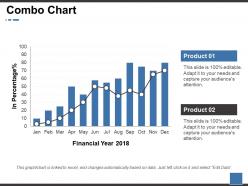 Combo chart ppt show template
Get a chance to go through the combo chart PowerPoint presentation slide. This presentation has been designed by professionals and is fully editable. You can remodel the font size, font type, colors, and even the background. This Template is practicable with Google Slide and can be saved in JPG or PDF format without any obstacle created during the process. Fast download at the click of the button provided below.
-
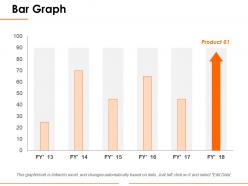 Bar graph ppt slides
Presenting this set of slides with name - Bar Graph Ppt Slides. This is a one stage process. The stages in this process are Business, Marketing, Finance, Bar Graph, Strategy.
-
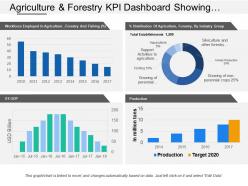 Agriculture and forestry kpi dashboard showing us gdp production target
Highlighting agricultural and forestry KPI dashboard showing us gdp production target PowerPoint slide. Useful tool for students, business analysts, sales people, sales managers and professionals of any industry. Precise and easy to comprehend information on PPT sample. Useful for marketing and business-related presentations. Wide screen projection does not affect the output adversely. Access to save in the JPG or PDF format. Increase the level of personalization with your company logo and name. Compatible with all software and can be saved in any format.
-
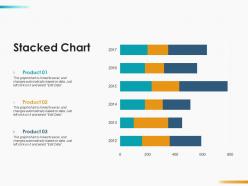 Stacked chart analysis ppt infographics design inspiration
Presenting this set of slides with name - Stacked Chart Analysis Ppt Infographics Design Inspiration. This is a three stage process. The stages in this process are Stacked Chart, Finance, Marketing, Analysis, Business.
-
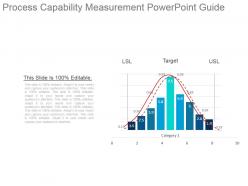 Process capability measurement powerpoint guide
Presenting process capability measurement powerpoint guide. This is a process capability measurement powerpoint guide. This is a nine stage process. The stages in this process are lsl, usl, category, target.
-
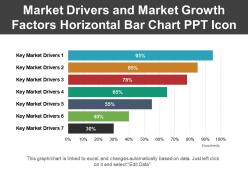 Market drivers and market growth factors horizontal bar chart ppt icon
Presenting market drivers and market growth factors PPT slide. This is professionally organized PPT template quite constructive for management professionals. Amendable shapes, patterns and subject matters. Authentic and relevant PPT Images with pliable options to insert caption or sub caption. Smooth Downloads. Runs smoothly with all available software’s. High quality Picture Presentation graphics which remain unaffected when projected on wide screen or google Slides.
-
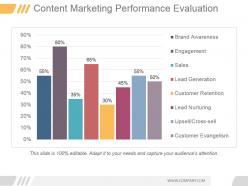 Content marketing performance evaluation ppt sample
Presenting content marketing performance evaluation ppt sample. This is a content marketing performance evaluation ppt sample. This is a eight stage process. The stages in this process are brand awareness, engagement, sales, lead generation, customer retention, lead nurturing, upsell cross sell, customer evangelism.
-
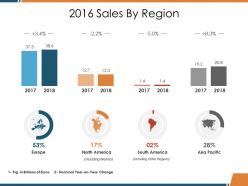 Sales by region ppt design ideas
Presenting this set of slides with name - Sales By Region Ppt Design Ideas. This is a eight stage process. The stages in this process are Europe, North America, South America, Asia Pacific, Business.
-
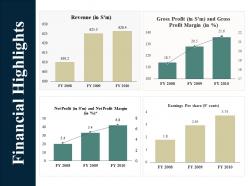 Financial highlights ppt summary outfit
Presenting this set of slides with name - Financial Highlights Ppt Summary Outfit. This is a four stage process. The stages in this process are Earnings Per Share, Revenue, Gross Profit, Business, Marketing, Finance.
-
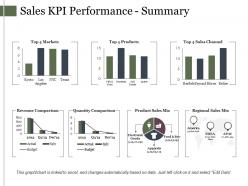 Sales kpi performance summary ppt sample presentations
Presenting this set of slides with name - Sales Kpi Performance Summary Ppt Sample Presentations. This is a seven stage process. The stages in this process are Bar, Marketing, Finance, Growth, Strategy.
-
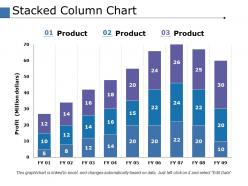 Stacked column chart finance ppt powerpoint presentation file design ideas
This is a three stages process. The stages in this process are Finance, Marketing, Management, Investment, Analysis.
-
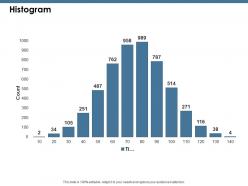 Histogram ppt show example introduction
This is a two stage process. The stages in this process are Marketing, Business, Management.
-
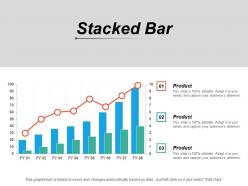 Stacked bar finance marketing management investment analysis
Presenting this set of slides with name - Stacked Bar Finance Marketing Management Investment Analysis. This is a three stage process. The stages in this process are Finance, Marketing, Management, Investment, Analysis.
-
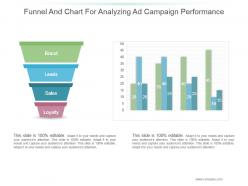 Funnel and chart for analyzing ad campaign performance
Presenting funnel and chart for analyzing ad campaign performance. This is a funnel and chart for analyzing ad campaign performance. This is a four stage process. The stages in this process are brand, leads, sales, loyalty.
-
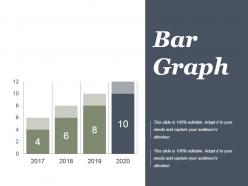 Project performance bar graph powerpoint slide designs download
Presenting project performance bar graph powerpoint slide designs download. This is a project performance bar graph powerpoint slide designs download. This is a four stage process. The stages in this process are bar graph, business, growth, years, success.
-
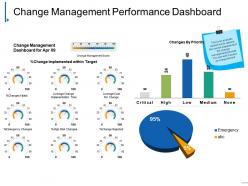 Change management performance dashboard powerpoint slide images
Presenting change management performance dashboard powerpoint slide images. This is a change management performance dashboard powerpoint slide images. This is a two stage process. The stages in this process are critical, high, low, medium, none.
-
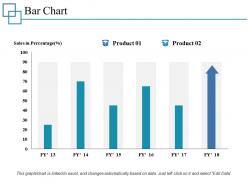 Bar chart ppt professional guidelines
Presenting this set of slides with name - Bar Chart Ppt Professional Guidelines. This is a three stage process. The stages in this process are Business, Management, Strategy, Analysis, Marketing.
-
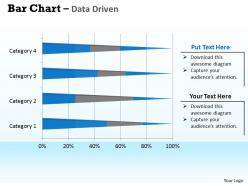 Data driven 3d bar chart for data interpretation powerpoint slides
We are proud to present our data driven 3d bar chart for data interpretation powerpoint slides. This PowerPoint diagram condense large amounts of information into easy-to-understand formats that clearly and effectively communicate important points. It should be used to make facts clearer and more understandable.
-
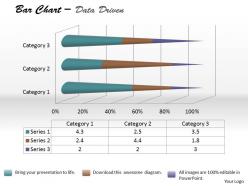 Data driven 3d bar chart for foreign trade powerpoint slides
We are proud to present our data driven 3d bar chart for foreign trade powerpoint slides. Deadlines Are An Element Of Todays Workplace. Our Data Driven 3D Bar Chart For Foreign Trade Powerpoint slides Power Point Templates Help You Meet The Demand. Just Browse And Pick The Slides That Appeal To Your Intuitive Senses. Our Data Driven 3D Bar Chart For Foreign Trade Powerpoint slides Power Point Templates Will Help You Be Quick Off The Draw. Just Enter Your Specific Text And See Your Points Hit Home.
-
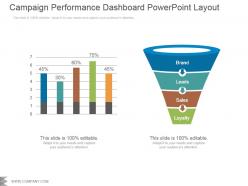 Campaign performance dashboard snapshot powerpoint layout
Presenting campaign performance dashboard snapshot powerpoint layout. This is a campaign performance dashboard powerpoint layout. This is a two stage process. The stages in this process are brand, leads, sales, loyalty.
-
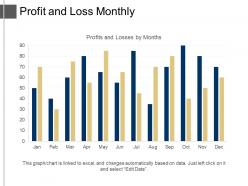 Profit and loss monthly ppt examples professional
Presenting Profit And Loss Monthly PPT Examples Professional. This template is very easy to access, download it with just a click. This slide can be customized according to the requirement. The template is available in both standard and widescreen formats. You can change the color, texts, fonts, and other features as per your needs. Save it in formats like PDF, JPG and PNG. This template is also compatible with Google Slides. It is made up of high-resolution graphics that do not deteriorate when projected on fullscreen.
-
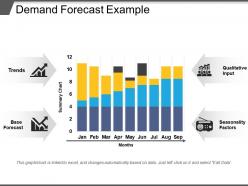 Demand forecast example ppt slides
Presenting Demand Forecast Example PPT Slides which is completely editable. Customize the color, fonts, font size, and font types of the template as per the requirement. Can be converted into formats like PDF, PNG, and JPG. The slide is available in both 4:3 and 16:9 aspect ratio. It is adaptable with Google Slides, which makes it easily accessible.
-
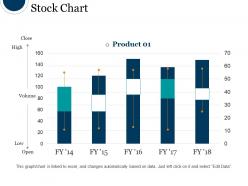 Stock chart ppt diagrams
Presenting stock chart ppt diagrams. This is a stock chart ppt diagrams. This is a five stage process. The stages in this process are stock chart, product, high, close, volume, low.
-
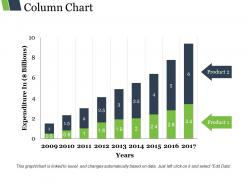 Column chart ppt images gallery
Presenting column chart ppt images gallery. This is a column chart ppt images gallery. This is a nine stage process. The stages in this process are product, expenditure, years, bar graph, growth.
-
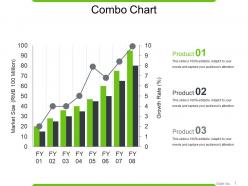 Combo chart powerpoint presentation
Presenting a Combo Chart PowerPoint Layout. This slide can be downloaded into formats like PDF, JPG, and PNG without any problem. It is adaptable with Google Slides which makes it accessible at once. You can modify the color, font, font size, and font types of the slides as per your requirement. This slide is available in both standard and widescreen aspect ratios. High-quality graphics ensure that there is no room for deterioration.
-
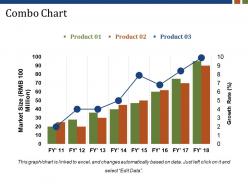 Combo chart presentation images
Presenting combo chart presentation images. This is a combo chart presentation images. This is a three stage process. The stages in this process are combo chart, finance, strategy, analysis, business, marketing.
-
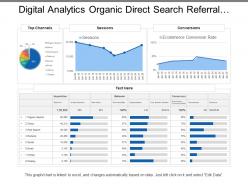 Digital analytics organic direct search referral social
Presenting this set of slides with name - Digital Analytics Organic Direct Search Referral Social. This is a five stage process. The stages in this process are Digital Analytics, Digital Dashboard, Digital Kpis.
-
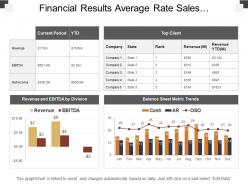 Financial results average rate sales opportunities ppt
Presenting financial results average rate sales opportunities Presentation design with editing options. Amazing picture quality as pixels doesn’t break even on large display. PowerPoint slide can be displayed in standard and widescreen view. Preference personalizes the presentation with business credentials. Similar designs available with different nodes and stages. Easy download and transform into another format such as JPEG and PDF. PPT template works well with Google slides and can be shared easily whenever required.
-
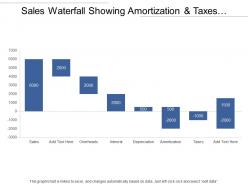 Sales waterfall showing amortization and taxes with negative values
Presenting this set of slides with name - Sales Waterfall Showing Amortization And Taxes With Negative Values. This is a eight stage process. The stages in this process are Sales Waterfall, Waterfall Chart.
-
 Workers leaving by time from home to go to work for females in us from 2015-17
Presenting this set of slides with name - Workers Leaving By Time From Home To Go To Work For Females In US From 2015-17. Workers By Time Leaving Home To Go To Work For Females In The U.S From 2015 to 17. This is part of our Data and Statistics products selection, and you will need a Paid account to download the actual report with accurate data. Downloaded report will contain the actual editable graph with the actual data, an excel table with the actual data, the exact source of the data and the release date. This graph shows the workers by time 12.00 a.m to 11.59 p.m leaving home to go to work for females in the U.S from the years 2015 to 17. It covers topic Workers by time leaving home to go to work for females for region USA and is for date range 2015 to 17. Download it immediately and use it for your business.
-
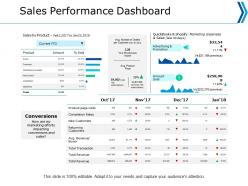 Sales performance dashboard marketing ppt powerpoint presentation professional background images
Presenting this set of slides with name - Sales Performance Dashboard Marketing Ppt Powerpoint Presentation Professional Background Images. This is a four stage process. The stages in this process are Finance, Analysis, Business, Investment, Marketing.
-
 Comparison stats trend line powerpoint templates
Presenting comparison stats trend line PowerPoint templates PPT slide. You can download the slide and save into JPG & PDF format and can also display in the standard & widescreen view. You may even do alteration in the slide such as color, text, font type, font size and aspect ratio. The template gets synced with Google Slides and editable in PowerPoint. You may share this slide with large segment because it has tremendous pixel quality. You can insert the relevant content in text placeholder of the template.
-
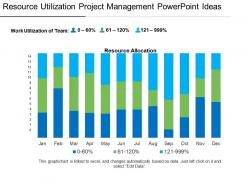 Resource utilization project management powerpoint ideas
Presenting resource utilization project management PowerPoint ideas design template. PPT can be used in business and project management related slideshows. Fully amendable slideshow can easily be changed by anyone. Insert business logo, trademarks to personalize the design. PPT can be opened with Google Slides and PowerPoint. You can access the design on normal and full screen views. Easy and swift downloading is available.
-
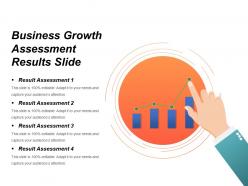 Business growth assessment results slide powerpoint graphics
Introducing business growth assessment PPT slide. The Presentation image is articulate and useful for the understudies, analysts, experts from different fields. The essential features of this PowerPoint diagram enable you to alter the appearance, design, text, shade and more. This PPT diagram even provides enough scope to embed the title or captions separately. This Presentation template is also well familiar with all Google Slides and other operating applications.
-
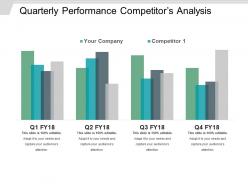 Quarterly performance competitors analysis powerpoint graphics
Presenting Quarterly performance competitors analysis PowerPoint slide. They are informational and adorned PPT formats useful for the business experts. They remain its high caliber even when anticipated on the wide screen .These PowerPoint designs can be effectively exportable into PDF or JPG file frames. They can be effectively utilized with Google Slides and different applications. They have amend able highlights like shading, content, images, and more.
-
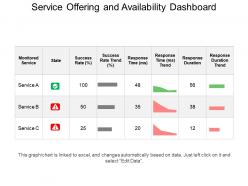 Service Offering And Availability Dashboard Snapshot Ppt Slide
Presenting Service Offering And Availability Dashboard Snapshot PPT Slide. This presentation is professionally designed. You can modify the font type, size, diagram color, and background color. The slideshow is also compatible with Google Slides and can be saved in image formats such as JPG or document formats such as PDF without any difficulty. High-quality graphics and icons ensure that there is no deterioration in quality.
-
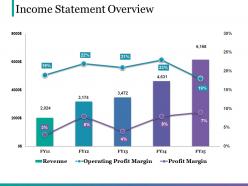 Income statement overview good ppt example
Presenting this set of slides with name - Income Statement Overview Good Ppt Example. This is a five stage process. The stages in this process are Business, Marketing, Strategy, Graph, Finance.
-
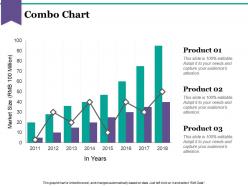 Combo chart ppt model
Presenting this set of slides with name - Combo Chart Ppt Model. This is a three stage process. The stages in this process are Business, Marketing, Finance, Market Size, In Years.
-
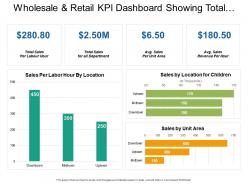 Wholesale and retail kpi dashboard showing total sales per labor hour sales by unit area
Presenting the KPI dashboard template for PowerPoint. This PPT template is 100% customizable in MS PowerPoint and is professionally designed. You can edit the objects in the slide like font size and font color very easily. This presentation template is 100% compatible with Google Slide and can be saved in JPG or PDF file format without any fuss. Click on the download button to download this presentation template.
-
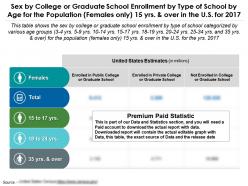 Sex by school enrollment by type of school by age group population females only 15 years over us 2017
Presenting this set of slides with name - Sex By School Enrollment By Type Of School By Age Group Population Females Only 15 Years Over US 2017. Sex By College Or Graduate School Enrollment By Type Of School By Age For The Population Females Only 15 Years And Over In The U.S For 2017. This is part of our Data and Statistics products selection, and you will need a Paid account to download the actual report with accurate data. Downloaded report will contain the actual editable graph with the actual data, an excel table with the actual data, the exact source of the data and the release date. This table shows the sex by college or graduate school enrollment by type of school categorized by various age groups 3 4 years, 5 9 years, 10 14 years, 15 17 years, 18 19 years, 20 24 years, 25 34 years and 35 years and over for the population females only 15 years and over in the U.S for the year 2017. It covers topic School Enrollment for the population 15 years and over by age group for females for region USA and is for date range 2017. Download it immediately and use it for your business.
-
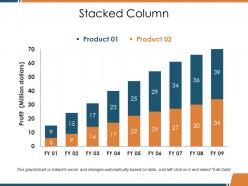 Stacked column ppt background designs
Presenting this set of slides with name - Stacked Column Ppt Background Designs. This is a two stage process. The stages in this process are Profit, Business, Marketing, Graph, Growth.
-
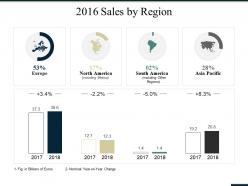 Sales by region ppt summary icons
Presenting this set of slides with name - Sales By Region Ppt Summary Icons. This is a eight stage process. The stages in this process are Europe, North America, South America, Asia Pacific, Business.
-
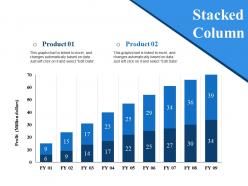 Stacked column ppt styles
Presenting this set of slides with name - Stacked Column Ppt Styles. This is a nine stage process. The stages in this process are Stacked Column, Business, Marketing, Strategy, Management.
-
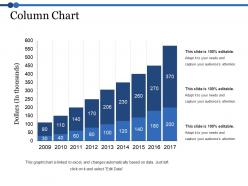 Column chart ppt themes
Presenting this set of slides with name - Column Chart Ppt Themes. This is a nine stage process. The stages in this process are Bar Graph, Finance, Planning, Strategy, Analysis.
-
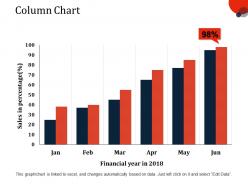 Column chart ppt slides display
Presenting this set of slides with name - Column Chart Ppt Slides Display. This is a six stage process. The stages in this process are Financial In Years, Sales In Percentage, Business, Marketing, Graph.
-
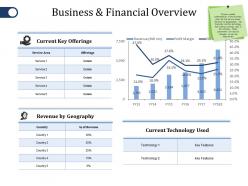 Business and financial overview ppt file model
Presenting this set of slides with name - Business And Financial Overview Ppt File Model. This is a four stage process. The stages in this process are Current Key Offerings, Revenue By Geography, Current Technology Used, Technology.
-
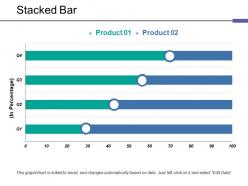 Stacked bar ppt show
Presenting Stacked Ppt Show Presentation Slides. This slide is fully editable. This slide is also compatible with Google Slides and PowerPoint software. It is made up of high-resolution graphics that do not deteriorate the quality when projected on a full screen. Customize the slide as per your needs and wants. It can be viewed on a standard screen and widescreen without any fear of pixelation. It can be easily saved into formats like PDF, JPG, and PNG.
-
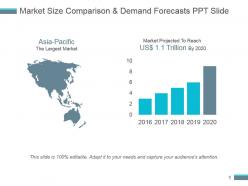 Market size comparison and demand forecasts ppt slide
Presenting market size comparison and demand forecasts ppt slide. This is a market size comparison and demand forecasts ppt slide. This is a two stage process. The stages in this process are asia pacific the largest market, market projected to reach.
-
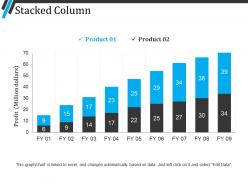 Stacked column powerpoint guide
Presenting stacked column powerpoint guide. This is a stacked column powerpoint guide. This is a two stage process. The stages in this process are stacked column, finance, marketing, strategy, analysis, business.
-
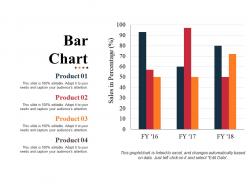 Bar chart example of ppt presentation
Presenting Bar Chart Example Of PPT Presentation. Our PPT layout is compatible with Google Slides. You can download this PPT theme in various formats like PDF, PNG, and JPG. This PowerPoint template is completely editable and you can modify the font size, font type, and shapes as per your requirements. This PPT slide is available in 4:3 and 16:9 aspect ratios.
-
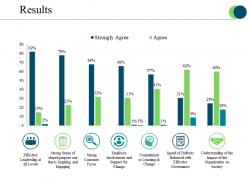 Results presentation images
Presenting results presentation images. This is a results presentation images. This is a seven stage process. The stages in this process are effective leadership at all levels, strong customer focus, commitment to learning and change.
-
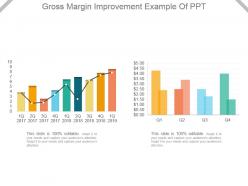 Gross margin improvement example of ppt
Presenting gross margin improvement example of ppt. Presenting gross margin improvement example of ppt. Presenting gross margin improvement example of ppt. This is a gross margin improvement example of ppt. This is two stage process. The stages in this process are business, growth, marketing, strategy, success.
-
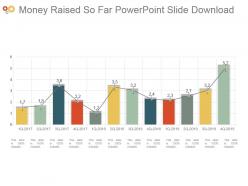 Money raised so far powerpoint slide download
Presenting money raised so far powerpoint slide download. This is a money raised so far powerpoint slide download. This is a twelve stage process. The stages in this process are business, marketing, growth, rising, management.
-
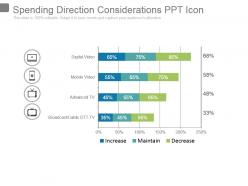 Spending direction considerations ppt icon
Presenting spending direction considerations ppt icon. This is a spending direction considerations ppt icon. This is a three stage process. The stages in this process are digital video, mobile video, advanced tv, broadcast cable ott tv.
-
 Selection of the optimal portfolio powerpoint slide backgrounds
Presenting selection of the optimal portfolio powerpoint slide backgrounds. This is a selection of the optimal portfolio powerpoint slide backgrounds. This is a three stage process. The stages in this process are success, business, marketing, presentation, management.
-
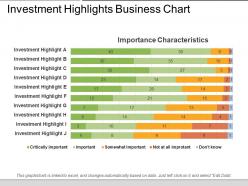 Investment highlights business chart
Presenting investment highlights business chart PPT slide. A unique presentation of the business concept. Adjustable with multiple topics related to finance and marketing. Compatible with numerous format options. Harmonious with a big set of software. High resolution. No issue of pixelation when projected on a wide screen. 100 percent editable. Modify the slide content as per individual preference. Personalize the presentation with company name and logo.
-
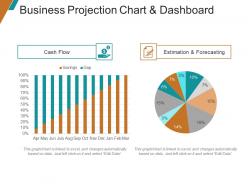 Business projection chart and dashboard ppt samples download
Presenting financial projection graph PPT samples Download which is 100% editable. The inserted features in this PPT are easy with modifications and all the features used in this PowerPoint presentation are compatible with Google Slides, multiple format and software options. This PPT is easy to download in a very short span of time. In case of any assistance, the presenter may refer to presentation designs services being provided along with this PowerPoint presentation. This PPT slide can be saved as JPG or in pdf format.
-
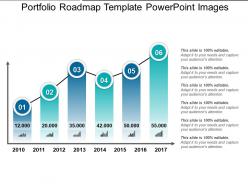 Portfolio roadmap template powerpoint images
Presenting portfolio roadmap template PowerPoint images. This template can be simply used by changing the colors and style of the presentation. This presentation layout offers an easy conversion to other software applications such as JPG and PDF formats. This template is perfectly suitable for entrepreneurs, corporate and business managers. This PowerPoint is a highly innovative and versatile template that can ensure you create a successful communication. This slide has an ample amount of space to capture details of titles and subtitles.


