- Sub Categories
-
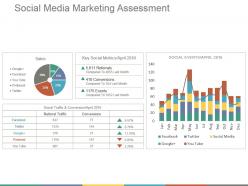 Social media marketing assessment ppt background designs
Presenting the social media marketing PowerPoint PPT. This slide is fully customizable PowerPoint template to communicate your ideas clearly. You can easily edit the charts and graphs in excel sheet. This presentation slide is designed with elegant shapes and visuals. You can convert this slide into numerous format options like JPEG, JPG or PDF. This template gives a professional outlook to your PowerPoint presentation. It is easy to customize each graphics and text as per your need. You can download it easily at a click of button.
-
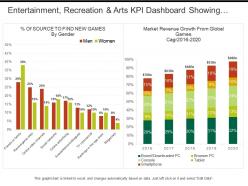 Entertainment recreation and arts kpi dashboard showing market revenue growth
Presenting this set of slides with name - Entertainment Recreation And Arts Kpi Dashboard Showing Market Revenue Growth. This is a two stage process. The stages in this process are Entertainment, Recreation And Arts, Attractions, Culture, Entertainment.
-
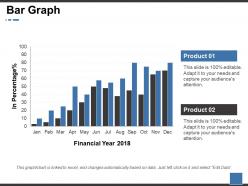 Bar graph ppt summary guidelines
Grab an opportunity to go through the bar graph PowerPoint presentation slide. This presentation has been designed under the strict supervision of professionals and is fully editable. You can remodel the font size, font type, colors, and even the background. This Template is practicable with Google Slide and can be saved in JPG or PDF format without any hurdles created during the process. Fast download at the click of the button provided below.
-
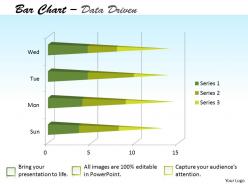 Data driven 3d forex market bar chart powerpoint slides
We are proud to present our data driven 3d forex market bar chart powerpoint slides. Our Data Driven 3D Forex Market Bar Chart Powerpoint slides Power Point Templates Give You The Basic Framework Of Your Talk. Give It The Shape You Desire With Your Wonderful Views. Our Data Driven 3D Forex Market Bar Chart Powerpoint slides Power Point Templates Are The Lungs Of Your Talk. Fill Them With The Oxygen Of Your In-depth Thought Process.
-
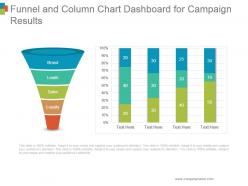 Funnel and column chart dashboard for campaign results ppt background images
Presenting funnel and column chart dashboard for campaign results ppt background images. This is a funnel and column chart dashboard for campaign results ppt background images. This is a two stage process. The stages in this process are brand, leads, sales, loyalty.
-
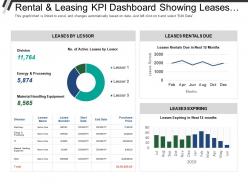 Rental and leasing kpi dashboard showing leases expiring leases by lessor
Presenting this set of slides with name - Rental And Leasing Kpi Dashboard Showing Leases Expiring Leases By Lessor. This is a four stage process. The stages in this process are Rental And Leasing, Dealing And Leasing, Rental And Engage.
-
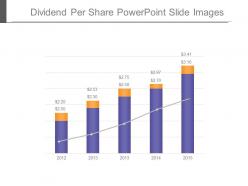 Dividend per share powerpoint slide images
Presenting dividend per share powerpoint slide images. This is a dividend per share powerpoint slide images. This is a five stage process. The stages in this process are business, graph chart, growth, strategy, finance.
-
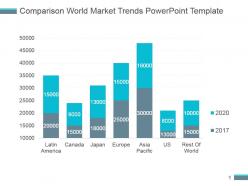 Comparison world market trends powerpoint template
Presenting comparison world market trends powerpoint template. This is a comparison world market trends powerpoint template. This is a seven stage process. The stages in this process are latin america, canada, japan, europe, asia pacific, us, rest of world.
-
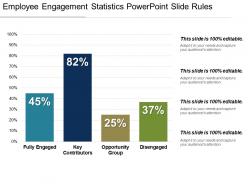 Employee engagement statistics powerpoint slide rules
Presenting our employee engagement statistics PowerPoint slide rules. This PPT slide offers you plenty of space to put in titles and subtitles. High resolution based presentation layout, does not change the image even after resizing. This presentation icon is data driven and template can be downloaded via excel file to incorporate data. Quick downloading speed and simple editing options in color text and fonts.PPT icons can easily be changed into JPEG and PDF applications.
-
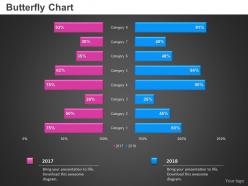 0414 butterfly bar chart for business performance powerpoint graph
Presenting 0414 bar chart for business performance PowerPoint graph PPT slide. PPT has high-resolution visuals. Impressive picture quality which does not deter when projected on a wide screen. There is an impressive use of colors and design. PPT is compatible with a large number of formats. It is compatible with numerous online and offline software options. It is thoroughly editable slide design background. Ease of modification. Personalization of content with company-specific name, logo or trademark is extremely easy. PPT is professionally proficient and aesthetically sound. Used by marketers, brand managers, sales professionals, students, and teachers.
-
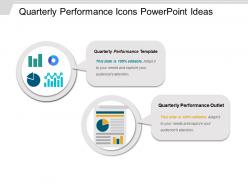 Quarterly performance icons powerpoint ideas
Presenting quarterly performance icons PowerPoint ideas. This PPT template has an ample amount of space to put in titles and subtitles. This slide offers high resolution based presentation which does not change the image even after resizing. This presentation icon is completely compatible with Google Slides. Quick downloading speed and simple editing options in color text and fonts.PPT icons can easily be changed into JPEG and PDF applications. This diagram has been designed for entrepreneurs, corporate and business managers.
-
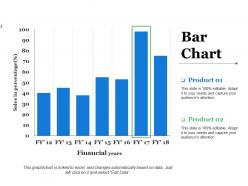 Bar chart ppt slides summary
Presenting this set of slides with name - Bar Chart Ppt Slides Summary. This is a two stage process. The stages in this process are Sales In Percentage, Percentage, Business, Marketing, Financial Years.
-
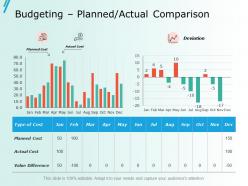 Budgeting planned actual comparison ppt slides inspiration
Presenting this set of slides with name - Budgeting Planned Actual Comparison Ppt Slides Inspiration. This is a two stage process. The stages in this process are Business, Management, Strategy, Analysis, Marketing.
-
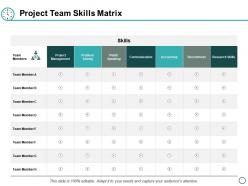 Project team skills matrix ppt powerpoint presentation layouts background designs
Presenting this set of slides with name - Project Team Skills Matrix Ppt Powerpoint Presentation Layouts Background Designs. This is a seven stages process. The stages in this process are Project Management, Communication, Planning, Business, Marketing.
-
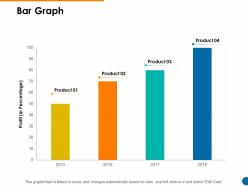 Bar graph ppt powerpoint presentation pictures slides
Presenting this set of slides with name - Bar Graph Ppt Powerpoint Presentation Pictures Slides. This is a four stage process. The stages in this process are Business, Marketing, Strategy, Analysis, Management.
-
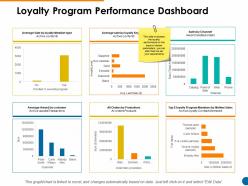 Loyalty program performance dashboard ppt powerpoint presentation pictures graphics
Presenting this set of slides with name - Loyalty Program Performance Dashboard Ppt Powerpoint Presentation Pictures Graphics. This is a six stage process. The stages in this process are Business, Strategy, Marketing, Analysis, Management.
-
 Gross margin improvement powerpoint slide backgrounds
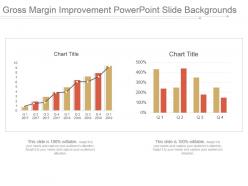
Presenting gross margin improvement powerpoint slide backgrounds. Presenting gross margin improvement powerpoint slide backgrounds. Presenting gross margin improvement powerpoint slide backgrounds. This is a gross margin improvement powerpoint slide backgrounds. This is two stage process. The stages in this process are chart title, gross margin, improvement, business, success.
-
 Gross margin improvement ppt sample
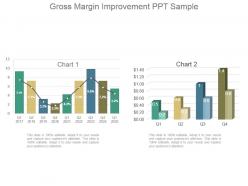
Presenting gross margin improvement ppt sample. Presenting gross margin improvement ppt sample. Presenting gross margin improvement ppt sample. This is a gross margin improvement ppt sample. This is two stage process. The stages in this process are gross margin, improvement, strategy, business, success, finance.
-
 Our research results powerpoint slide templates download
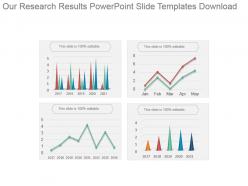
Presenting our research results powerpoint slide templates download. This is a our research results powerpoint slide templates download. This is a four stage process. The stages in this process are business, management, presentation, finance, marketing.
-
 Our research results ppt examples professional
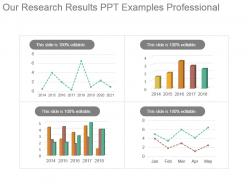
Presenting our research results ppt examples professional. This is a our research results ppt examples professional. This is a four stage process. The stages in this process are business, management, presentation, finance, marketing.
-
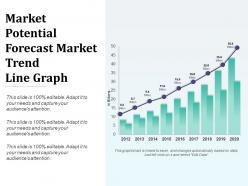 Market potential forecast market trend ppt templates
Presenting market potential forecast market trend ppt templates. This is a market potential forecast market trend ppt templates. This is a nine stage process. The stages in this process are business, bar graph, finance, strategy, marketing, success.
-
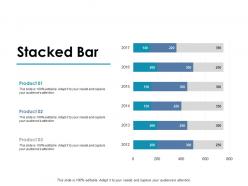 Stacked bar finance ppt powerpoint presentation layouts examples
Presenting this set of slides with name - Stacked Bar Finance Ppt Powerpoint Presentation Layouts Examples. This is a three satges process. The stages in this process are Stacked Bar, Finance, Marketing, Management, Investment.
-
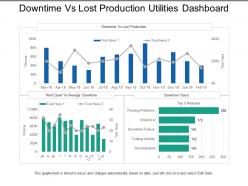 Downtime vs lost production utilities dashboard
Presenting this set of slides with name - Downtime Vs Lost Production Utilities Dashboard. This is a three stage process. The stages in this process are Utilities, Use, Advantage.
-
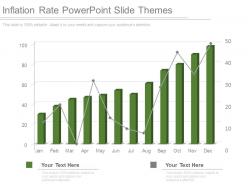 Inflation rate powerpoint slide themes
Presenting inflation rate powerpoint slide themes. This is a inflation rate powerpoint slide themes. This is a twelve stage process. The stages in this process are business, growth, strategy, management, success.
-
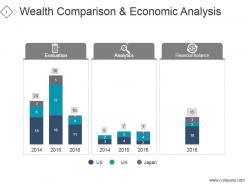 Wealth comparison and economic analysis ppt design
Presenting wealth comparison and economic analysis ppt design. This is a wealth comparison and economic analysis ppt design. This is a three stage process. The stages in this process are evaluation, analytics, financial balance.
-
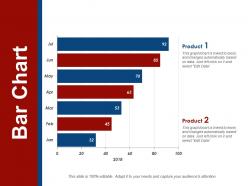 Bar chart powerpoint slides
Presenting Bar Chart PowerPoint Slides. The slide can be modified as per your wants. Make alterations in the colors, background, and font type of the layout. Increase or decrease the size of the icon and transform it into formats like JPG, JPEG, and PDF. Goes well with Google Slides. It can be projected on a full screen in front of thousands of people. Also, the template is completely compatible with the major Microsoft versions and can be presented in front of a large segment because of its high-resolution graphics.
-
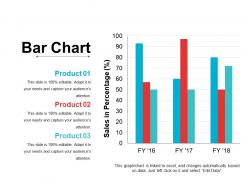 Bar chart powerpoint slide templates download
Presenting bar chart powerpoint slide templates download. This is a bar chart powerpoint slide templates download. This is a three stage process. The stages in this process are sales in percentage, graph, business, marketing, finance.
-
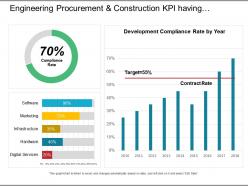 Engineering procurement and construction kpi having compliance rate
Presenting this set of slides with name - Engineering Procurement And Construction Kpi Having Compliance Rate. This is a three stage process. The stages in this process are Engineering, Procurement And Construction, Construction Management, Engineering, Purchasing And Construction .
-
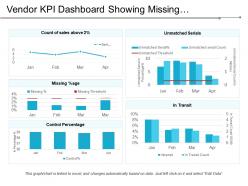 Vendor kpi dashboard showing missing percentage unmatched serials and control percentage
Presenting this set of slides with name - Vendor Kpi Dashboard Showing Missing Percentage Unmatched Serials And Control Percentage. This is a five stage process. The stages in this process are Vendor, Supplier, Retailer.
-
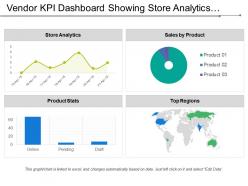 Vendor kpi dashboard showing store analytics sales by product and product stats
Presenting this set of slides with name - Vendor Kpi Dashboard Showing Store Analytics Sales By Product And Product Stats. This is a four stage process. The stages in this process are Vendor, Supplier, Retailer.
-
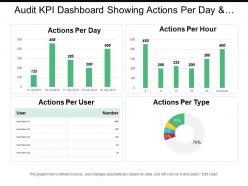 Audit kpi dashboard showing actions per day and actions per hour
Presenting this set of slides with name - Audit Kpi Dashboard Showing Actions Per Day And Actions Per Hour. This is a five stage process. The stages in this process are Audit, Examine, Survey.
-
 Bar graph ppt background images
Presenting this set of slides with name - Bar Graph Ppt Background Images. This is a two stage process. The stages in this process are Business, Marketing, Sales In Percentage, Bar Graph, Finance.
-
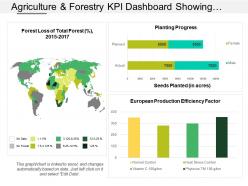 Agriculture and forestry kpi dashboard showing planting progress and seeds planted
Introducing agriculture and forestry KPI dashboard showing planting progress and seeds planted PPT template. The presentation template can be downloaded and saved in any desired format. Valuable for the business presenters and entrepreneurs as they can showcase their business success in a creative way. Privilege of insertion of logo and trademarks for more personalization. Adaptable to wide screen view without the problem of pixilation. Can be used with Google slides. Beneficial for industry professionals, managers, executives, researchers, sales people, etc.
-
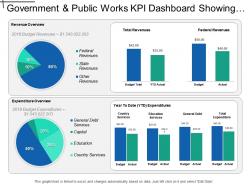 Government and public works kpi dashboard showing revenue and expenditure overview
Presenting this set of slides with name - Government And Public Works Kpi Dashboard Showing Revenue And Expenditure Overview. This is a four stage process. The stages in this process are Government And Public Works, Government And Public Tasks.
-
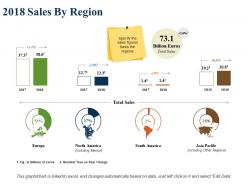 2018 sales by region total sales north america europe
Presenting 2018 sales by region total sales North America Europe PowerPoint template design slide. This is a completely editable PowerPoint format which is anything but difficult to get a handle on. Alter the shading plans and symbols connected here, the content boxes and pictures utilized here as per the need. You can embed your organization logo and name in the PPT deck for a superior ordeal. Utilize this layout with Google Slides and diagram to a widescreen. Use in full screen 16:9 rendition for a magnificent movement. Instructional slides are accessible with the format for your altering headings.
-
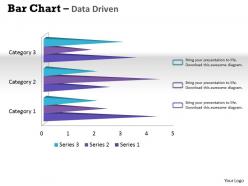 Data driven 3d bar chart for financial data solutions powerpoint slides
We are proud to present our data driven 3d bar chart for financial data solutions powerpoint slides. Develop competitive advantage with our above template which enables users to create and present topics. This is an easy and effective way to present process. Use this chart to bring facts to life.
-
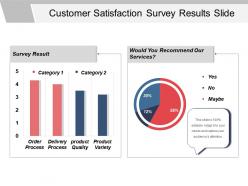 Customer satisfaction survey results slide powerpoint slide introduction
Presenting Customer Satisfaction Survey Results Slide PowerPoint Slide Introduction. A presenter can even do changes in the icon size of the satisfaction survey as per his requirement. Customize the aspect ratio, font style, and font size, etc. because this survey template is a fully editable template. Its compatibility with Google Slides makes it accessible at once. This template is linked with the excel sheet. You can save this infographic survey template in other formats such as JPEG & PDF. Download this slide now in standard screen and widescreen.
-
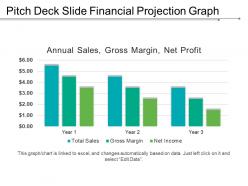 Pitch deck slide financial projection graph ppt templates
Presenting a PPT slide named Pitch deck slide financial projection graph PPT template. This PowerPoint slide is professionally made and is editable for your convenience. It contains refined content. The texts and contents can be changed. The font color, size, and style can be formatted. Alter the color and shape of the diagrams. Get easy access to slide owing to its compatibility with Google Slides. Conversion of the slide to PDF and JPG formats is possible.
-
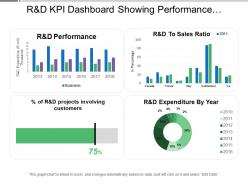 R and d kpi dashboard showing performance and expenditure by year
Presenting this set of slides with name - R And D Kpi Dashboard Showing Performance And Expenditure By Year. This is a four stage process. The stages in this process are R And D, Research And Development, Research And Technological Development.
-
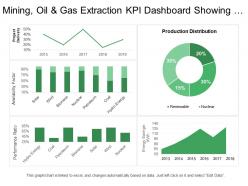 Mining oil and gas extraction kpi dashboard showing project delivery and availability factor
Presenting this set of slides with name - Mining Oil And Gas Extraction Kpi Dashboard Showing Project Delivery And Availability Factor. This is a four stage process. The stages in this process are Mining, Oil And Gas Extraction, Refinery, Natural Gas.
-
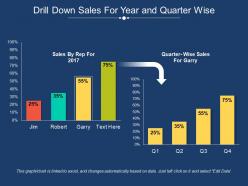 Drill down sales for year and quarter wise
Presenting this set of slides with name - Drill Down Sales For Year And Quarter Wise. This is a two stage process. The stages in this process are Drill Down, Hierarchy, Top Downwards.
-
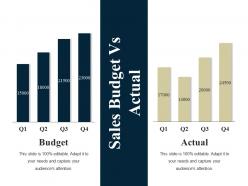 Sales budget vs actual ppt summary layout ideas
Presenting this set of slides with name - Sales Budget Vs Actual Ppt Summary Layout Ideas. This is a two stage process. The stages in this process are Budget, Actual, Business, Marketing, Graph.
-
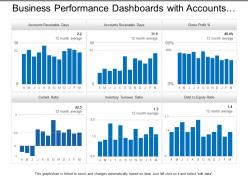 Business performance dashboards with accounts receivable and accounts payable
Presenting business performance dashboards with accounts receivable and accounts payable PPT template. These PPT graphics allow you to resize and recolor the images. Good quality images can be used to complement and reinforce the learning. Works well with all software's and Google Slides. Editing in display slideshow can be done from wherever by compatible devices. Convert PPT to PDF at ease.
-
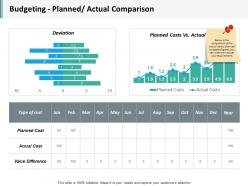 Budgeting planned actual comparison ppt infographics display
Presenting this set of slides with name - Budgeting Planned Actual Comparison Ppt Infographics Display. This is a two stage process. The stages in this process are Business, Management, Strategy, Analysis, Marketing.
-
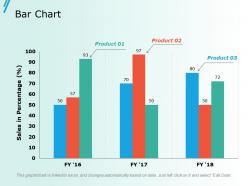 Bar chart ppt slides ideas
Presenting this set of slides with name - Bar Chart Ppt Slides Ideas. This is a three stage process. The stages in this process are Business, Management, Strategy, Analysis, Marketing.
-
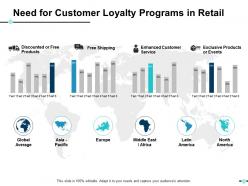 Need for customer loyalty programs in retail ppt show vector
Presenting this set of slides with name - Need For Customer Loyalty Programs In Retail Ppt Show Vector. This is a four stage process. The stages in this process are Business, Management, Strategy, Analysis, Icons.
-
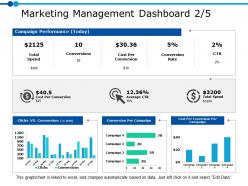 Marketing management dashboard 2 5 ppt powerpoint presentation gallery clipart
Presenting this set of slides with name - Marketing Management Dashboard 2 5 Ppt Powerpoint Presentation Gallery Clipart. This is a three stage process. The stages in this process are Business, Management, Strategy, Analysis, Marketing.
-
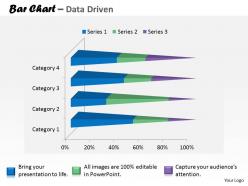 Data driven 3d currency trading bar chart powerpoint slides
We are proud to present our data driven 3d currency trading bar chart powerpoint slides. Our Data Driven 3D Currency Trading Bar Chart Powerpoint slides Power Point Templates Are The Chords Of Your Song. String Them Along And Provide The Lilt To Your Views. Our Data Driven 3D Currency Trading Bar Chart Powerpoint slides Power Point Templates Help You Pinpoint Your Timelines. Highlight The Reasons For Your Deadlines With Their Use.
-
 0414 innovative brain idea bar chart powerpoint graph
We are proud to present our 0414 innovative brain idea bar chart powerpoint graph. Whatever the nuance you want to project. We have a Innovative Brain Idea Bar Chart Powerpoint Graph Powerpoint Templates that will get it across. Create a connection with your audience using our Innovative Brain Idea Bar Chart Powerpoint Graph Powerpoint Templates. Transfer your depth of knowledge clearly across to them.
-
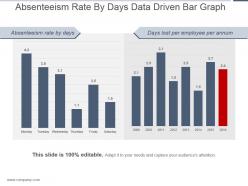 Absenteeism rate by days data driven bar graph powerpoint show
Presenting absenteeism rate by days data driven bar graph powerpoint show. This is a absenteeism rate by days data driven bar graph powerpoint show. This is a two stage process. The stages in this process are absenteeism rate by days, days lost per employee per annum, monday, tuesday, wednesday, thursday, friday, saturday.
-
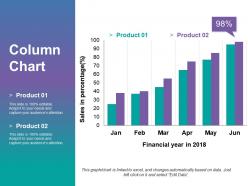 Column chart presentation visuals
Presenting column chart presentation visuals. This is a column chart presentation visuals. This is a six stage process. The stages in this process are sales in percentage, financial year in, graph, business, marketing.
-
 Stacked column presentation pictures
Presenting stacked column presentation pictures. This is a stacked column presentation pictures. This is a nine stage process. The stages in this process are business, marketing, strategy, bar, graph.
-
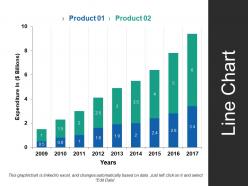 Line chart ppt images gallery template 3
Presenting line chart ppt images gallery template 3. This is a line chart ppt images gallery template 3. This is a two stage process. The stages in this process are product, years, expenditure in, bar chart, growth.
-
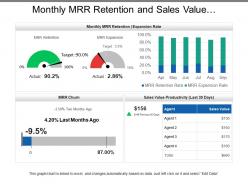 Monthly mrr retention and sales value productivity dashboard
Presenting this set of slides with name - Monthly Mrr Retention And Sales Value Productivity Dashboard. This is a four stage process. The stages in this process are Sales Dashboard, Sales Kpis, Sales Performance.
-
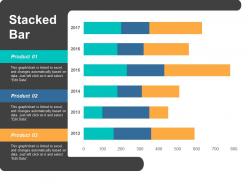 Stacked bar ppt portfolio graphics download
Presenting this set of slides with name - Stacked Bar Ppt Portfolio Graphics Download. This is a three stage process. The stages in this process are Percentage, Product, Business, Management, Marketing.
-
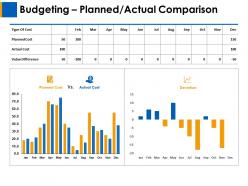 Budgeting planned actual comparison ppt layouts designs download
Presenting this set of slides with name - Budgeting Planned Actual Comparison Ppt Layouts Designs Download. This is a three stage process. The stages in this process are Finance, Analysis, Business, Investment, marketing.
-
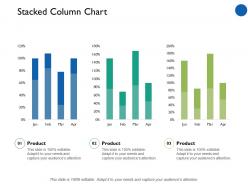 Stacked column chart marketing finance ppt professional example introduction
Presenting this set of slides with name - Stacked Column Chart Marketing Finance Ppt Professional Example Introduction. This is a three stage process. The stages in this process are Finance, Analysis, Business, Investment, Marketing.
-
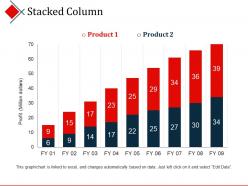 Stacked column presentation layouts
Presenting the Stacked Column Presentation Layouts presentation template which is fully customizable. You can freely access your presentation in both 4:3 and 16:9 aspect ratio. Edit the font, color, font size, and font types of the slides as per your needs. This template is compatible with Google Slides which makes it easily accessible at once. Open and save your presentation in various formats like PDF, JPG, and PNG.
-
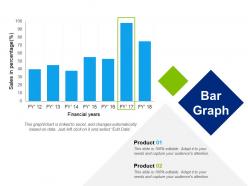 Bar graph powerpoint templates
Presenting this set of slides with name - Bar Graph Powerpoint Templates. This is a two stage process. The stages in this process are Business, Marketing, Finance, Financial Years, Sales In Percentage.
-
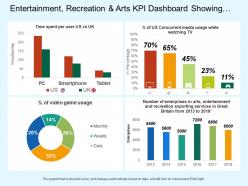 Entertainment recreation and arts kpi dashboard showing of media usage and time spent per user
Presenting this set of slides with name - Entertainment Recreation And Arts Kpi Dashboard Showing Of Media Usage And Time Spent Per User. This is a four stage process. The stages in this process are Entertainment, Recreation And Arts, Attractions, Culture, Entertainment.


