- Sub Categories
-
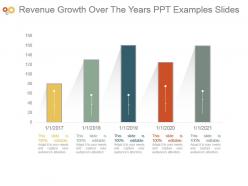 Revenue growth over the years ppt examples slides
Presenting revenue growth over the years ppt examples slides. This is a revenue growth over the years ppt examples slides. This is a five stage process. The stages in this process are business, management, marketing, revenue, growth.
-
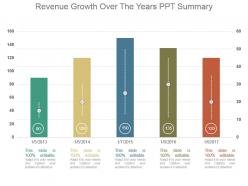 Revenue growth over the years ppt summary
Presenting revenue growth over the years ppt summary. This is a revenue growth over the years ppt summary. This is a five stage process. The stages in this process are business, management, marketing, revenue, strategy.
-
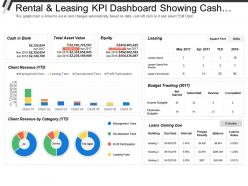 Rental and leasing kpi dashboard showing cash in bank total asset value equity
Presenting this set of slides with name - Rental And Leasing Kpi Dashboard Showing Cash In Bank Total Asset Value Equity. This is a three stage process. The stages in this process are Rental And Leasing, Dealing And Leasing, Rental And Engage.
-
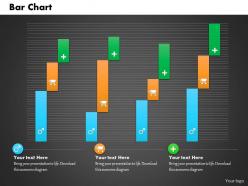 0514 unique pattern sales data driven chart powerpoint slides
We are proud to present our 0514 unique pattern sales data driven chart powerpoint slides. To display sales result analysis use our line chart graphic template. Use this professional business power point template in your presentation and get noticed. Enjoy the fun of presentation making with our great collection.
-
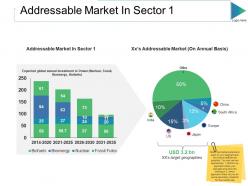 Addressable market in sector ppt slides structure
Presenting this set of slides with name - Addressable Market In Sector Ppt Slides Structure. This is a two stage process. The stages in this process are Addressable Market In Sector, Addressable Market, South Africa, Europe, Japan.
-
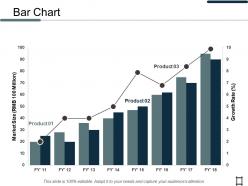 Bar chart business marketing ppt professional design inspiration
Presenting this set of slides with name - Bar Chart Business Marketing Ppt Professional Design Inspiration. This is a three stage process. The stages in this process are Finance, Analysis, Business, Investment, Marketing.
-
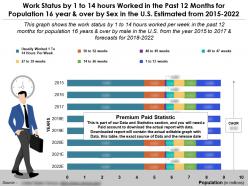 Work status by 1 to 14 hours in past 12 months for 16 year and over by sex in the us from 2015-22
Presenting this set of slides with name - Work Status By 1 To 14 Hours In Past 12 Months For 16 Year And Over By Sex In The US From 2015-22. Work Status By 1 To 14 Hours Worked In The Past 12 Months For Population 16 Year And Over By Sex In The U.S Estimated From 2015 to 2022. This is part of our Data and Statistics products selection, and you will need a Paid account to download the actual report with accurate data. Downloaded report will contain the actual editable graph with the actual data, an excel table with the actual data, the exact source of the data and the release date. This Graph Shows The Work Status By 1 To 14 Hours Worked Per Week In The Past 12 Months For Population 16 Years And Over By Male And Female In The U.S From The Year 2015 To 2017 And Forecasts For 2018 to 2022. It covers topic Work Status By 1 To 14 Hours Worked In U.S for region USA and is for date range 2015 to 22. Download it immediately and use it for your business.
-
 0414 human face dollar bar chart powerpoint graph
We are proud to present our 0414 human face dollar bar chart powerpoint graph. Illuminate the road ahead withour Human Face Dollar Bar Chart Powerpoint Graph Powerpoint Templates. Pinpoint the important landmarks along the way. Blaze a trail with our innovative Human Face Dollar Bar Chart Powerpoint Graph Powerpoint Templates. Clearly mark the path for others to follow.
-
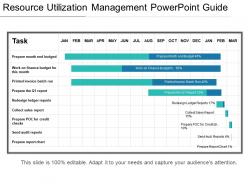 Resource utilization management powerpoint guide
Ease of customization. Replace any words, picture or number provided in the template with your own content and use it for presentation. You may even incorporate your own company’s name and logo in the presentation for personalization. The visuals used are of high resolution, therefore no issue of image pixelation if projected on the wide screen. Moreover, the presentation is compatible with numerous format and software options. Widely used by every business researcher, analyst, company owner, marketer, consultant, academician, and more.
-
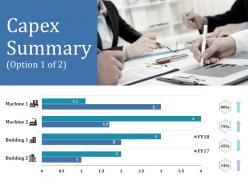 Capex summary ppt outline
Presenting this set of slides with name - Capex Summary Ppt Outline. This is a four stage process. The stages in this process are Capex Summary, Finance, Analysis, Business, Marketing.
-
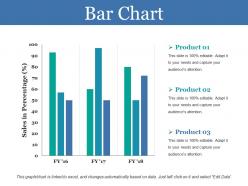 Bar chart ppt model
Presenting this set of slides with name - Bar Chart Ppt Model. This is a three stage process. The stages in this process are Bar Chart, Finance, Analysis, Business, Management.
-
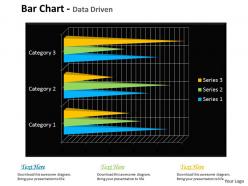 Data driven 3d bar chart for financial markets powerpoint slides
We are proud to present our data driven 3d bar chart for financial markets powerpoint slides. Our Data Driven 3D Bar Chart For Financial Markets Powerpoint slides Power Point Templates Are Aesthetically Designed To Attract Attention. We Guarantee That They Will Grab All The Eyeballs You Need. Our Data Driven 3D Bar Chart For Financial Markets Powerpoint slides Power Point Templates Are Specially Created By A Professional Team With Vast Experience. They Diligently Strive To Come Up With The Right Vehicle For Your Brilliant Ideas.
-
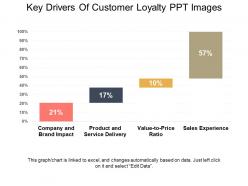 Key drivers of customer loyalty ppt images
Presenting key drivers of customer loyalty ppt images. This is a key drivers of customer loyalty ppt images. This is a four stage process. The stages in this process are company and brand impact, product service delivery, value to price ratio, sales experience.
-
 Combo chart presentation pictures
Presenting this set of slides with name - Combo Chart Presentation Pictures. This is a three stage process. The stages in this process are Business, Marketing, Bar, Finance, Planning.
-
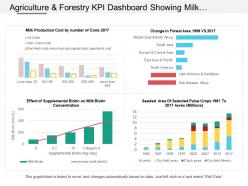 Agriculture and forestry kpi dashboard showing milk production cost by number of cows
Readymade agriculture and forestry KPI dashboard showing milk production cost by number of cows PPT template. Attuned with Microsoft office software’s as well as Google slides. Amend and customize the PPT slide by adding the corporate trademark. Assistance to make changes has been provided in the slide. Useful for sales leaders, marketers, business professionals, analysts, strategists, etc. Effortlessly and fluently adjustable by any user at any time without even having any expertize. Fast to download, share and insert in the presentation.
-
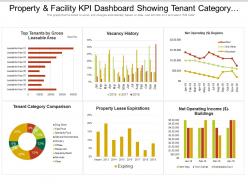 Property and facility kpi dashboard showing tenant category comparison and vacancy history
Get a chance to explore, property and facility KPI dashboard showing tenant category comparison and vacancy history PowerPoint Presentation Slide. This Presentation has been designed by professionals and is fully editable. You can remodel the font size, font type, colors, and even the background. This Template is friendly with Google Slide and can be saved in JPG or PDF format without any chaos created. Fast download at the click of the button.
-
 Logistics dashboard with revenue breakdown and time to market
Presenting Logistics Dashboard With Revenue Breakdown And Time To Market PPT slide. The revenue breakdown dashboard PowerPoint template designed by the professional team of SlideTeam to present the entire plan to clients as well as investors. The bar chart, pie charts, text and image in time to market dashboard slide are customizable in PowerPoint and can help you in sharing the market sale target. The logistics performance dashboard slide is compatible with Google Slide which makes easy for a presenter to present business financial statistics. A user may do changes in the font size, font type, color and dimensions of the charts to present the desired sales value.
-
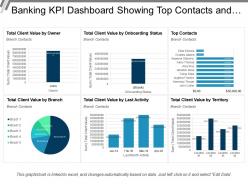 Banking kpi dashboard sowing top contacts and client value
Presenting this set of slides with name - Banking Kpi Dashboard Sowing Top Contacts And Client Value. This is a six stage process. The stages in this process are Banking, Finance, Money.
-
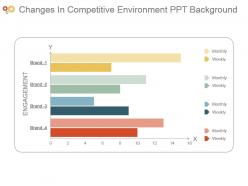 Changes in competitive environment ppt background
Presenting changes in competitive environment ppt background. Presenting changes in competitive environment ppt background. Presenting changes in competitive environment ppt background. This is a changes in competitive environment ppt background. This is four stage process. The stages in this process are engagement, monthly, brand, weekly.
-
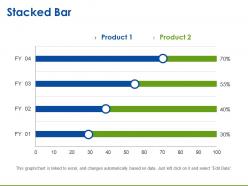 Stacked bar powerpoint show
Presenting stacked bar powerpoint show. This is a stacked bar powerpoint show. This is a four stage process. The stages in this process are stacked bar, finance, marketing, strategy, business, analysis.
-
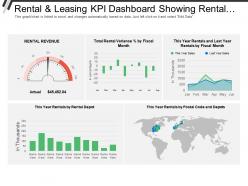 Rental and leasing kpi dashboard showing rental revenue and rental variance percentage
Presenting this set of slides with name - Rental And Leasing Kpi Dashboard Showing Rental Revenue And Rental Variance Percentage. This is a five stage process. The stages in this process are Rental And Leasing, Dealing And Leasing, Rental And Engage.
-
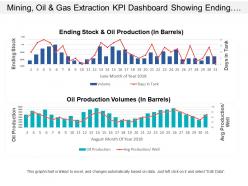 Mining oil and gas extraction kpi dashboard showing ending stock and oil production volumes
Presenting this set of slides with name - Mining Oil And Gas Extraction Kpi Dashboard Showing Ending Stock And Oil Production Volumes. This is a two stage process. The stages in this process are Mining, Oil And Gas Extraction, Refinery, Natural Gas.
-
 Entertainment recreation and arts kpi dashboard average annual expenditure and time spent
Presenting this set of slides with name - Entertainment Recreation And Arts Kpi Dashboard Average Annual Expenditure And Time Spent. This is a three stage process. The stages in this process are Entertainment, Recreation And Arts, Attractions, Culture, Entertainment.
-
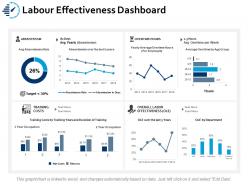 Labour effectiveness dashboard snapshot ppt portfolio format
Presenting this set of slides with name - Labour Effectiveness Dashboard Snapshot Ppt Portfolio Format. This is a four stage process. The stages in this process are Business, Management, Strategy, Sales, Marketing.
-
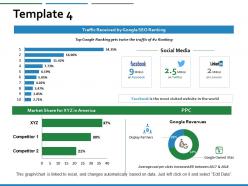 Market share revenue ppt powerpoint presentation inspiration professional
Presenting this set of slides with name - Market Share Revenue Ppt Powerpoint Presentation Inspiration Professional. This is a four stages process. The stages in this process are Bar Graph, Finance, Marketing, Business, Analysis.
-
 0414 illustration of suitcase bar chart powerpoint graph
We are proud to present our 0414 illustration of suitcase bar chart powerpoint graph. Our Illustration Of Suitcase Bar Chart Powerpoint Graph Powerpoint Templates are the essential beat of your lilting melody. Adorn them with your tuneful thoughts and top the charts. Our Illustration Of Suitcase Bar Chart Powerpoint Graph Powerpoint Templates give you a court to play on. Dribble your way along and score a goal.
-
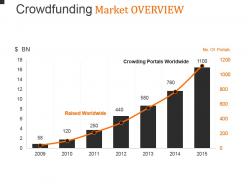 Crowdfunding market overview powerpoint guide
Presenting crowdfunding market overview powerpoint guide. This is a crowdfunding market overview powerpoint guide. This is a seven stage process. The stages in this process are raised worldwide, crowding portals worldwide.
-
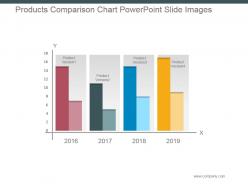 Products comparison chart powerpoint slide images
Presenting products comparison chart powerpoint slide images. This is a products comparison chart powerpoint slide images. This is a four stage process. The stages in this process are product version.
-
 Gross profit margin with financial highlights
Presenting the Gross Profit Margin With Financial Highlights PPT slideshow which is designed professionally for your convenience. Can be changed into formats like PDF, JPG, and PNG. The slide is readily available in both 4:3 and 16:9 aspect ratio. This template is compatible with Google Slides, which makes it accessible at once. You can alter the colors, fonts, font size, and font types of the template as per the requirements.
-
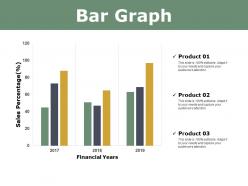 Bar graph ppt powerpoint presentation diagram images
Presenting this set of slides with name - Bar Graph Ppt Powerpoint Presentation Diagram Images. This is a three stage process. The stages in this process are Percentage, Product, Business, Management, Marketing.
-
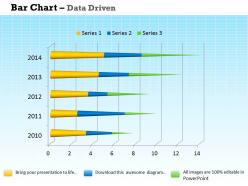 Data driven 3d bar chart for market surveys powerpoint slides
We are proud to present our data driven 3d bar chart for market surveys powerpoint slides. This PowerPoint Layout can explain the relevance of the different stages in getting down to your core competence, ability and desired result. It educates your team with your thoughts and logic.
-
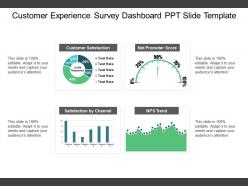 Customer experience survey dashboard ppt slide template
Presenting customer experience survey dashboard ppt slide template. This is a customer experience survey dashboard ppt slide template. This is a four stage process. The stages in this process are survey, forecasting, statistics.
-
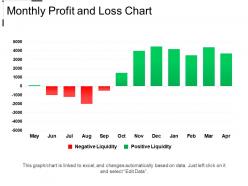 Monthly profit and loss chart example of ppt
Presenting Monthly Profit And Loss Chart Example Of PPT. Get this customizable PPT slide and make amendments in this template to match it with your presentation theme. Alter the colors, background, font size, and font type. Transform and save in various formats. Its adaptability with the Google Slides and the other major Microsoft versions makes it accessible at once. Get this high-resolution graphics template in standard screen size and widescreen size.
-
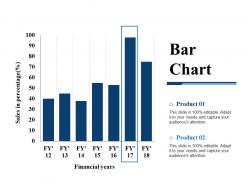 Bar chart ppt templates
Presenting this set of slides with name - Bar Chart Ppt Templates. This is a two stage process. The stages in this process are Bar Chart, Finance, Marketing, Analysis, Strategy, Investment.
-
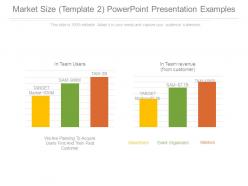 Market size template 2 powerpoint presentation examples
Presenting market size template 2 powerpoint presentation examples. This is a market size template 2 powerpoint presentation examples. This is a two stage process. The stages in this process are target market, advertisers, event organizers, mentors.
-
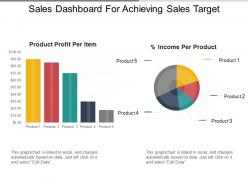 Sales dashboard for achieving sales target ppt templates
SlideTeam would like to introduce all of you with this totally alterable and user-friendly sales dashboard for achieving sales target PPT templates. This PowerPoint presentation is fully editable which allows you to make changes to its predesigned slides. It allows you to change the size, color, and orientation of various features. By simply following the instructions given in the sample slides you can make these changes. The presentation allows you to save it in the format of either JPG or PDF. You can add or delete any given information from the already prepared slides.
-
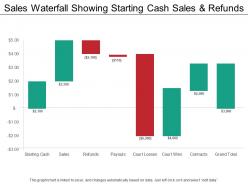 Sales waterfall showing starting cash sales and refunds
Presenting this set of slides with name - Sales Waterfall Showing Starting Cash Sales And Refunds. This is a eight stage process. The stages in this process are Sales Waterfall, Waterfall Chart.
-
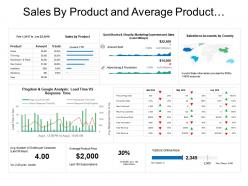 Sales by product and average product price e commerce dashboard
Presenting this set of slides with name - Sales By Product And Average Product Price E Commerce Dashboard. This is a eight stage process. The stages in this process are Mercantilism, Commercialism, Ecommerce.
-
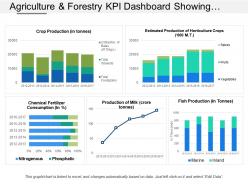 Agriculture and forestry kpi dashboard showing crop production and chemical fertilizers consumptions
Displaying agriculture and forestry KPI dashboard showing crop production and chemical fertilizers consumptions presentation slide. Modify the design with trademark and picture. PowerPoint diagram is well-matched with Google slides. Colors and text can be amended as the PPT graphic comes with easy to use editing options. Presentation design can be delivered in both standard and widescreen display view. Flexible with other software options such as PDF or JPG formats as can be converted effortlessly.
-
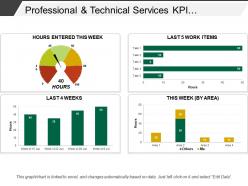 Professional and technical services kpi dashboard snapshot showing timesheet
Presenting this set of slides with name - Professional And Technical Services Kpi Dashboard Snapshot Showing Timesheet. This is a four stage process. The stages in this process are Professional And Technical Services, Services Management, Technical Management.
-
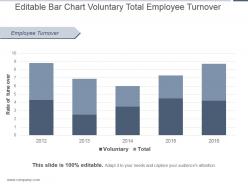 Editable bar chart voluntary total employee turnover ppt icon
Presenting editable bar chart voluntary total employee turnover ppt icon. This is a editable bar chart voluntary total employee turnover ppt icon. This is a five stage process. The stages in this process are employee turnover, rate of turn over, voluntary, total.
-
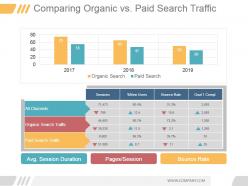 Comparing organic vs paid search traffic ppt background
Presenting comparing organic vs paid search traffic ppt background. This is a comparing organic vs paid search traffic ppt background. This is a four stage process. The stages in this process are all channels, organic search traffic, paid search traffic, avg session duration, pages session, bounce rate, sessions, new users, bounce rate, goal 1 compl, organic search, paid search.
-
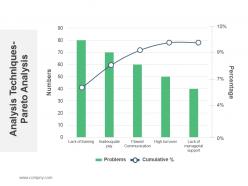 Analysis techniques pareto analysis ppt sample
Presenting analysis techniques pareto analysis ppt sample. This is a analysis techniques pareto analysis ppt sample. This is a five stage process. The stages in this process are analysis techniques pareto analysis.
-
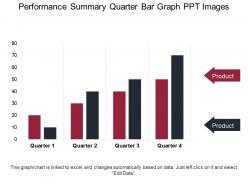 Performance summary quarter bar graph ppt images
Presenting Performance Summary Quarter Bar Graph PPT Images. Customize the slide as per your needs. Match it to your organizational presentation theme. Alter the colors, font style, font type and the background of the slide. The slide can be saved into formats like JPG, JPEG, PNG and PDF file formats. It goes well with the Google Slides and with the major Microsoft versions. Can be viewed on a standard screen and widescreen size because of its splendid pixel quality.
-
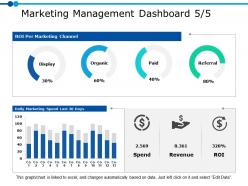 Marketing management dashboard 5 5 ppt powerpoint presentation gallery graphics
Presenting this set of slides with name - Marketing Management Dashboard 5 5 Ppt Powerpoint Presentation Gallery Graphics. This is a three stage process. The stages in this process are Business, Management, Strategy, Analysis, Marketing.
-
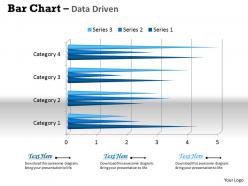 Data driven 3d bar chart for business trends powerpoint slides
We are proud to present our data driven 3d bar chart for business trends powerpoint slides. This PowerPoint chart can be used to illustrate many types of data. It should be used to make facts clearer and more understandable. Quick way for the audience to visualize what you are saying numbers trends up or down .
-
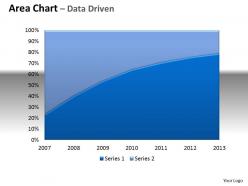 Data driven area chart with plotted line in center powerpoint slides
We are proud to present our data driven area chart with plotted line in center powerpoint slides. Seamlessly Flow From Idea To Idea. Our Data Driven Area Chart With Plotted Line In Center Powerpoint Slides Power Point Templates Give You The Threads To Weave. Ride The Surf With Our Data Driven Area Chart With Plotted Line In Center Powerpoint Slides Power Point Templates. They Will Keep You Upright Till You Hit The Shore.
-
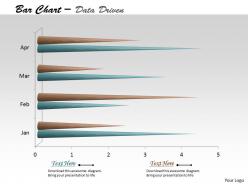 Data driven 3d time based bar chart powerpoint slides
We are proud to present our data driven 3d time based bar chart powerpoint slides. Whatever The Nuance You Want To Project. We Have A 3D Data Driven Time Based Bar Chart Powerpoint slides Power Point Templates That Will Get It Across. Create A Connection With Your Audience Using Our 3D Data Driven Time Based Bar Chart Powerpoint slides Power Point Templates. Transfer Your Depth Of Knowledge Clearly Across To Them.
-
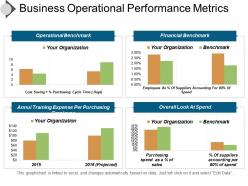 Business operational performance metrics ppt slide
Presenting business operational performance metrics PPT slide. PPT can be easily updated by anyone. Our professional PPT experts are available to support you in updating the design. Modify and personalize as per your business preferences. PPT is compatible with Google Slides and Microsoft PowerPoint. Instant and quick downloading is available. Download and convert the design into JPEG and PDF formats.
-
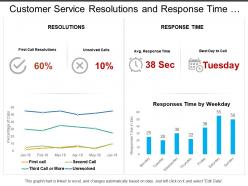 Customer service resolutions and response time dashboard
Presenting customer service resolutions and response time dashboard PPT template slide. This template slide is fully adjustable with Google Slide. You can edit the color, text style, font size of the template content as per need. The template is easy to download and can be saved in PDF, and JPEG formats. For guidance, additional instructional slides are available. Superior quality graphics are used. The quality of the slide image does not blur when viewed on a large screen. Dummy content can be replaced with other valuable information. You can personalize the template by adding your company name, and signature.
-
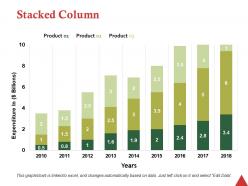 Stacked column ppt professional rules
Presenting this set of slides with name - Stacked Column Ppt Professional Rules. This is a three stage process. The stages in this process are Business, Management, Strategy, Analysis, Marketing.
-
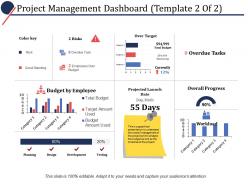 Project management dashboard ppt powerpoint presentation file graphic images
Presenting this set of slides with name - Project Management Dashboard Ppt Powerpoint Presentation File Graphic Images. This is a four stage process. The stages in this process are Business, Management, Marketing, Percentage, Product.
-
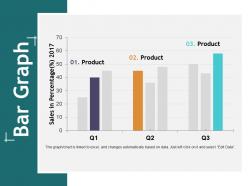 Bar graph ppt show graphic images
Presenting this set of slides with name - Bar Graph Ppt Show Graphic Images. This is a three stage process. The stages in this process are Business, Management, Strategy, Analysis, Marketing.
-
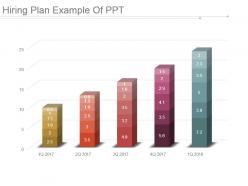 Hiring plan example of ppt
Presenting hiring plan example of ppt. Presenting hiring plan example of ppt. Presenting hiring plan example of ppt. This is a hiring plan example of ppt. This is five stage process. The stages in this process are business, growth, finance, marketing, strategy, analysis.
-
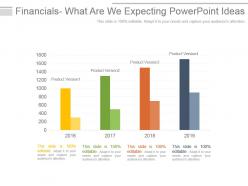 Year based financial analysis powerpoint ideas
Presenting year based financial analysis powerpoint ideas. This is a year based financial analysis powerpoint ideas. This is a four stage process. The stages in this process are product version, business, marketing, process, success.
-
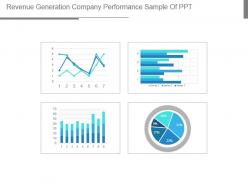 Revenue generation company performance sample of ppt
Presenting revenue generation company performance sample of ppt. This is a revenue generation company performance sample of ppt. This is a four stage process. The stages in this process are business, marketing, graph, percentage, success.
-
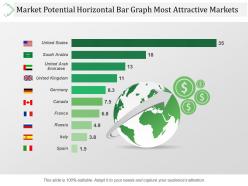 Market potential horizontal bar graph most attractive markets ppt images
Presenting market potential horizontal bar graph most attractive markets ppt images. This is a market potential horizontal bar graph most attractive markets ppt images. This is a two stage process. The stages in this process are business, marketing, strategy, finance, investment, success, location, geography.
-
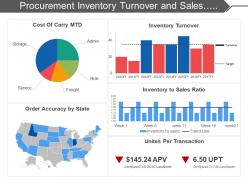 Procurement inventory turnover and sales ratio dashboard
Presenting this set of slides with name - Procurement Inventory Turnover And Sales Ratio Dashboard. This is a five stage process. The stages in this process are Purchase, Procurement, Buy.
-
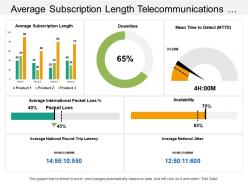 Average subscription length telecommunications dashboard
Presenting this set of slides with name - Average Subscription Length Telecommunications Dashboard. Pre-designed presentation slide can be shared easily as comes in both standard and widescreen view. Fully amendable PowerPoint design can be modified as per your preference. Picture quality is perfect as pixels remain same even when you share with large number of audiences. PPT template can be downloaded with different nodes and stages and well accustomed with all the software’s options such as JPG and PDF and even with Google slides.
-
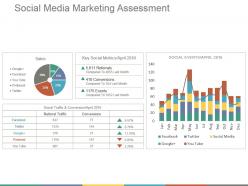 Social media marketing assessment ppt background designs
Presenting the social media marketing PowerPoint PPT. This slide is fully customizable PowerPoint template to communicate your ideas clearly. You can easily edit the charts and graphs in excel sheet. This presentation slide is designed with elegant shapes and visuals. You can convert this slide into numerous format options like JPEG, JPG or PDF. This template gives a professional outlook to your PowerPoint presentation. It is easy to customize each graphics and text as per your need. You can download it easily at a click of button.


