- Sub Categories
-
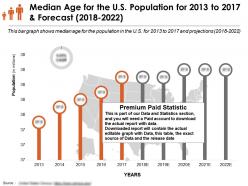 Median age for the us population for 2013-2022
Presenting this set of slides with name - Median Age For The US Population For 2013-2022. Median Age for the U.S. Population for 2013 to 2017 and Forecast 2018 to 2022. This is part of our Data and Statistics products selection, and you will need a Paid account to download the actual report with accurate data. Downloaded report will contain the actual editable graph with the actual data, an excel table with the actual data, the exact source of the data and the release date. This bar graph shows median age for the population in the U.S. for 2013 to 2017 and projections 2018 to 2022. It covers topic Median Age for population for region USA and is for date range 2013 to 2022. Download it immediately and use it for your business.
-
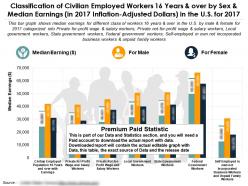 Classification of civilian workers 16 years and over by median earnings in the us for the year 2017
Presenting this set of slides with name - Classification Of Civilian Workers 16 Years And Over By Median Earnings In The Us For The Year 2017. Classification of Civilian Employed Workers 16 years and over by Sex and Median Earnings in 2017 inflation adjusted dollars in the U.S. for 2017. This is part of our Data and Statistics products selection, and you will need a Paid account to download the actual report with accurate data. Downloaded report will contain the actual editable graph with the actual data, an excel table with the actual data, the exact source of the data and the release date. This bar graph shows median earnings for different class of workers 16 years and over in the U.S. by male and female for 2017. It covers topic Median Earnings of Civilan Employed Workers for region U.S.A and is for date range 2017. Download it immediately and use it for your business.
-
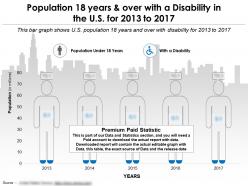 Population 18 years and over with a disability in the us for 2013-2017
Presenting this set of slides with name - Population 18 Years And Over With A Disability In The US For 2013-2017. Population 18 years and over with a disability in the U.S. for 2013 to 2017. This is part of our Data and Statistics products selection, and you will need a Paid account to download the actual report with accurate data. Downloaded report will contain the actual editable graph with the actual data, an excel table with the actual data, the exact source of the data and the release date. This bar graph shows U.S. population 18 years and over with disability for 2013 to 2017. It covers topic 18 and Above Population with Disability for region USA and is for date range 2013 TO 2017. Download it immediately and use it for your business.
-
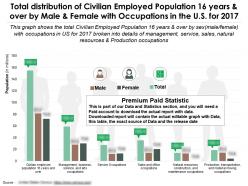 Distribution of civilian population 16 years and over by sex with occupations in the us for 2017
Presenting this set of slides with name - Distribution Of Civilian Population 16 Years And Over By Sex With Occupations In The US For 2017. Total distribution of Civilian Employed Population 16 years and over by Male and Female with Occupations in the U.S. for 2017. This is part of our Data and Statistics products selection, and you will need a Paid account to download the actual report with accurate data. Downloaded report will contain the actual editable graph with the actual data, an excel table with the actual data, the exact source of the data and the release date. This graph shows the Total Civilian Employed Population 16 years and over by sex male female with Occupations in US for 2017 broken into details of management, service, sales, natural resources and Production occupations. It covers topic Distribution of Population with Occupations by Sex for region USA and is for date range 2015 TO 17. Download it immediately and use it for your business.
-
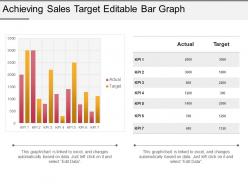 Achieving sales target editable bar graph sample of ppt
PPT design template can instantly be downloaded and converted into JPEG and PDF formats. You can open the slideshow on normal and full screen design view. Design quality will remain unchanged when design is opened on full screen design view. You can edit the slideshow the way you want. All the design components such as font type, size, color, shape, style etc are fully editable.
-
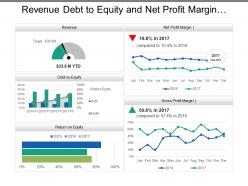 Revenue debt to equity and net profit margin sales dashboard
Presenting this set of slides with name - Revenue Debt To Equity And Net Profit Margin Sales Dashboard. This is a five stage process. The stages in this process are Sales Dashboard, Sales Kpis, Sales Performance.
-
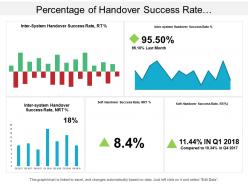 Percentage of handover success rate telecommunications dashboard
Presentation slide has eye-catching and engaging quality. PPT template is familiar with Google slides. Easy to download and saves a lot of time. PowerPoint design is quick to download and easy to share. Decorate it by adding corporation designation and image. Presentation graphic provides adjustment in text, color and design. Presentation is easy to showcase in both standard and widescreen view. Resolution PowerPoint design with great picture quality. Design compatible with other softwares.
-
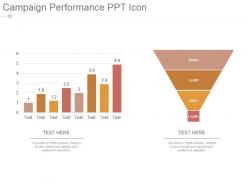 Campaign performance ppt icon
Presenting campaign performance ppt icon. Presenting campaign performance ppt icon. This is a campaign performance ppt icon. This is a two stage process. The stages in this process are leads, brand, sales, loyalty.
-
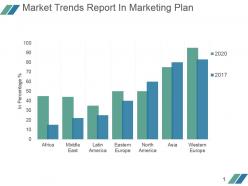 Market trends report in marketing plan powerpoint slide designs
Presenting market trends report in marketing plan powerpoint slide designs. This is a market trends report in marketing plan powerpoint slide designs. This is a seven stage process. The stages in this process are africa, middle east, latin america, eastern europe, north america, asia, western europe, in percentage.
-
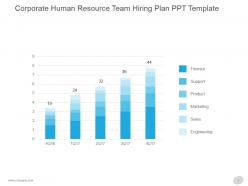 Corporate human resource team hiring plan ppt template
Presenting corporate human resource team hiring plan ppt template. This is a corporate human resource team hiring plan ppt template. This is a five stage process. The stages in this process are finance, support, product, marketing, sales, engineering.
-
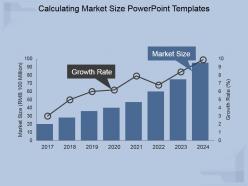 Calculating market size powerpoint templates
Presenting calculating market size powerpoint templates. This is a calculating market size powerpoint templates. This is a eight stage process. The stages in this process are growth rate, market size.
-
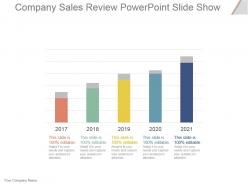 Company sales review powerpoint slide show
Presenting company sales review powerpoint slide show. This is a company sales review powerpoint slide show. This is a five stage process. The stages in this process are business,strategy,chart and graph,time planning.
-
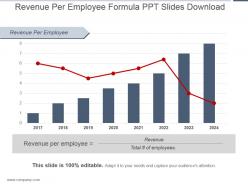 Revenue per employee formula ppt slides download
Presenting revenue per employee formula ppt slides download. This is a revenue per employee formula ppt slides download. This is a eight stage process. The stages in this process are revenue per employee, revenue, total of employees.
-
 Resource utilisation showing capacity budgets and plans
Presenting this set of slides with name - Resource Utilisation Showing Capacity Budgets And Plans. This is a three stage process. The stages in this process are Resource Management, Resource Utilization, Resource Allocation.
-
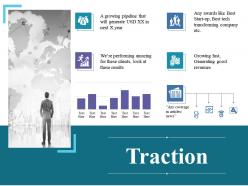 Traction ppt example file
Presenting this set of slides with name - Traction Ppt Example File. This is a six stage process. The stages in this process are Business, Traction, Marketing, Graph, Finance.
-
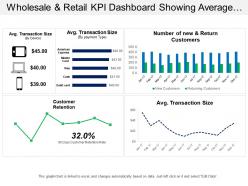 Wholesale and retail kpi dashboard showing average transaction size and customer retention
Presenting this set of slides with name - Wholesale And Retail Kpi Dashboard Showing Average Transaction Size And Customer Retention. This is a four stage process. The stages in this process are Wholesale And Retail, Extensive And Retail, Wholesale And Distribute.
-
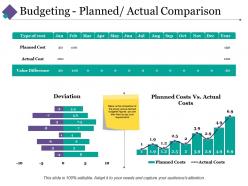 Budgeting planned actual comparison ppt pictures clipart images
Providing budgeting planned actual comparison PPT pictures clipart images. Presentation design can be shared in standard and widescreen view. High resolution ensures no pixel break even when shared with large viewers. PowerPoint template can be amended as required and transform into JPG and PDF format. Fully adjustable design with Google Slides as merge well. Ideas to share business communication effectively Easy to adapt and download with different nodes and stages.
-
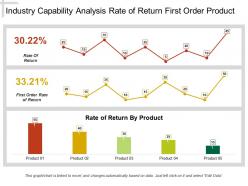 Industry capability analysis rate of return first order product
The biggest advantage of this industry capability slideshow is it’s linking to excel; you can put your business figures into excel sheet and it will automatically get changed in the charts on PPT design. The design slide is 100% editable; you can modify and personalize the design according to your business needs. The slides are compatible with Google Slides and MS PowerPoint software. Slides are fully supported on full screen and standard view.
-
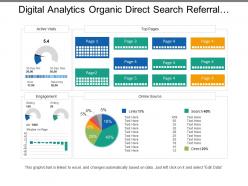 Digital analytics organic direct search referral social ppt example
Presenting this set of slides with name - Digital Analytics Organic Direct Search Referral Social Ppt Example. This is a five stage process. The stages in this process are Digital Analytics, Digital Dashboard, Digital Kpis.
-
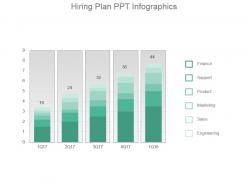 Hiring plan ppt infographics
Presenting hiring plan ppt infographics. Presenting hiring plan ppt infographics. Presenting hiring plan ppt infographics. This is a hiring plan ppt infographics. This is five stage process. The stages in this process are finance, support, product, marketing, sales, engineering.
-
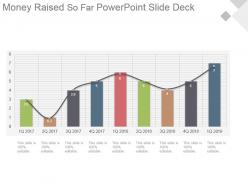 Money raised so far powerpoint slide deck
Presenting money raised so far powerpoint slide deck. This is a money raised so far powerpoint slide deck. This is a nine stage process. The stages in this process are business, marketing, growth, rising, management.
-
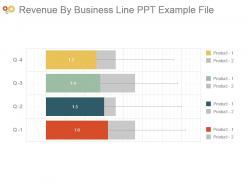 Revenue by business line ppt example file
Presenting revenue by business line ppt example file. This is a revenue by business line ppt example file. This is a four stage process. The stages in this process are business, management, marketing, revenue, strategy.
-
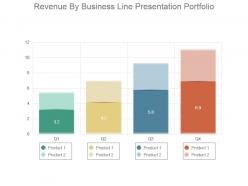 Revenue by business line presentation portfolio
Presenting revenue by business line presentation portfolio. This is a revenue by business line presentation portfolio. This is a four stage process. The stages in this process are business, management, marketing, revenue, portfolio.
-
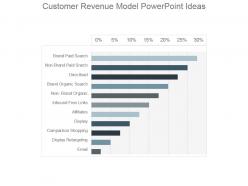 Customer revenue model powerpoint ideas
Presenting customer revenue model powerpoint ideas. This is a customer revenue model powerpoint ideas. This is a eleven stage process. The stages in this process are brand paid search, non brand paid search, directload, brand organic search, non brand organic, inbound free links, affiliates, display, comparison shopping, display retargeting, email.
-
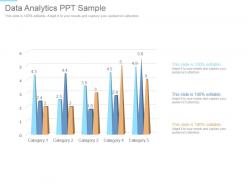 Data analytics ppt sample
Presenting data analytics ppt sample. This is a data analytics ppt sample. This is a five stage process. The stages in this process are business, marketing, analysis, strategy, success, management.
-
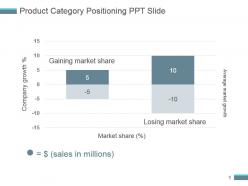 Product category positioning ppt slide
Presenting product category positioning ppt slide. This is a product category positioning ppt slide. This is a two stage process. The stages in this process are gaining market share, losing market share, average market growth, company growth, market share, sales in millions.
-
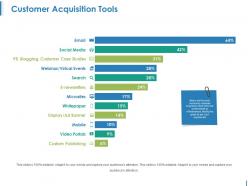 Customer acquisition tools powerpoint templates
Presenting this set of slides with name - Customer Acquisition Tools Powerpoint Templates. This is a twelve stage process. The stages in this process are Business, Finance, Analysis, Investment, Icons, Marketing.
-
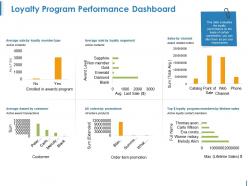 Loyalty program performance dashboard ppt icon
Presenting this set of slides with name - Loyalty Program Performance Dashboard Ppt Icon. This is a six stage process. The stages in this process are Business, Bar Graph, Finance, Strategy, Analysis.
-
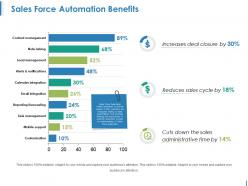 Sales force automation benefits ppt ideas
Presenting this set of slides with name - Sales Force Automation Benefits Ppt Ideas. This is a three stage process. The stages in this process are Bar Graph, Finance, Analysis, Business, Marketing.
-
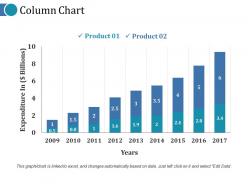 Column chart ppt diagrams
Presenting this set of slides with name - Column Chart Ppt Diagrams. This is a two stage process. The stages in this process are Column Chart, Finance, Business, Marketing, Analysis.
-
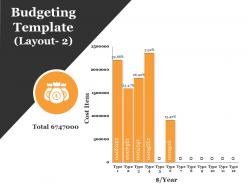 Budgeting template ppt topics
Presenting this set of slides with name - Budgeting Template Ppt Topics. This is a five stage process. The stages in this process are Bar Chart, Finance, Marketing, Analysis, Business.
-
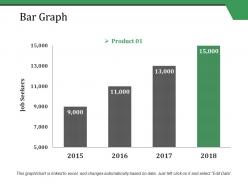 Bar graph ppt styles information
Presenting this set of slides with name - Bar Graph Ppt Styles Information. This is a one stage process. The stages in this process are Job Seekers, Graph, Years, Business, Marketing.
-
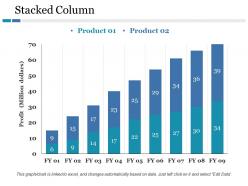 Stacked column ppt icon backgrounds
Presenting this set of slides with name - Stacked Column Ppt Icon Backgrounds. This is a two stage process. The stages in this process are Product, Unit Count, Step, Business, Marketing.
-
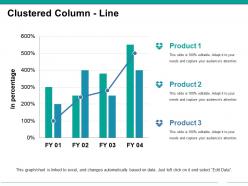 Clustered column line ppt example
Presenting this set of slides with name - Clustered Column Line Ppt Example. This is a four stage process. The stages in this process are Business, Marketing, Planning, Finance, Bar Graph.
-
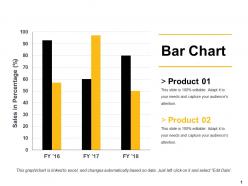 Bar chart ppt professional
Presenting this set of slides with name - Bar Chart Ppt Professional. This is a two stage process. The stages in this process are Bar Chart, Analysis, Finance, Marketing, Business.
-
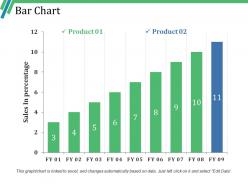 Bar chart ppt slide templates
Presenting this set of slides with name - Bar Chart Ppt Slide Templates. This is a two stage process. The stages in this process are Business, Marketing, Strategy, Finance, Sales In Percentage.
-
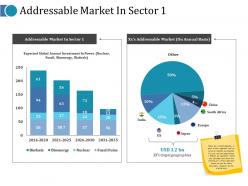 Addressable market in sector 1 ppt inspiration model
Presenting this set of slides with name - Addressable Market In Sector 1 Ppt Inspiration Model. This is a two stage process. The stages in this process are Biofuels, Fossil Fuels, Bioenergy, Nuclear, Other.
-
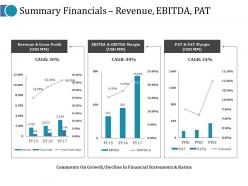 Summary financials revenue ebitda pat ppt pictures design inspiration
Presenting this set of slides with name - Summary Financials Revenue Ebitda Pat Ppt Pictures Design Inspiration. This is a three stage process. The stages in this process are Revenue And Gross Profit, Comments On Growth, Ebitda, Column.
-
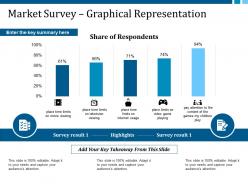 Market survey graphical representation ppt gallery clipart images
Presenting this set of slides with name - Market Survey Graphical Representation Ppt Gallery Clipart Images. This is a five stage process. The stages in this process are Share Of Respondents, Highlights, Survey Result, Place Time Limits On Movie Viewing.
-
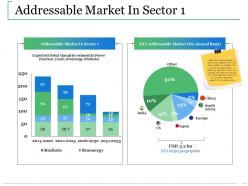 Addressable market in sector ppt slides visuals
Presenting this set of slides with name - Addressable Market In Sector Ppt Slides Visuals. This is a two stage process. The stages in this process are Addressable Market In Sector, China, South Africa, Japan, Europe.
-
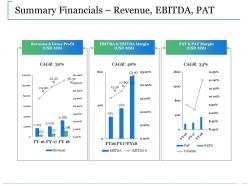 Summary financials revenue ebitda pat ppt slides ideas
Presenting this set of slides with name - Summary Financials Revenue Ebitda Pat Ppt Slides Ideas. This is a three stage process. The stages in this process are Revenue And Gross Profit, Ebitda And Ebitda Margin, Pat And Pat Margin, Business, Marketing.
-
 Revenue split by product and segment ppt icon aids
Presenting this set of slides with name - Revenue Split By Product And Segment Ppt Icon Aids. This is a two stage process. The stages in this process are Revenue By Product, Revenue By Segment, Alloy Steal, Stainless Steal, Carbon Steal.
-
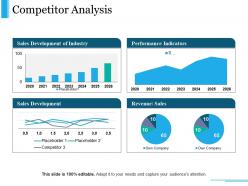 Competitor analysis ppt sample file
Presenting this set of slides with name - Competitor Analysis Ppt Sample File. This is a four stage process. The stages in this process are Sales Development of Industry, Performance Indicators, Sales Development, Revenue Sales.
-
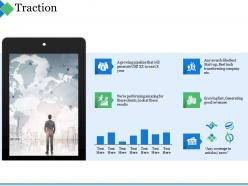 Traction ppt summary gallery
Presenting this set of slides with name - Traction Ppt Summary Gallery. This is a six stage process. The stages in this process are Traction, Business, Marketing, Graph, Strategy.
-
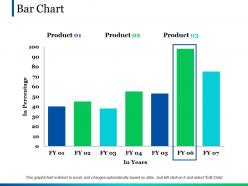 Bar chart ppt pictures guidelines
Presenting this set of slides with name - Bar Chart Ppt Pictures Guidelines. This is a three stage process. The stages in this process are Business, Management, Strategy, Analysis, Marketing.
-
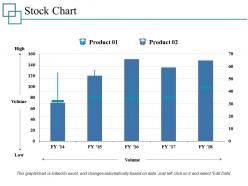 Stock chart ppt professional example introduction
Presenting this set of slides with name - Stock Chart Ppt Professional Example Introduction. This is a two stage process. The stages in this process are Business, Management, Strategy, Analysis, Marketing.
-
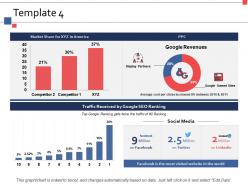 Template 4 ppt inspiration design ideas
Presenting this set of slides with name - Template 4 Ppt Inspiration Design Ideas. This is a four stage process. The stages in this process are Business, Management, Strategy, Analysis, Marketing.
-
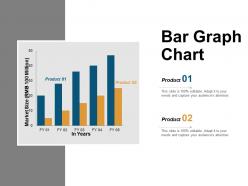 Bar graph chart ppt powerpoint presentation model samples
Presenting this set of slides with name - Bar Graph Chart Ppt Powerpoint Presentation Model Samples. This is a two stage process. The stages in this process are Business, Management, Strategy, Analysis, Marketing.
-
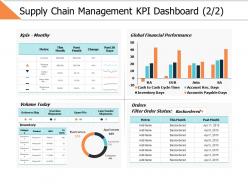 Supply chain management kpi dashboard 2 2 ppt powerpoint presentation gallery visuals
Presenting this set of slides with name - Supply Chain Management Kpi Dashboard 2 2 Ppt Powerpoint Presentation Gallery Visuals. This is a two stage process. The stages in this process are Business, Management, Strategy, Analysis, Finance.
-
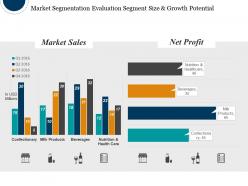 Market segmentation evaluation segment size and growth potential ppt background
Presenting Market Segmentation Evaluation Segment Size And Growth Potential PPT Background icon. The layout is easy to download and can be saved in numerous images or document formats like JPEG and PDF. The slide supports both the standard and widescreen aspect ratios. It is compatible with Google Slides and other office suites. You can modify the style, size, and the background of the slides. High-quality graphics will ensure that quality of any component is not hampered.
-
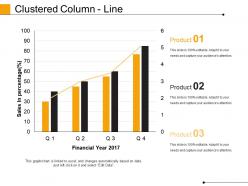 Clustered column line powerpoint slide designs download
Presenting clustered column line powerpoint slide designs download. This is a clustered column line powerpoint slide designs download. This is a three stage process. The stages in this process are bar graph, product, financial year, sales in percentage.
-
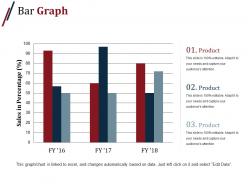 Bar graph powerpoint presentation examples
Presenting Bar Graph PowerPoint Presentation Examples which is designed professionally for your convenience. Open and save your presentation into formats like PDF, JPG, and PNG. The slide is easily available in both 4:3 and 16:9 aspect ratio. You can customize the colors, fonts, font size, and font types of the template as per the business requirements. It is compatible with Google Slides, which makes it accessible at once.
-
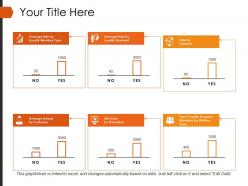 Your title here ppt presentation examples
Presenting your title here ppt presentation examples. This is a your title here ppt presentation examples. This is a six stage process. The stages in this process are average sale by loyalty member type, average sale by loyalty segment, sale by channel, average award by customer, all order by promotion.
-
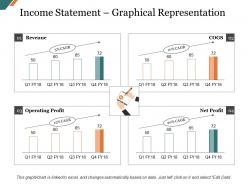 Income statement graphical representation presentation slides
Presenting this set of slides with name - Income Statement Graphical Representation Presentation Slides. This is a four stage process. The stages in this process are Revenue, Cogs, Operating Profit, Net Profit.
-
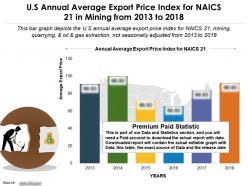 Us annual average export price index for naics 21 in mining from 2013-2018
Presenting this set of slides with name - US Annual Average Export Price Index For Naics 21 In Mining From 2013-2018. US Annual Average export price index for NAICS 21 in Mining from 2013 to 2018. This is part of our Data and Statistics products selection, and you will need a Paid account to download the actual report with accurate data. Downloaded report will contain the actual editable graph with the actual data, an excel table with the actual data, the exact source of the data and the release date. This bar Graph depicts the US Annual Average export price index for NAICS 21, Mining, quarrying, and oil and gas extraction, not seasonally adjusted from 2013 to 2018. It covers topic US Average export price index for region USA and is for date range 2013 TO 2018. Download it immediately and use it for your business.
-
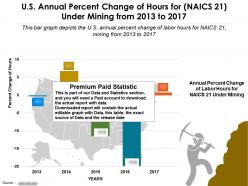 Us annual percent change of hours for naics 21 under mining from 2013-2017
Presenting this set of slides with name - US Annual Percent Change Of Hours For Naics 21 Under Mining From 2013-2017. US Annual percent change of hours for NAICS 21 under Mining from 2013 to 2017. This is part of our Data and Statistics products selection, and you will need a Paid account to download the actual report with accurate data. Downloaded report will contain the actual editable graph with the actual data, an excel table with the actual data, the exact source of the data and the release date. This bar Graph depicts the US Annual percent change of Labor hours for NAICS 21 mining from 2013 to 2017. It covers topic Annual percent change of Labor hours for region USA and is for date range 2013 TO 2017. Download it immediately and use it for your business.
-
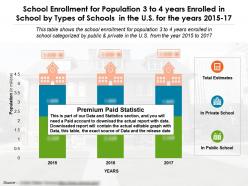 School enrollment for population 3 to 4 years enrolled in school by types of schools us years 2015-17
Presenting this set of slides with name - School Enrollment For Population 3 To 4 Years Enrolled In School By Types Of Schools US Years 2015-17. School Enrollment For Population 3 To 4 Years Enrolled In School By Types Of Schools In The U.S For The Years 2015 to 17. This is part of our Data and Statistics products selection, and you will need a Paid account to download the actual report with accurate data. Downloaded report will contain the actual editable graph with the actual data, an excel table with the actual data, the exact source of the data and the release date. This Table Shows The School Enrollment For Population 3 To 4 Years Enrolled In School Categorized By Public And Private In The U.S From The Year 2015 To 2017. It covers topic School Enrollment for 3 to 4 years for region USA and is for date range 2015 to 17. Download it immediately and use it for your business.
-
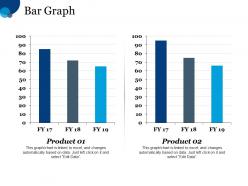 Bar graph finance marketing management investment analysis
Presenting this set of slides with name - Bar Graph Finance Marketing Management Investment Analysis. This is a two stage process. The stages in this process are Finance, Marketing, Management, Investment, Analysis.
-
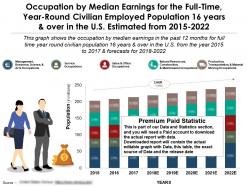 Occupation by median earnings for the full time year round 16 years over in us 2015-22
Presenting this set of slides with name - Occupation By Median Earnings For The Full Time Year Round 16 Years Over In US 2015-22. Occupation By Median Earnings For The Full Time Year Round Civilian Employed Population 16 Years And Over In The U.S Estimated From 2015 TO 2022. This is part of our Data and Statistics products selection, and you will need a Paid account to download the actual report with accurate data. Downloaded report will contain the actual editable graph with the actual data, an excel table with the actual data, the exact source of the data and the release date. This graph shows the Occupation by Median Earnings in the past 12 months for full time year round civilian population 16 years and over in the U.S from the year 2015 to 2017 and forecasts for 2018 TO 2022 . It covers topic Occupation by Median earnings for 16 years and over for region USA and is for date range 2015 TO 22. Download it immediately and use it for your business.
-
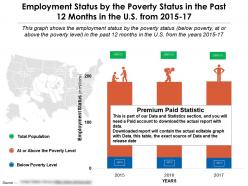 Employment status by the poverty status in the past 12 months in the us from 2015-17
Presenting this set of slides with name - Employment Status By The Poverty Status In The Past 12 Months In The US From 2015-17. Employment Status By The Poverty Status In The Past 12 Months In The U.S From 2015 to 17. This is part of our Data and Statistics products selection, and you will need a Paid account to download the actual report with accurate data. Downloaded report will contain the actual editable graph with the actual data, an excel table with the actual data, the exact source of the data and the release date. This graph shows the employment status by the poverty status below poverty at or above the poverty level in the past 12 months in the U.S from the years 2015 to 17. It covers topic Employment status by poverty status in past 12 months for region USA and is for date range 2015 to 17. Download it immediately and use it for your business.


