- Sub Categories
-
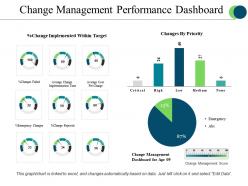 Change management performance dashboard powerpoint slide designs
Presenting change management performance dashboard powerpoint slide designs. This is a change management performance dashboard powerpoint slide designs. This is a three stage process. The stages in this process are critical, high, low, medium, none.
-
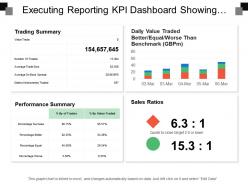 Executing reporting kpi dashboard showing trading summary performance summary and sales ratio
Presenting this set of slides with name - Executing Reporting Kpi Dashboard Showing Trading Summary Performance Summary And Sales Ratio. This is a four stage process. The stages in this process are Executive Reporting, Executive Analysis, Executive Performance.
-
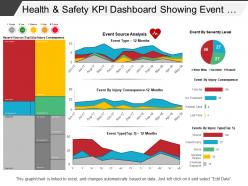 Health and safety kpi dashboard showing event source analysis
Presenting the colorful dashboard presentation layout. This modern dashboard design is fully editable and is created under the strict supervision of professionals. You can bring changes to the objects in the slide like font size and font color hassle-free. This presentation slide is fully compatible with Google Slide and can be saved in JPG or PDF file format without any hassle. Fast download this at the click of the button.
-
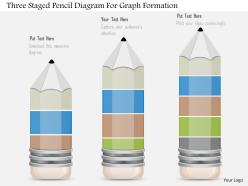 1214 three staged pencil diagram for graph formation powerpoint slide
We are proud to present our 1214 three staged pencil diagram for graph formation powerpoint slide. Three staged pencil diagram has been used to craft this power point template slide. This PPT contains the concept of graph formation. This PPT slide is usable for education and business related presentations.
-
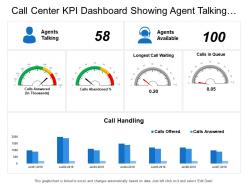 Call center kpi dashboard showing agent talking longest call waiting call handling
Presenting this set of slides with name - Call Center Kpi Dashboard Showing Agent Talking Longest Call Waiting Call Handling. This is a five stage process. The stages in this process are Call Center Agent, Customer Care, Client Support.
-
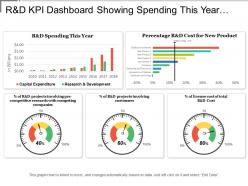 R and d kpi dashboard showing spending this year and cost for new product
Presenting this set of slides with name - R And D Kpi Dashboard Showing Spending This Year And Cost For New Product. This is a five stage process. The stages in this process are R And D, Research And Development, Research And Technological Development.
-
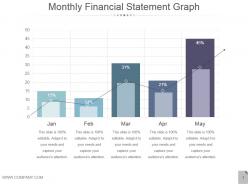 Monthly financial statement graph ppt examples slides
Presenting monthly financial statement graph ppt examples slides. This is a monthly financial statement graph ppt examples slides. This is a two stage process. The stages in this process are jan, feb, mar, apr, may.
-
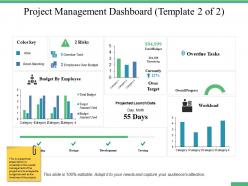 Project management dashboard snapshot ppt professional graphic images
Presenting this set of slides with name - Project Management Dashboard Snapshot Ppt Professional Graphic Images. This is a four stage process. The stages in this process are Percentage, Product, Management, Marketing, Business.
-
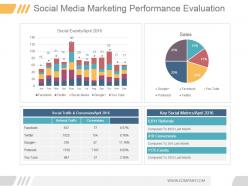 Social media marketing performance evaluation ppt diagrams
Presenting social media marketing performance evaluation ppt diagrams. This is a social media marketing performance evaluation ppt diagrams. This is a four stage process. The stages in this process are social event april, facebook, twitter, social media, google, you tube, jan, feb, mar, apr, may, jun, jul, aug, sep, oct, nov, dec, social traffic and conversion april 2016, referral traffic, conversions, pinterest, sales, key social metrics april 2016, referral traffic, conversions, pinterest, sales, key social metrics april, referrals, compared to 4655 last month, conversions, compared to 354 last month, events, compared to 1052 last month.
-
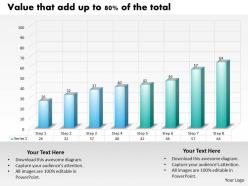 0414 progress in 8 steps column chart powerpoint graph
Runs very well with softwares and is compatible with Google slides. Easy to download and consumes less space. Company’s name logo and trademark can be inserted. Picture graphics do not pixilate even when shown on a bigger screen. No space constraints while mentioning titles and sub-titles. Changeable orientation, font text, design and color. Convertible into PDF and JPEG. Useful for professionals preparing any progress related presentation.
-
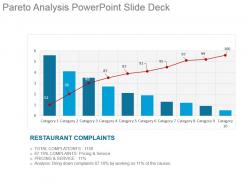 Pareto analysis powerpoint slide deck
Presenting pareto analysis powerpoint slide deck. This is a pareto analysis powerpoint slide deck. This is a ten stage process. The stages in this process are restaurant complaints, total complaints, complaints pricing and service, pricing and service, analysis bring down complaints, category.
-
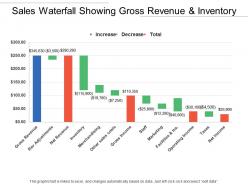 Sales waterfall showing gross revenue and inventory
Presenting this set of slides with name - Sales Waterfall Showing Gross Revenue And Inventory. This is a thirteen stage process. The stages in this process are Sales Waterfall, Waterfall Chart.
-
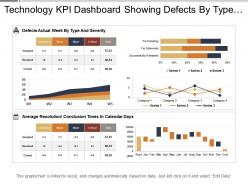 Technology kpi dashboard showing defects by type and severity
Presenting this set of slides with name - Technology Kpi Dashboard Showing Defects By Type And Severity. This is a six stage process. The stages in this process are Technology, IT, IOT.
-
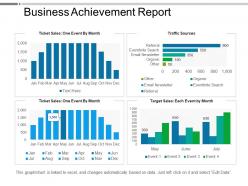 Business achievement report powerpoint templates
Presenting business achievement report PowerPoint templates slideshow which is 100% editable. This PPT template is crafted with attractive display and unique components. This PPT slide is excel linked i.e. data driven and easy to customize and enables you to personalize it as per your own criteria. The presentation slide is fully compatible with Google slides, multiple format and software options. In case of any assistance, kindly take instructions from our presentation design services and it is easy to download in a very short span of time. The images, layouts, designs are of high quality and ensures quality in widescreen.
-
 Warehousing kpi dashboard showing stock value and dispatched items
This storage KPI dashboard PPT design is completely editable; you can modify and personalize the design as per your business needs; include business logo and trademark to look PPT more authentic, put your business warehousing figures in excel and linked charts in design will get updated automatically. You can download the design into JPEG or PDF formats; easy and swift downloading available. Design is compatible with Google Slides and MS PowerPoint software.
-
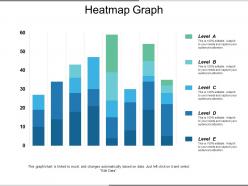 Heatmap graph
Presenting the Heatmap Graph PowerPoint theme which is designed professionally for your convenience. Open and save your presentation in various formats like PDF, JPG, and PNG. You can freely access your presentation in both 4:3 and 16:9 aspect ratio. Alter the font, color, font size, and font types of the slides as per your needs. This template is compatible with Google Slides which makes it easily accessible at once.
-
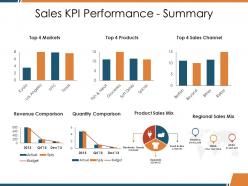 Sales kpi performance summary ppt template
Presenting this set of slides with name - Sales Kpi Performance Summary Ppt Template. This is a six stage process. The stages in this process are Revenue Comparison, Quantity Comparison, Product Sales Mix, Regional Sales Mix, Sales Channel.
-
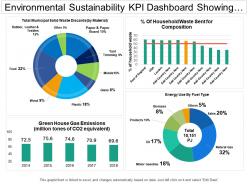 Environmental sustainability kpi dashboard showing municipal solid waste discard
Presenting this set of slides with name - Environmental Sustainability Kpi Dashboard Showing Municipal Solid Waste Discard. This is a four stage process. The stages in this process are Environment Sustainability, Environment Continual, Environment Feasibility.
-
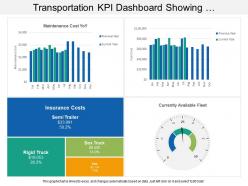 Transportation kpi dashboard showing maintenance cost insurance cost available fleet
Presenting transportation KPI dashboard showing maintenance cost insurance cost available fleet PowerPoint slide. Simple data input with linked Excel chart, just right click to input values. This PowerPoint theme is fully supported by Google slides. Picture quality of these slides does not change even when project on large screen. Fast downloading speed and formats can be easily changed to JPEG and PDF applications. This template is suitable for marketing, sales persons, business managers and entrepreneurs. Adjust PPT layout, font, text and color as per your necessity.
-
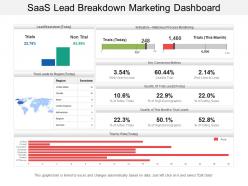 Saas lead breakdown marketing dashboard
Presenting this set of slides with name - Saas Lead Breakdown Marketing Dashboard. Stunning Saas lead breakdown marketing dashboard PPT template. Download is rapid and can be displayed in widescreen view mode also. 100% editable PPT designs as completely modifiable such as icons, text, colors, etc. Effortlessly convertible into JPEG and PDF file formats. Top quality and creative PowerPoint slide design. Adjustable presentation graphic as compatible with Google slides. Perfect for sales executives, marketers, business professionals, analysts, strategists, students, teachers, etc. Information on making the changes has been provided for your provision.
-
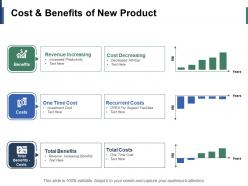 Cost and benefits of new product ppt infographic template example introduction
Presenting this set of slides with name - Cost And Benefits Of New Product Ppt Infographic Template Example Introduction. This is a three stage process. The stages in this process are Benefits, Cost, Revenue Increasing, Cost Decreasing, Recurrent Costs.
-
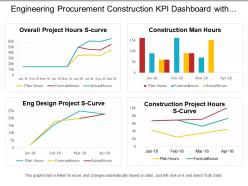 Engineering procurement construction kpi dashboard with project hours s curve
Presenting this set of slides with name - Engineering Procurement Construction Kpi Dashboard With Project Hours S Curve. This is a four stage process. The stages in this process are Engineering, Procurement And Construction, Construction Management, Engineering, Purchasing And Construction .
-
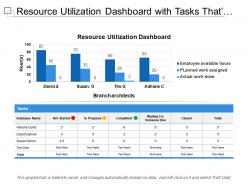 Resource utilization dashboard with tasks thats not completed in progress completed
Presenting this set of slides with name - Resource Utilization Dashboard With Tasks Thats Not Completed In Progress Completed. This is a four stage process. The stages in this process are Resource Management, Resource Utilization, Resource Allocation.
-
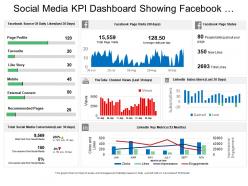 Social media kpi dashboard showing facebook page stats youtube channel views
Presenting this set of slides with name - Social Media Kpi Dashboard Showing Facebook Page Stats Youtube Channel Views. This is a five stage process. The stages in this process are Social Media, Digital Marketing, Social Marketing.
-
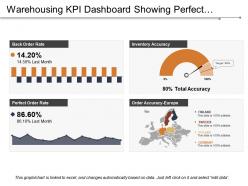 Warehousing kpi dashboard showing perfect order rate and inventory accuracy
PPT design can instantly be downloaded as JPEG and PDF formats. Design template is easily editable, the best advantage of this business oriented PPT design is the use of excel linked charts, where charts in PPT design will automatically get changed when you update storage related figures on linked excel sheet. The PPT design is fully compatible with Google Slides and MS PowerPoint software. Design can be viewed both in standard and full screen view.
-
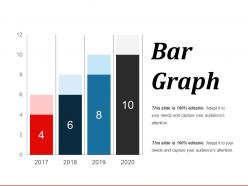 Bar graph powerpoint slide rules
Presenting bar graph powerpoint slide rules. This is a bar graph powerpoint slide rules. This is a four stage process. The stages in this process are bar graph, growth, product, business, marketing.
-
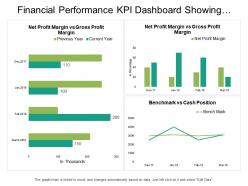 Financial performance kpi dashboard showing benchmark vs cash position
Presenting this set of slides with name - Financial Performance Kpi Dashboard Showing Benchmark Vs Cash Position. This is a four stage process. The stages in this process are Financial Performance, Financial Report, Financial Review.
-
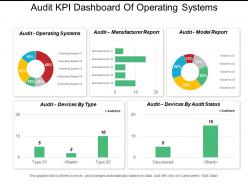 Audit kpi dashboard of operating systems manufacturer report and model report
Presenting this set of slides with name - Audit Kpi Dashboard Of Operating Systems Manufacturer Report And Model Report. This is a five stage process. The stages in this process are Audit, Examine, Survey.
-
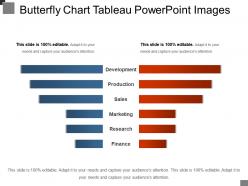 Butterfly chart tableau powerpoint images
Presenting Butterfly Chart Table. This template is Excel-linked and data driven. Edit the excel sheet as per your data and the chart will customize automatically. You can also make alterations in the font type, font size, and background colors as per your requirements. This template is completely compatible with Google Slides and can be transformed into JPG and PDF formats. Download this butterfly template in standard screen (4:3) and widescreen (16:9)
-
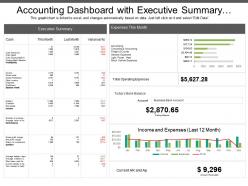 Accounting dashboard with executive summary and monthly expenses
Presenting accounting dashboard with executive summary and monthly expenses PPT slideshow. Makes the information clear in the mind of the audience. Editable visuals, colors and charts. Easy to edit and customize as per your needs. Beneficial for industry professionals, technologists, managers, executives, researchers, sales people, etc. Flexible presentation designs can be presented in standard and widescreen view. Has a futuristic and realistic approach. Privilege of insertion of logo and trademarks for more personalization. Easy to download and save. Highly beneficial PowerPoint Slide for highlighting financial data.
-
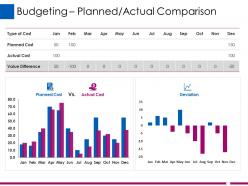 Budgeting planned actual comparison ppt layouts
Presenting this set of slides with name - Budgeting Planned Actual Comparison Ppt Layouts. This is a two stage process. The stages in this process are Finance, Business, Analysis, Marketing, Planning.
-
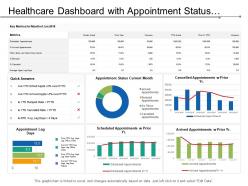 Healthcare dashboard with appointment status current month
Presenting this set of slides with name - Healthcare Dashboard With Appointment Status Current Month. This is a six stage process. The stages in this process are Healthcare, Health Improvement, Medical Care.
-
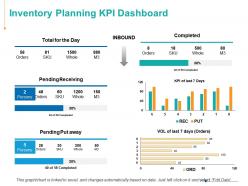 Inventory planning kpi dashboard ppt powerpoint presentation icon
Presenting this set of slides with name - Inventory Planning KPI Dashboard Ppt Powerpoint Presentation Icon. This is a two stage process. The stages in this process are Finance, Analysis, Business, Investment, Marketing.
-
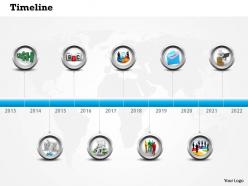 0514 business marketing time line diagram powerpoint slides
PPT icon is easy for proofing and editing. Combination of text and flash animation. Presentation slide supports new shape styles to keep away cliché appearance and helps capture the attention. PPT slide is compatible with Google slide. High resolution. Font style and size can be easily altered and entered. PPT visual offers high color resolution
-
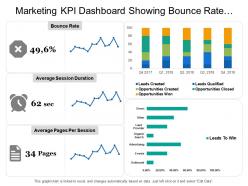 Marketing kpi dashboard showing bounce rate average session duration
Presenting this set of slides with name - Marketing Kpi Dashboard Showing Bounce Rate Average Session Duration. This is a three stage process. The stages in this process are Marketing, Branding, Promoting.
-
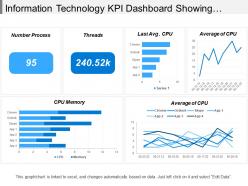 Information technology kpi dashboard showing cpu memory average of cpu
Presenting this set of slides with name - Information Technology Kpi Dashboard Showing Cpu Memory Average Of Cpu. This is a six stage process. The stages in this process are Information Technology, It, Iot.
-
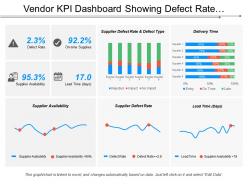 Vendor kpi dashboard showing defect rate on-time suppliers and lead time
Presenting this set of slides with name - Vendor Kpi Dashboard Showing Defect Rate On-Time Suppliers And Lead Time. This is a stage process. The stages in this process are Vendor, Supplier, Retailer.
-
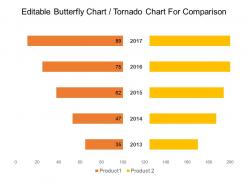 Editable butterfly chart tornado chart for comparison sample of ppt
Presenting Editable Butterfly Chart Tornado Chart For Comparison Sample Of PPT. Editing this tornado chart slide is extremely easy because of its customization in PowerPoint. With one touch, you can insert your own choice text in chart design template as well as you can alter the existing element. The butterfly chart template is easily downloadable and a presenter can save it in either JPG or PDF format. A presenter can display this modified bar chart template in either standard or widescreen view. You can also alter the color, font type, font size & font color of this slide. The infographic butterfly chart template gets 100% synced with Google Slides.
-
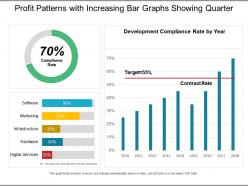 Profit patterns with increasing bar graphs showing quarter
Presenting this set of slides with name - Profit Patterns With Increasing Bar Graphs Showing Quarter. This is a three stage process. The stages in this process are Engineering, Procurement And Construction, Construction Management, Engineering, Purchasing And Construction .
-
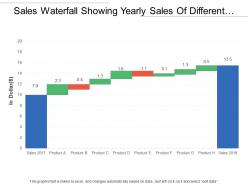 Sales waterfall showing yearly sales of different product
Presenting this set of slides with name - Sales Waterfall Showing Yearly Sales Of Different Product. This is a ten stage process. The stages in this process are Sales Waterfall, Waterfall Chart.
-
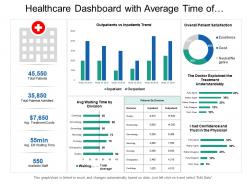 Healthcare dashboard with average time of division and patient satisfaction
Presenting this set of slides with name - Healthcare Dashboard With Average Time Of Division And Patient Satisfaction. This is a five stage process. The stages in this process are Healthcare, Health Improvement, Medical Care.
-
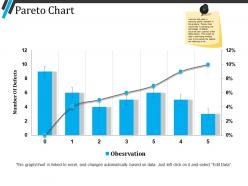 Pareto chart powerpoint templates
Presenting pareto chart powerpoint templates. This is a pareto chart powerpoint templates. This is a seven stage process. The stages in this process are pareto chart, business, growth, finance, analysis.
-
 Government and public works kpi dashboard showing criminal records
Presenting this set of slides with name - Government And Public Works Kpi Dashboard Showing Criminal Records. This is a eight stage process. The stages in this process are Government And Public Works, Government And Public Tasks.
-
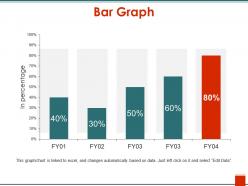 Bar graph powerpoint ideas
Presenting the Bar Graph PowerPoint Ideas template. The template is fully editable in MS PowerPoint and other similar software. Modify the font type, size, diagram color, background color, etc. according to your needs. The slide is also compatible with Google Slides and can be saved in numerous images or document formats such as JPG or PDF. High-quality graphics ensure that pixelation does not arise.
-
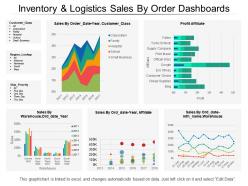 Inventory and logistics sales by order dashboards
Presenting this set of slides with name - Inventory And Logistics Sales By Order Dashboards. This is a five stage process. The stages in this process are Inventory And Logistics, Inventory Management, Warehousing And Inventory Management.
-
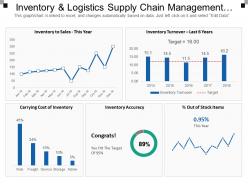 Inventory and logistics supply chain management dashboards
Presenting inventory and logistics supply chain management dashboards PowerPoint template. Access to edit the content, style, size and orientation of the PPT slides. Extremely spacious to cover all the aspects of the company profile. High resolution images do not pixelate when projected on wide screen. Personalize the PPT with your company name and logo. Modify the presentation elements as per the need of an hour. Compatible with numerous software and format options. Used by entrepreneurs, marketers, managerial department, stakeholders and students. Self-explanatory and intellectual slide charts.
-
 0414 bulb coming out of box bar chart powerpoint graph
We are proud to present our 0414 bulb coming out of box bar chart powerpoint graph. Hit the right notes with our 0414 Bulb Coming Out Of Box Bar Chart Powerpoint Graph Powerpoint Templates. Watch your audience start singing to your tune. Walk your team through your plans using our 0414 Bulb Coming Out Of Box Bar Chart Powerpoint Graph Powerpoint Templates. See their energy levels rise as you show them the way.
-
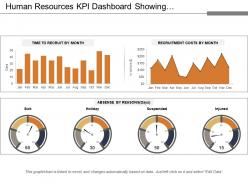 Human resources kpi dashboard showing recruitment costs and absence by reason
Presenting this set of slides with name - Human Resources Kpi Dashboard Showing Recruitment Costs And Absence By Reason. This is a three stage process. The stages in this process are Human Resource, Hrm, Human Capital.
-
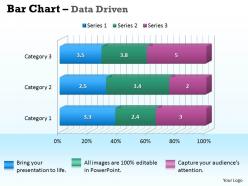 Data driven 3d bar chart for business information powerpoint slides
We are proud to present our data driven 3d bar chart for business information powerpoint slides. The above template shows data driven bar chart.This ppt diagram is simple and practical techniques that have helped the leading people in business, sport and public service reach the pinnacles of their careers.
-
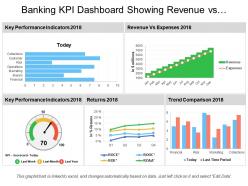 Banking kpi dashboard showing revenue vs expenses and returns
Presenting this set of slides with name - Banking Kpi Dashboard Showing Revenue Vs Expenses And Returns. This is a five stage process. The stages in this process are Banking, Finance, Money.
-
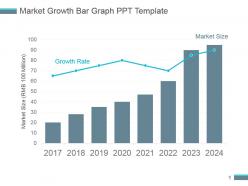 Market growth bar graph ppt template
Presenting market growth bar graph ppt template. This is a market growth bar graph ppt template. This is a eight stage process. The stages in this process are market size, growth rate.
-
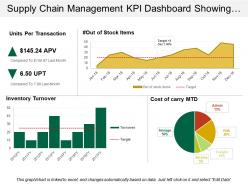 Supply chain management kpi dashboard showing units per transaction
Presenting predesigned Supply Chain Management KPI Dashboard Showing Warehouse Operating Costs PPT slide. Download of the template design is simple. You can modify the layout font type, font size, colors and the background as per needs. Template slide is fully flexible with Google Slides and other online software’s. You can alter the design using the instructional slides provided with the template. You can remove the watermark with your brand name, trademark, signature or logo. You can save the template into PNG or JPEG formats. Supreme quality layouts are used to create this template which is editable in PowerPoint. Sample content can be replaced with your presentation content.
-
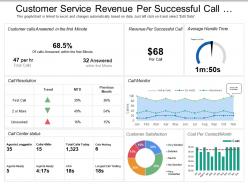 Customer service revenue per successful call dashboard
Presenting this set of slides with name - Customer Service Revenue Per Successful Call Dashboard. This is a three stage process. The stages in this process are Customer Base, Recurring Customers, Customer Services.
-
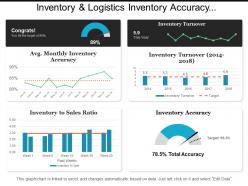 Inventory and logistics inventory accuracy dashboards
Presenting this set of slides with name - Inventory And Logistics Inventory Accuracy Dashboards. This is a four stage process. The stages in this process are Inventory And Logistics, Inventory Management, Warehousing And Inventory Management.
-
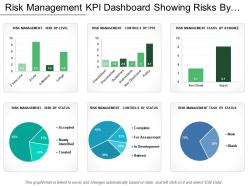 Risk Management Kpi Dashboard Showing Risks By Level Assignee And Status
Presenting this set of slides with name - Risk Management Kpi Dashboard Showing Risks By Level Assignee And Status. This is a six stage process. The stages in this process are Risk Management, Risk Assessment, Project Risk.
-
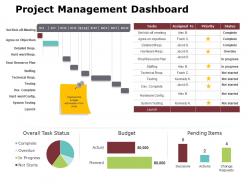 Project management dashboard ppt powerpoint presentation gallery display
Presenting this set of slides with name - Project Management Dashboard Ppt Powerpoint Presentation Gallery Display. This is a two stage process. The stages in this process are Business, Management, Strategy, Analysis, Marketing.
-
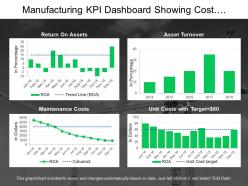 Manufacturing kpi dashboard showing cost management and asset turnover
Presenting this set of slides with name - Manufacturing Kpi Dashboard Showing Cost Management And Asset Turnover. This is a four stage process. The stages in this process are Manufacturing, Production, Manufacture.
-
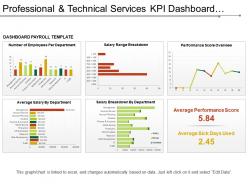 Professional and technical services kpi dashboard showing payroll services
Presenting this set of slides with name - Professional And Technical Services Kpi Dashboard Showing Payroll Services. This is a six stage process. The stages in this process are Professional And Technical Services, Services Management, Technical Management.
-
 0414 business bar chart home illustration powerpoint graph
We are proud to present our 0414 business bar chart home illustration powerpoint graph. Use our 0414 Business Bar Chart Home Illustration Powerpoint Graph Powerpoint Templates to weave a web of your great ideas. They are guaranteed to attract even the most critical of your colleagues. Our 0414 Business Bar Chart Home Illustration Powerpoint Graph Powerpoint Templates are designed to help you succeed. They have all the ingredients you need.
-
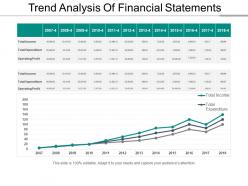 Trend analysis of financial statements powerpoint layout
Presenting a PowerPoint slide named Trend Analysis of Financial Statements PowerPoint Layout. This template with high-quality graphics is completely editable and professionally designed. With an option to change the size, style, and color of the font, this slide is ready to use. You can customize the text and color of the diagram as well as the background as per your discretion. The PPT slide is compatible with Google Slides, which makes it easily accessible. You can customize and save the file as JPG or PDF formats. Once the graph is linked to excel, it automatically changes based on the data.


