- Sub Categories
-
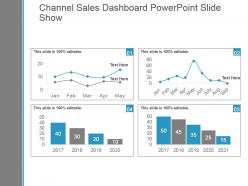 Channel sales dashboard powerpoint slide show
Presenting channel sales dashboard powerpoint slide show. This is a channel sales dashboard powerpoint slide show. This is a four stage process. The stages in this process are business, marketing, line chart, dashboard, management.
-
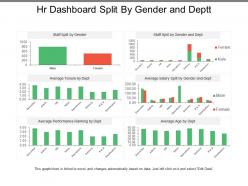 Hr dashboard split by gender and deptt
Presenting this set of slides with name - Hr Dashboard Split By Gender And Deptt. This is a six stage process. The stages in this process are Hr Dashboard, Human Resource Dashboard, Hr Kpi.
-
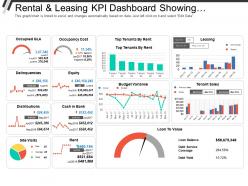 Rental and leasing kpi dashboard showing occupancy cost equity loan to value
Presenting this set of slides with name - Rental And Leasing Kpi Dashboard Showing Occupancy Cost Equity Loan To Value. This is a three stage process. The stages in this process are Rental And Leasing, Dealing And Leasing, Rental And Engage.
-
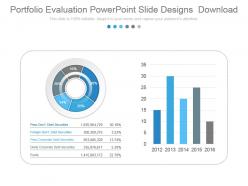 Portfolio evaluation powerpoint slide designs download
Presenting portfolio evaluation powerpoint slide designs download. This is a portfolio evaluation powerpoint slide designs download. This is a two stage process. The stages in this process are peso govt debt securities, foreign govt debt securities, peso corporate debt securities, dollar corporate debt securities, equity.
-
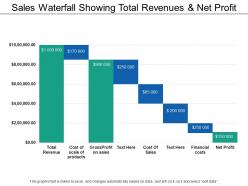 Sales waterfall showing total revenues and net profit
Presenting this set of slides with name - Sales Waterfall Showing Total Revenues And Net Profit. This is a eight stage process. The stages in this process are Sales Waterfall, Waterfall Chart.
-
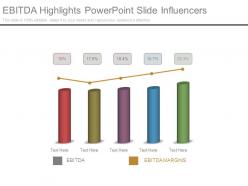 Ebitda highlights powerpoint slide influencers
Presenting ebitda highlights powerpoint slide influencers. This is a ebitda highlights powerpoint slide influencers. This is a five stage process. The stages in this process are graph chart, strategy, management, business, success.
-
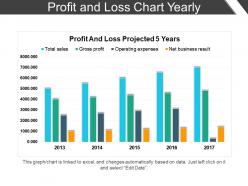 Profit and loss chart yearly powerpoint slide backgrounds
Presenting Profit And Loss Chart Yearly PowerPoint Slide Backgrounds. This PPT slide is professionally made and easily customizable. A mere click can easily edit the font style, font color, and font size. Access this presentation easily anywhere as it is compatible with Google Slides. Transform it in PDF or JPG formats. Add or delete content from the given slide as per your convenience. Present it in front of thousands of people in widescreen. It is also available in standard screen size.
-
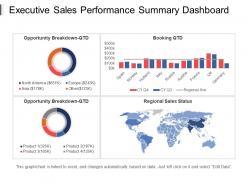 Executive sales performance summary dashboard ppt slide templates
Presenting executive sales performance summary dashboard PPT slide templates PPT slide. Vector-based designing. High-resolution visuals which do not pixelate when projected on a wide screen. Ease of personalization and customization. Add or exclude company-specific content at your choice. Guidelines for executing the changes have been provided for convenience. PPT is compatible with Windows, Mac and other formats and software options. Used by professionals belonging to multiple organizations. Ease of download.
-
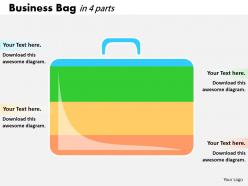 0414 business bag illustration bar chart powerpoint graph
We are proud to present our 0414 business bag illustration bar chart powerpoint graph. Our 0414 Business Bag Illustration Bar Chart Powerpoint Graph Powerpoint Templates are created with admirable insight. Use them and give your group a sense of your logical mind. Use our 0414 Business Bag Illustration Bar Chart Powerpoint Graph Powerpoint Templates to bullet point your ideas. See them fall into place one by one.
-
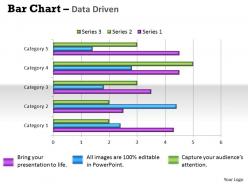 Data driven bar chart for different categories powerpoint slides
We are proud to present our data driven bar chart for different categories powerpoint slides. Great Ideas Deserve A Powerful Launch. Our Data Driven Bar Chart For Different Categories Powerpoint Slides Power Point Templates Will Give Them The Thrust They Need. Bake Your Thoughts In The Oven Of Our Data Driven Bar Chart For Different Categories Powerpoint Slides Power Point Templates. Sense The Aromas Of Your Ideas Waft Across The Room.
-
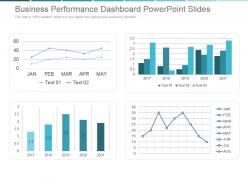 Business performance dashboard powerpoint slides
Presenting business performance dashboard powerpoint slides. This is a business performance dashboard powerpoint slides. This is a four stage process. The stages in this process are business, chart and graph, strategy, success, line graph.
-
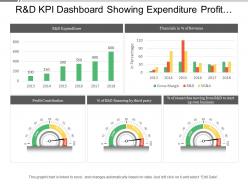 R and d kpi dashboard showing expenditure profit contribution and financial in percentage of revenue
Presenting this set of slides with name - R And D Kpi Dashboard Showing Expenditure Profit Contribution And Financial In Percentage Of Revenue. This is a five stage process. The stages in this process are R And D, Research And Development, Research And Technological Development.
-
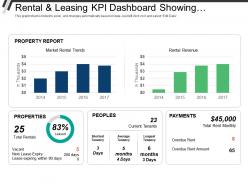 Rental and leasing kpi dashboard showing properties people payments rental revenue
Presenting this set of slides with name - Rental And Leasing Kpi Dashboard Showing Properties People Payments Rental Revenue. This is a five stage process. The stages in this process are Rental And Leasing, Dealing And Leasing, Rental And Engage.
-
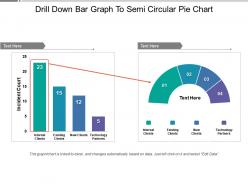 Drill down bar graph to semi circular pie chart
Presenting this set of slides with name - Drill Down Bar Graph To Semi Circular Pie Chart. This is a two stage process. The stages in this process are Drill Down, Hierarchy, Top Downwards.
-
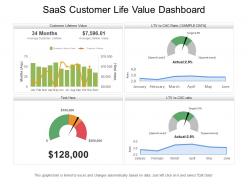 Saas customer life value dashboard
Introducing Saas customer life value dashboard PPT template. An easy access to make the desired changes or edit it anyways. Wide screen view of the slides. Easy conversion into Jpeg or Pdf format. The PPT images offer compatibility with Google templates. High resolution icons for clear message delivery. Unique and informational content. Valuable for business professionals, sales representatives, marketing professionals, students and selling investigators. High quality charts and visuals used in the designing process. They enhance the performance of the presentation.
-
 0414 tea cup bar chart illustration powerpoint graph
We are proud to present our 0414 tea cup bar chart illustration powerpoint graph. Our Tea Cup Bar Chart Illustration Powerpoint Graph Powerpoint Templates are the strands of your mental loom. Weave them together and produce a magical tapestry. Our Tea Cup Bar Chart Illustration Powerpoint Graph Powerpoint Templates provide windows to your brilliant mind. Open them to your audience and impress them with your knowledge.
-
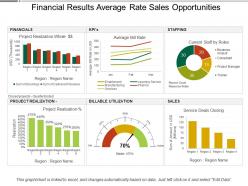 Financial results average rate sales opportunities
Introducing financial results average rates sales opportunities Presentation template. Pre-designed PowerPoint slide assist you in saving time and effort. Color, text and font can be easily edited as the PPT graphic is completely editable. Adaptable as can be transformed into PDF or JPEG formats. Fast download and easy to share with large set of audience. Presentation diagram is presentable in standard and widescreen display. Innovatively created PPT design familiar with Google slides.
-
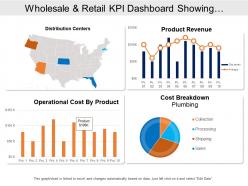 Wholesale and retail kpi dashboard showing distribution centers product revenue
Presenting this set of slides with name - Wholesale And Retail Kpi Dashboard Showing Distribution Centers Product Revenue. This is a four stage process. The stages in this process are Wholesale And Retail, Extensive And Retail, Wholesale And Distribute.
-
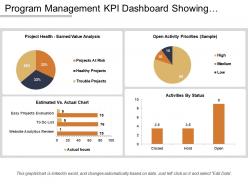 Program management kpi dashboard showing estimated vs actual chart
Presenting this set of slides with name - Program Management Kpi Dashboard Showing Estimated Vs Actual Chart. This is a four stage process. The stages in this process are Program Development, Human Resource Management, Program Management.
-
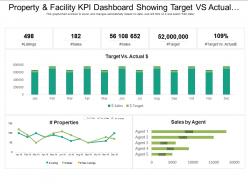 Property and facility kpi dashboard showing target vs actual cost and sales by agent
Get a chance to go through, property and facility KPI dashboard showing target-vs-actual cost and sales by agent PowerPoint Presentation Slide. This Presentation has been designed by professionals and is fully editable. You can have access to alter the font size, font type, colors, and even the background. This Template is amiable with Google Slide and can be saved in JPG or PDF format without any chaos created. Fast download at the click of the button.
-
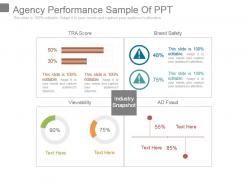 Agency performance sample of ppt
Presenting agency performance sample of ppt. This is a agency performance sample of ppt. This is a four stage process. The stages in this process are tra score, brand safety, viewability, industry snapshot, ad fraud.
-
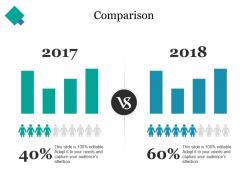 Comparison ppt backgrounds
Presenting this set of slides with name - Comparison Ppt Backgrounds. This is a two stage process. The stages in this process are Comparison, Table, Marketing, Management, Business.
-
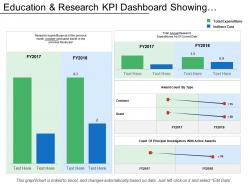 Education and research kpi dashboard showing research expenditure
Presenting education and research KPI dashboard showing research expenditure PPT slide. The expenditure on research and development presentation slide designed by the professional team of SlideTeam. The research expenditure PPT template is fully editable in PowerPoint. The research and development expenditure PowerPoint template is compatible with Google Slide so a user can share this dashboard slide with others. A user can make changes in the font size, font type, color as well as dimensions of the research expenditure PPT template as per the requirement. You may edit the value in the expense research and development presentation slide as the slide gets linked with the Excel sheet.
-
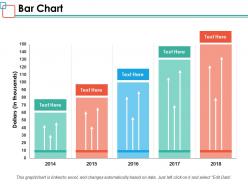 Bar chart ppt powerpoint presentation inspiration images
Presenting this set of slides with name - Bar Chart Ppt Powerpoint Presentation Inspiration Images. This is a five stage process. The stages in this process are Business, Management, Strategy, Analysis, Marketing.
-
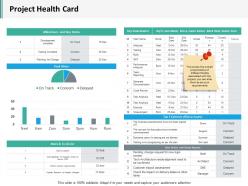 Project health card slide2 ppt infographics structure
Presenting this set of slides with name - Project Health Card Slide2 Ppt Infographics Structure. This is a two stage process. The stages in this process are Business, Management, Strategy, Analysis, Marketing.
-
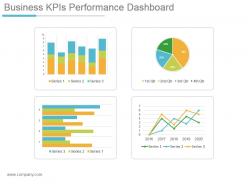 Business kpis performance dashboard snapshot powerpoint slide clipart
Presenting business kpis performance dashboard snapshot powerpoint slide clipart. This is a business kpis performance dashboard powerpoint slide clipart. This is a four stage process. The stages in this process are series, qtr.
-
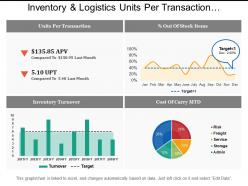 Inventory and logistics units per transaction dashboards
Spectacular inventory and logistics units per transaction dashboards PPT template. Top quality and creative PowerPoint slide design. Adjustable presentation graphic as compatible with Google slides. Perfect for sales executives, marketers, business professionals, analysts, strategists, students, teachers, etc. Information on making the changes has been provided for your provision. Download is rapid and can be displayed in widescreen view mode also. 100% editable PPT designs as completely modifiable such as icons, text, colors, etc. Effortlessly convertible into JPEG and PDF file formats.
-
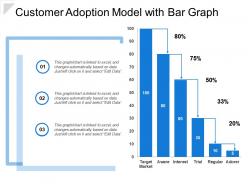 Customer adoption model with bar graph
Presenting this set of slides with name - Customer Adoption Model With Bar Graph. This is a three stages process. The stages in this process are Customer Adoption, Customer Service, Customer Success.
-
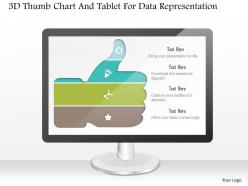 1214 3d thumb chart and tablet for data representation powerpoint slide
We are proud to present our 1214 3d thumb chart and tablet for data representation powerpoint slide. This Power point template slide has been designed with graphic of thumb chart and tablet. These text boxes can be used for data representation. Use this PPT for your business data analysis related presentations.
-
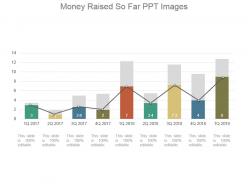 Money raised so far ppt images
Presenting money raised so far PPT images. Change PowerPoint structure, font, text, color and design as per your requirements. Easy data entry options to put in company logo, brand or name .Ideal for marketing professionals, business managers, entrepreneurs and big organizations. This presentation theme is totally attuned with Google slide. Easy conversion to other software’s like JPG and PDF formats. Image quality remains the unchanged even when resize the image or portray on large screens. You can play with shapes and colors to make the chart fitting your brand colors and style.
-
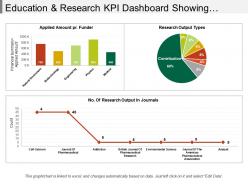 Education and research kpi dashboard Snapshot showing research outputs and amount
Presenting education and research KPI dashboard snapshot showing research outputs and amount PPT slide. The research data metric presentation slide designed by professional team of SlideTeam. The education and research report PPT slide is 100% customizable in PowerPoint. The research amount KPI dashboard slide is also compatible with Google Slide so a user can share this slide with others. A user can make changes in the font size, font type, color as well as dimensions of the research key measure PPT template as per the requirement. You may edit the value in the research key measure PPT template as the slide gets linked with the Excel sheet.
-
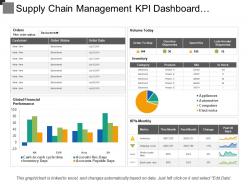 Supply chain management kpi dashboard showing order status volume and inventory
Presenting this set of slides with name - Supply Chain Management Kpi Dashboard Showing Order Status Volume And Inventory. This is a two stage process. The stages in this process are Demand Forecasting, Predicting Future Demand, Supply Chain Management.
-
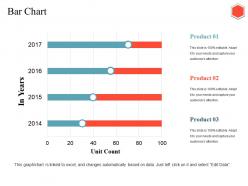 Bar chart ppt inspiration
Presenting this set of slides with name - Bar Chart Ppt Inspiration. This is a three stage process. The stages in this process are Bar Chart, Business, Finance, Analysis, Management.
-
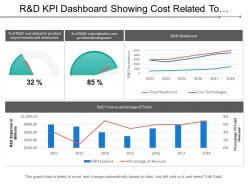 R and d kpi dashboard showing cost related to product improvements and extensions
Presenting this set of slides with name - R And D Kpi Dashboard Showing Cost Related To Product Improvements And Extensions. This is a four stage process. The stages in this process are R And D, Research And Development, Research And Technological Development.
-
 0414 doubtful man bar chart illustration powerpoint graph
Completely editable PPT slide including fonts, visuals, text, colors, etc. Compatible with number of software options. Excellence in picture quality. Slides can be easily inserted in an ongoing presentation. Beneficial for investors, shareholders, financiers, professors, students, marketers, sales people, etc. Presentation design can be displayed in standard and widescreen view. Personalize the presentation with individual company name and logo.
-
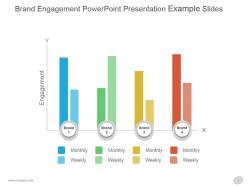 Brand engagement powerpoint presentation example slides
Presenting brand engagement powerpoint presentation example slides. This is a brand engagement powerpoint presentation example slides. This is a four stage process. The stages in this process are engagement, monthly, weekly, brand.
-
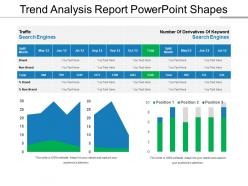 Trend analysis report powerpoint shapes
Presenting Trend Analysis Report PowerPoint Shapes. Customize the slide as per your wants. You are free to change anything in the slide. Modify the colors, background, font type, and font size. It can be transformed and saved in various formats like JPG, PNG, PDF, and JPEG. The slide goes well with the Google Slides and major Microsoft versions. It can be viewed on standard screen size and widescreen size as well.
-
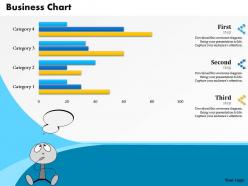 0514 data driven business chart diagram powerpoint slides
We are proud to present our 0514 data driven business chart diagram powerpoint slides. This Business Power Point template is designed with business concept bar chart based on data driven analysis. Use this template and show your skills.
-
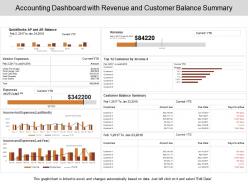 Accounting dashboard with revenue and customer balance summary
Pre-designed accounting dashboard with revenue and customer balance summary PPT template. High-resolution PowerPoint presentation backgrounds for better clarity of the information displayed. Offers wide variety of options and colors to alter the appearance. Allows adding of enterprise personal details such as brand name, logo and much more. Enough space available to enter text and its related points in the PPT slide. This slide is available in both Standard and Widescreen slide size. Compatible with multiple formats like JPEG, PDF and Google slides.
-
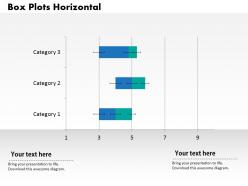 0414 box plots horizontal bar chart powerpoint graph
We are proud to present our 0414 box plots horizontal bar chart powerpoint graph. Deadlines are an element of todays workplace. Our 0414 Box Plots Horizontal Bar Chart Powerpoint Graph Powerpoint Templates help you meet the demand. Just browse and pick the slides that appeal to your intuitive senses. Our 0414 Box Plots Horizontal Bar Chart Powerpoint Graph Powerpoint Templates will help you be quick off the draw. Just enter your specific text and see your points hit home.
-
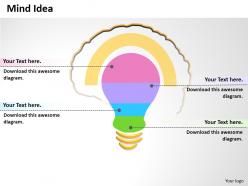 0414 brainwriting idea bar chart powerpoint graph
Fully editable PowerPoint design. Professional use of colors and shapes. Great in picture and pixel quality. PPT template can be shown in standard and widescreen view. Presentation slide is fully editable to allow customization for font, text, colors, etc. Simple to download and convert into PDF format. Compatible with software options such as JPEG and PDF. Valuable for technology administrators, professionals, software engineering team, IT executives etc.
-
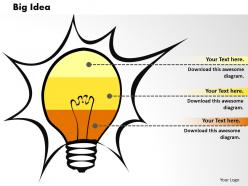 0414 brilliant idea bar chart illustration powerpoint graph
Skillful use of colors and shapes. Presentation design can be presented in standard and widescreen view. Great in picture and pixel quality. PPT slide friendly with Google slides. PowerPoint template design is editable to allow customization with size and text. Convenient download and easy to adjust into PDF format. Friendly with software options such as JPEG and PDF. Useful for business growth, success, vision, achievement etc.
-
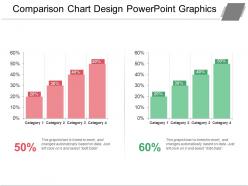 Comparison chart design powerpoint graphics
Presenting comparison chart design PowerPoint graphics PPT slide. The bar chart diagram slide specially designed by SlideTeam for professionals for sharing the required strategies for project or process. The chart design slide is 100% editable in PowerPoint and gets synced with Google Slides. A user can easily edit the font type, font size, color & size of bar graph and aspect ratios of this template, without affecting template's quality. The text placeholder is editable and you can edit as per your preference.
-
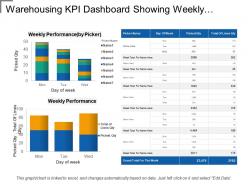 Warehousing kpi dashboard showing weekly performance by picker
The best part of this PPT design is the use of excel linked editable charts. You can change your business related information, statistics and figures in excel sheet and changes will reflect in PPT design. PPT design is 100% editable; you can change the design elements according to your business needs. You can download and save this design as JPEG or PDF formats. Design is fully supported on Google Slides and MS PowerPoint software.
-
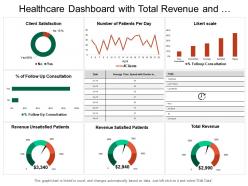 Healthcare dashboard with total revenue and patients per day
Presenting this set of slides with name - Healthcare Dashboard With Total Revenue And Patients Per Day. This is a six stage process. The stages in this process are Healthcare, Health Improvement, Medical Care.
-
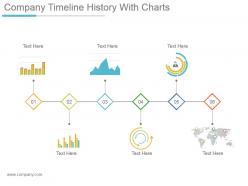 Company timeline history with charts powerpoint slide introduction
Presenting company timeline history with charts powerpoint slide introduction. This is a company timeline history with charts powerpoint slide introduction. This is a six stage process. The stages in this process are business, planning, process, icons, strategy.
-
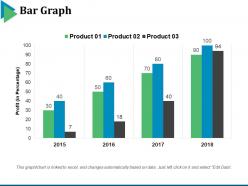 Bar graph powerpoint slide template
Presenting this set of slides with name - Bar Graph Powerpoint Slide Template. This is a three stage process. The stages in this process are Profit, Years, Business, Marketing, Finance, Graph.
-
 Training timeline process ppt infographics example introduction
Presenting this set of slides with name - Training Timeline Process Ppt Infographics Example Introduction. This is a six stage process. The stages in this process are Timeline, Business, Planning, Management, Process.
-
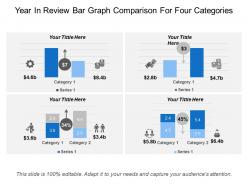 Year in review bar graph comparison for four categories
Presenting this set of slides with name - Year In Review Bar Graph Comparison For Four Categories. This is a four stage process. The stages in this process are Year In Review, Year Highlights, Countdowns.
-
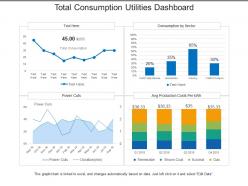 Total consumption utilities dashboard
Presenting this set of slides with name - Total Consumption Utilities Dashboard. This is a four stage process. The stages in this process are Utilities, Use, Advantage.
-
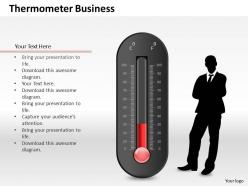 0514 3d graphic of scientific thermometer powerpoint slides
We are proud to present our 0514 3d graphic of scientific thermometer powerpoint slides. 3d graphic of dollar bag is used in this Business Power Point template. Use this template for financial presentations based on data driven analysis.
-
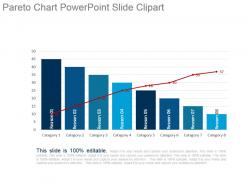 Pareto chart powerpoint slide clipart
Presenting pareto chart powerpoint slide clipart. This is a pareto chart powerpoint slide clipart. This is a eight stage process. The stages in this process are category, reason.
-
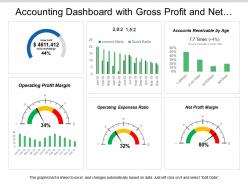 Accounting dashboard with gross profit and net profit margin
Introducing accounting dashboard with gross profit and net profit margin PPT slideshow. Loaded with incomparable benefits. Readymade PPT graphic helps in saving time and effort. Can be personalized by adding company trademark, logo, brand and symbols. Can be utilized for displaying both simple and complex information. Include or exclude slide content as per your individual need. Colors and text can be easily changed as the PPT slide is completely editable. Useful for every business leader and professional, project management team, business analysts, etc.
-
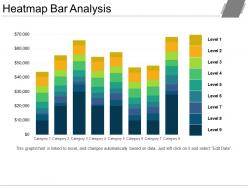 Heatmap bar analysis
Presenting the Heatmap Bar Analysis PowerPoint slide. This ready to use PowerPoint presentation can be downloaded in various formats like PDF, JPG and PNG. You can change the color, font size, font type and shapes of this PPT layout according to your needs. This PPT template is compatible with Google Slides and is available in both 4:3 and 16:9 aspect ratios.
-
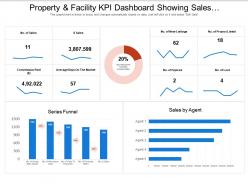 Property and facility kpi dashboard showing sales and properties listed
Presenting, property and facility KPI dashboard showing sales and properties listed PowerPoint Presentation Slide. This Presentation has been designed under the strict supervision of professionals and is fully editable. You can have access to play with the font size, font type, colors, and even the background. This Template is manageable with Google Slide and can be saved in JPG or PDF format without any hassle created during the saving process. Fast download at the click of the button shown below.
-
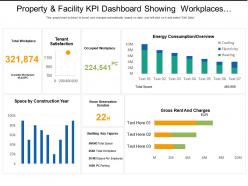 Property and facility kpi dashboard showing workplaces and energy consumption
Introducing, property and facility KPI dashboard showing workplaces and energy consumption warehousing KPI dashboard PowerPoint Presentation Slide. This Presentation has been designed professionally and is fully editable. You can reshape the font size, font type, colors, and even the background. This Template is cordial with Google Slide and can be saved in JPG or PDF format without any resistance created. Fast download at the click of the button.
-
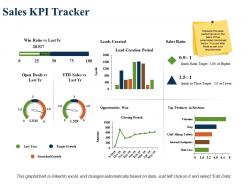 Sales kpi tracker lead creation period sales ratio
Presenting this set of slides with name - Sales Kpi Tracker Lead Creation Period Sales Ratio. This is a three stage process. The stages in this process are Leads Created, Sales Ratio, Top Products In Revenue, Opportunities Won, Stretched Growth.
-
 Healthcare dashboard with admission by division and overall patient satisfaction
Presenting this set of slides with name - Healthcare Dashboard With Admission By Division And Overall Patient Satisfaction. This is a seven stage process. The stages in this process are Healthcare, Health Improvement, Medical Care.
-
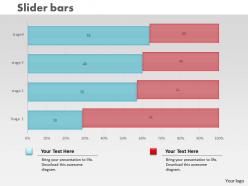 0414 slider bar chart for data sets powerpoint graph
We are proud to present our 0414 slider bar chart for data sets powerpoint graph. Hit the ground running with our Slider Bar Chart For Data Sets Powerpoint Graph Powerpoint Templates. Go the full distance with ease and elan. Leave a lasting impression with our Slider Bar Chart For Data Sets Powerpoint Graph Powerpoint Templates. They possess an inherent longstanding recall factor.
-
 Insurance total claims per year and month dashboard
• Bright colors and clarity in graphics • Thoroughly editable slides • Ease of editing the slides with the help of instructions provided. • Easy to download • Comfortably customizable • Of much help to financial analysts, insurance company employees, students and teachers. • High resolution of slide visuals do not let the image pixelate when projected on wide screen • Compatible with latest software options and multiple format types.


