Pricing Strategies PowerPoint Templates, Presentation Slides & PPT Templates
- Sub Categories
-
- 30 60 90 Day Plan
- About Us Company Details
- Action Plan
- Agenda
- Annual Report
- Audit Reports
- Balance Scorecard
- Brand Equity
- Business Case Study
- Business Communication Skills
- Business Plan Development
- Business Problem Solving
- Business Review
- Capital Budgeting
- Career Planning
- Change Management
- Color Palettes
- Communication Process
- Company Location
- Company Vision
- Compare
- Competitive Analysis
- Corporate Governance
- Cost Reduction Strategies
- Custom Business Slides
- Customer Service
- Dashboard
- Data Management
- Decision Making
- Digital Marketing Strategy
- Digital Transformation
- Disaster Management
- Diversity
- Equity Investment
- Financial Analysis
- Financial Services
- Financials
- Growth Hacking Strategy
- Human Resource Management
- Innovation Management
- Interview Process
- Knowledge Management
- Leadership
- Lean Manufacturing
- Legal Law Order
- Management
- Market Segmentation
- Marketing
- Media and Communication
- Meeting Planner
- Mergers and Acquisitions
- Metaverse
- Newspapers
- Operations and Logistics
- Organizational Structure
- Our Goals
- Performance Management
- Pitch Decks
- Pricing Strategies
- Process Management
- Product Development
- Product Launch Ideas
- Product Portfolio
- Project Management
- Purchasing Process
- Quality Assurance
- Quotes and Testimonials
- Real Estate
- Risk Management
- Sales Performance Plan
- Sales Review
- SEO
- Service Offering
- Six Sigma
- Social Media and Network
- Software Development
- Solution Architecture
- Stock Portfolio
- Strategic Management
- Strategic Planning
- Supply Chain Management
- Swimlanes
- System Architecture
- Team Introduction
- Testing and Validation
- Thanks-FAQ
- Time Management
- Timelines Roadmaps
- Value Chain Analysis
- Value Stream Mapping
- Workplace Ethic
-
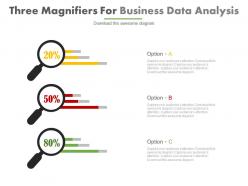 Three magnifiers for business data analysis powerpoint slides
Presenting three magnifiers for business data analysis powerpoint slides. This Power Point template diagram has been crafted with graphic of three magnifiers diagram. This PPT diagram contains the concept of business data analysis. Use this PPT diagram for business and finance related presentations.
-
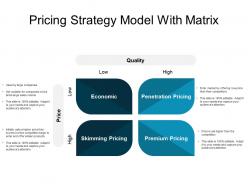 Pricing strategy model with matrix
Presenting this set of slides with name Pricing Strategy Model With Matrix. This is a four stage process. The stages in this process are Economic, Penetration Pricing, Premium Pricing, Skimming Pricing. This is a completely editable PowerPoint presentation and is available for immediate download. Download now and impress your audience.
-
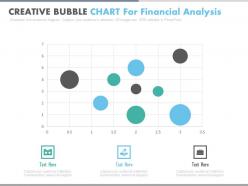 Creative bubble chart for financial analysis powerpoint slides
Presenting creative bubble chart for financial analysis powerpoint slides. This is a creative bubble chart for financial analysis powerpoint slides. This is a three stage process. The stages in this process are financials.
-
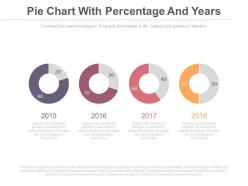 Four pie charts with percentage and years powerpoint slides
Presenting four pie charts with percentage and years powerpoint slides. This is a four pie charts with percentage and years powerpoint slides. This is a four stage process. The stages in this process are financials.
-
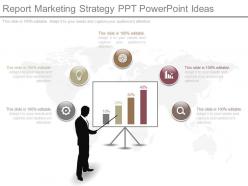 Ppt report marketing strategy ppt powerpoint ideas
Time saving PowerPoint template on part of designing and formatting. Professionally proficient PPT presentation layout. Easily editable colors, text, fonts, shapes, icons and orientation. Impressive picture quality provides high resolution output. Zero issue of pixilation when projected on wide screen. Hassle free inclusion and exclusion of company name, logo and trademark. Compatible with multiple software and formats. Marketers, strategists, business planners, students and teachers make vivid use of this slide design in their presentations.
-
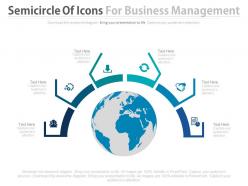 Globe with semicircle of icons for business management powerpoint slides
Presenting globe with semicircle of icons for business management powerpoint slides. This Power Point template diagram has been crafted with graphic of globe and semicircle diagram. This PPT diagram contains the concept of business management. Use this PPT diagram for business and finance related presentations.
-
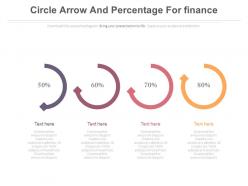 Four circle arrows and percentage for finance powerpoint slides
Presenting four circle arrows and percentage for finance powerpoint slides. This is a four circle arrows and percentage for finance powerpoint slides. This is a four stage process. The stages in this process are financials.
-
 Train diagram with business icons and percentage powerpoint slides
Presenting train diagram with business icons and percentage powerpoint slides. This is a train diagram with business icons and percentage powerpoint slides. This is a three stage process. The stages in this process are financials.
-
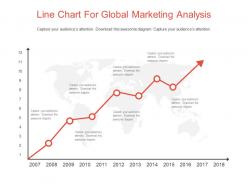 Line chart for global marketing analysis powerpoint slides
Presenting line chart for global marketing analysis powerpoint slides. This Power Point template slide has been crafted with graphic of line chart. This PPT slide contains the concept of global marketing analysis representation. Use this PPT slide for business and marketing related presentations.
-
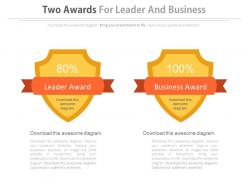 Two awards for leader and business powerpoint slides
Presenting two awards for leader and business powerpoint slides. This Power Point template slide has been crafted with graphic of two awards. This PPT slide contains the concept of success milestones representation. Use this PPT slide for business and finance related presentations.
-
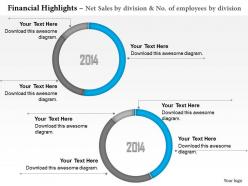 0414 net sales financial diagram
They provide easy and simple way of displaying your financial status on yearly basis. They have the tendency to cover the significant aspects while executing the annual financial sales report. They have a unique and dynamic appearance. They support various formats. These illustrations have a completely professional look and feel.
-
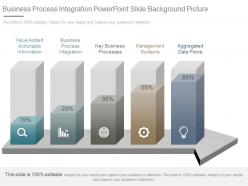 Business process integration powerpoint slide background picture
Presenting business process integration powerpoint slide background picture. This is a business process integration powerpoint slide background picture. This is a five stage process. The stages in this process are value added actionable information, business process integration, key business processes, management systems, aggregated data flows.
-
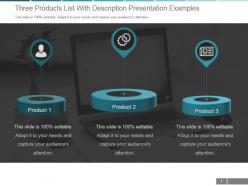 Three products list with description presentation examples
Presenting three products list with description presentation examples. This is a three products list with description presentation examples. This is a three stage process. The stages in this process are product.
-
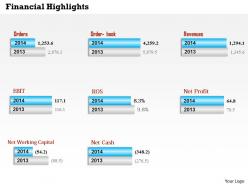 0514 order and revenue financial chart diagram
High quality PPT graphics don’t pixelate when projected on large screen. Widely used by financiers, finance department, business managers and planners for translating information. 100 percent editable PowerPoint colors, orientation, text and graphics. Easy inclusion of company name, trademark and logo. Compatible with multiple number of online and offline software. Flexible option for conversion in PDF or JPG formats.
-
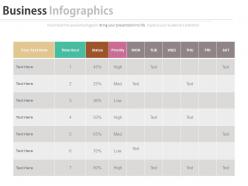 Business time management sheet daily activity plan schedule powerpoint slides
Presenting business time management sheet daily activity plan schedule powerpoint slides. This Power Point template slide has been crafted with graphic of activity plan and time icons. This PPT slide contains the concept of business time management and planning. Use this PPT slide for business and marketing related presentations.
-
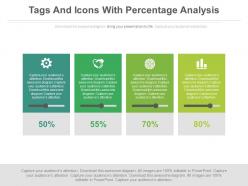 Four tags and icons with percentage analysis powerpoint slides
Presenting four tags and icons with percentage analysis powerpoint slides. This Power Point template diagram with graphic of four staged tags and icons. This PPT diagram contains the concept of percentage analysis. Use this PPT diagram for business and finance related presentations.
-
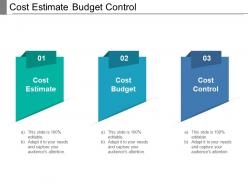 Cost estimate budget control
Presenting this set of slides with name - Cost Estimate Budget Control. This is a three stage process. The stages in this process are Cost Estimate, Price Estimate, Value Estimate.
-
 0414 3d background graphics for financial analysis
100% alterable content, shades, images, hue etc. of PowerPoint images, Adequate space provided to insert text, titles and subtitles, Simply click to add logo, trademark or name, Flexibility to convert into various file configuration like PDF or JPG, Ready to use or instant downloading options available hence saves time, Runs efficiently with other software’s, well versed with all Google slides, high quality PPT graphics which are quite effective when projected on larger screen.
-
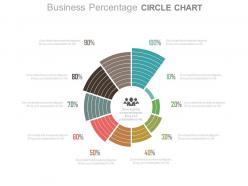 Ten staged business percentage circle chart powerpoint slides
Presenting ten staged business percentage circle chart powerpoint slides. This Power Point template diagram slide has been crafted with graphic of ten staged circle chart diagram. This PPT diagram contains the concept of business data analysis. Use this PPT diagram for business and finance related presentations.
-
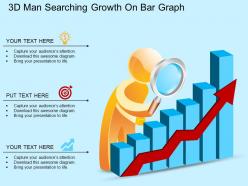 Eb 3d man searching growth on bar graph powerpoint template
Presenting eb 3d man searching growth on bar graph powerpoint template. This Power Point template diagram has been crafted with graphic of 3d man and bar graph. This PPT diagram contains the concept of growth. Use this PPT diagram for business and marketing related presentations.
-
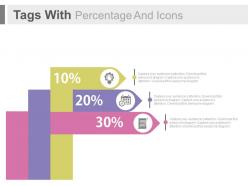 Three tags with percentage and icons powerpoint slides
Presenting three tags with percentage and icons powerpoint slides. This Power Point template slide has been crafted with graphic of three tags and percentage diagram. This PPT slide contains the concept of financial data analysis. Use this PPT slide for business and finance related presentations.
-
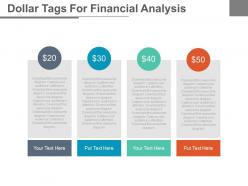 Four dollar tags for financial analysis powerpoint slides
Presenting four dollar tags for financial analysis powerpoint slides. This Power Point template diagram with graphic of four dollar tags. This PPT diagram contains the concept of financial analysis. Use this PPT diagram for business and finance related presentations.
-
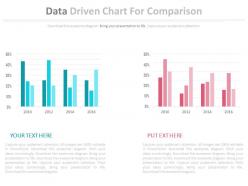 Two data driven chart for comparison powerpoint slides
Presenting two data driven chart for comparison powerpoint slides. This Power Point template diagram with graphic of two data driven chart diagram. This PPT diagram contains the concept of data comparison analysis. Use this PPT diagram for business and finance related presentations.
-
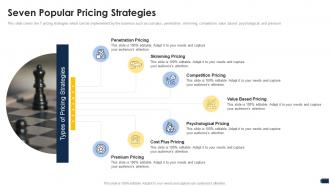 Companys pricing strategies seven popular pricing strategies
This slide covers the 7 pricing strategies which can be implemented by the business such as cost-plus, penetration, skimming, competition, value based, psychological, and premium. Introducing Companys Pricing Strategies Seven Popular Pricing Strategies to increase your presentation threshold. Encompassed with seven stages, this template is a great option to educate and entice your audience. Dispence information on Penetration Pricing, Skimming Pricing, Competition Pricing, using this template. Grab it now to reap its full benefits.
-
 Funnel design chart with icons powerpoint slides
Presenting funnel design chart with icons powerpoint slides. This Power Point template slide has been crafted with graphic of funnel design chart and icons. This PPT slide contains the concept of result analysis. Use this PPT slide for business and finance related presentations.
-
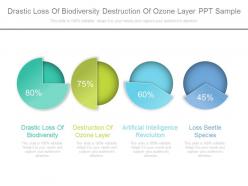 Drastic loss of biodiversity destruction of ozone layer ppt sample
Presenting drastic loss of biodiversity destruction of ozone layer ppt sample. This is a drastic loss of biodiversity destruction of ozone layer ppt sample. This is a four stage process. The stages in this process are drastic loss of biodiversity, destruction of ozone layer, artificial intelligence revolution, loss beetle species.
-
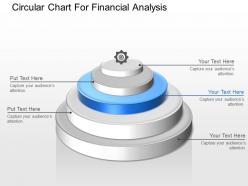 Circular chart for financial analysis powerpoint template slide
We are proud to present our circular chart for financial analysis powerpoint template slide. This power point template diagram has been crafted with graphic of circular chart. This PPT diagram contains the concept of financial analysis. Use this PPT diagram for business and finance related presentations.
-
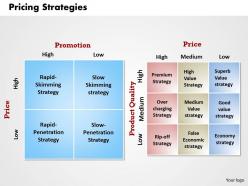 Pricing strategies powerpoint presentation slide template
We are proud to present our pricing strategies powerpoint presentation slide template. Lay The Foundation Of Your Presentation With Our PRICING STRATEGIES Powerpoint Presentation Slide Template Power Point Templates. Build Upon It Layer By Layer And Give It The Form Of Your Choice. Our PRICING STRATEGIES Powerpoint Presentation Slide Template Power Point Templates Are The Heartstrings Of Your Brilliant Song. Strum Them And Produce A Tune Certain To Touch The Souls Of Your Audience. Perfect for presentations on Pricing Strategies, Price, Low, High, Rapid Skimming Strategy, Rapid Penetration Strategy, Slow Skimming Strategy, Slow Penetration Strategy, Product Quality, Medium, Price, Premium Strategy, Over Charging Strategy, Rip Off Strategy, High Value Strategy, Medium Value Strategy, False Economic Strategy, Superb Value Strategy, Good Value Strategy, Economy Strategy.
-
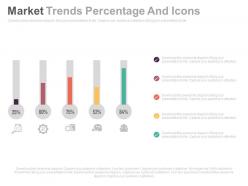 Five staged market trends percentage and icons powerpoint slides
Presenting five staged market trends percentage and icons powerpoint slides. This Power Point template slide has been crafted with graphic of five staged percentage and icons. This PPT slide contains the concept of financial growth analysis. Use this PPT slide for business and finance related presentations.
-
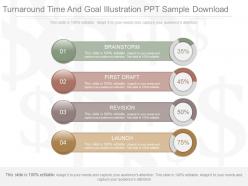 Pptx turnaround time and goal illustration ppt sample download
Presenting pptx turnaround time and goal illustration ppt sample download. This is a turnaround time and goal illustration ppt sample download. This is a four stage process. The stages in this process are brainstorm, first draft, revision, launch.
-
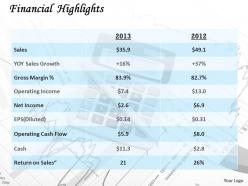 0314 financial sales growth chart
Presentation slide is beneficial for clients, managers, project in charge, financial sector and business conferences. Color, style and position can be standardized, supports font size which can be read from a distance. PPT slide is compatible with Microsoft 2010 and 2013 versions. Text and graphics can be placed on the slide. PPT diagram 100% compatible with Google slide.
-
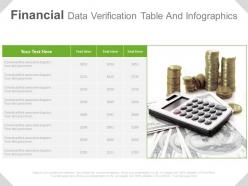 Financial data verification table and infographics powerpoint slides
Presenting financial data verification table and infographics powerpoint slides. This Power Point template slide has been crafted with graphic of data verification table and info graphics. This PPT slide contains the concept of financial data analysis. Use this PPT slide for business and finance related presentations.
-
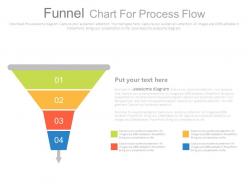 Four staged funnel chart for process flow powerpoint slides
Presenting four staged funnel chart for process flow powerpoint slides. This Power Point template diagram has been crafted with graphic of four staged funnel chart diagram. This PPT diagram contains the concept of business process flow representation. Use this PPT diagram for business and finance related presentations.
-
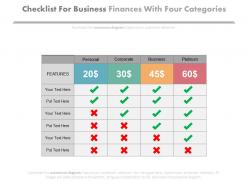 Checklist for business finances with four categories powerpoint slides
Presenting checklist for business finances with four categories powerpoint slides. This is a checklist for business finances with four categories powerpoint slides. This is a one stage process. The stages in this process are financials.
-
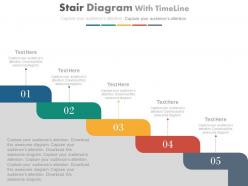 Five staged stair diagram with timeline powerpoint slides
Presenting five staged stair diagram with timeline powerpoint slides. This Power Point template diagram slide has been crafted with graphic of five staged stair and timeline diagram. This PPT diagram contains the concept of business target and success milestones representation. Use this PPT diagram for business and marketing related presentations.
-
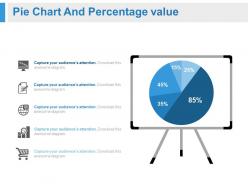 White board with pie chart and percentage powerpoint slides
Presenting white board with pie chart and percentage powerpoint slides. This Power Point template slide has been crafted with graphic of white board and pie chart diagram. This PPT slide contains the concept of business result analysis. Use this PPT slide for business and finance related presentations.
-
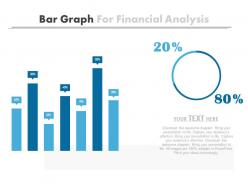 Bar graph for financial analysis powerpoint slides
Presenting bar graph for financial analysis powerpoint slides. This Power Point template slide has been crafted with graphic of bar graph. This PPT slide contains the concept of financial data analysis. Use this PPT slide for business and finance related presentations.
-
 Four text boxes for about us powerpoint slides
Presenting four text boxes for about us powerpoint slides. This Power Point template slide has been crafted with graphic of four text boxes. This PPT slide contains the concept of about us representation. Use this PPT slide for business and finance related presentations.
-
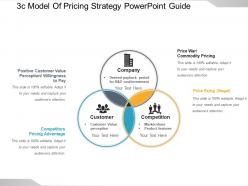 3c model of pricing strategy powerpoint guide
Presenting 3c Model Of Pricing Strategy PowerpointSlides. Edit the fonts, colors, and slide background if you wish to. It is fully editable in PowerPoint and the template is 100% editable in PPT. It is fully customizable. The slide can be modified as per your requirements. When you download the presentation, you get the PPT files in both widescreens (16:9) and standard screen (4:3) aspect ratio. This presentation is compatible with Google Slides and can be saved in JPG or PDF format.
-
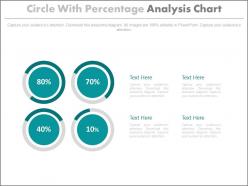 Four circle with percentage analysis chart powerpoint slides
Presenting four circle with percentage analysis chart powerpoint slides. This Power Point template slide has been crafted with graphic of four circle and percentage icons. This PPT slide contains the concept of percentage analysis representation. Use this PPT slide for business and finance related presentations.
-
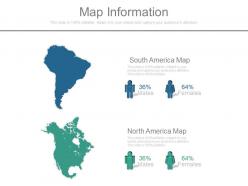 Original map information
Presenting original map information. This is a map information. This is a two stage process. The stages in this process are south america map, north america map.
-
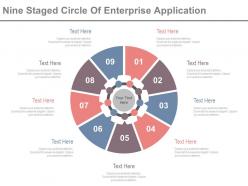 Nine staged circle of enterprise application powerpoint slides
Presenting nine staged circle of enterprise application powerpoint slides. This Power Point template diagram has been crafted with graphic of nine staged circle diagram. This PPT diagram contains the concept of enterprise application representation. Use this PPT diagram for business and finance related presentations.
-
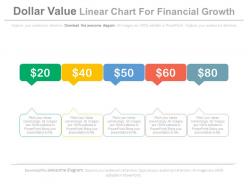 Dollar value linear chart for financial growth powerpoint slides
Presenting dollar value linear chart for financial growth powerpoint slides. This Power Point template slide has been crafted with graphic of dollar value linear chart icons. This PPT slide contains the concept of financial growth analysis. Use this PPT slide for business and finance related presentations.
-
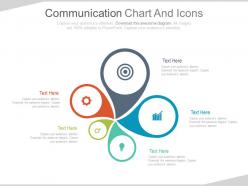 Five staged communication chart and icons powerpoint slides
Presenting five staged communication chart and icons powerpoint slides. This Power Point template diagram slide has been crafted with graphic of five staged chart and icons diagram. This PPT diagram contains the concept of business communication strategy representation. Use this PPT diagram for business and marketing related presentations.
-
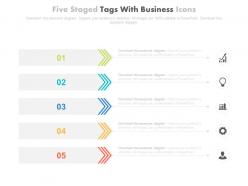 Five staged tags with business icons for business process powerpoint slides
Presenting five staged tags with business icons for business process powerpoint slides. This Power Point template diagram slide has been crafted with graphic of five staged tags and icons diagram. This PPT diagram contains the concept of business process flow representation. Use this PPT diagram for business and marketing related presentations.
-
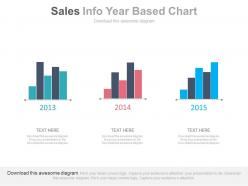 Three staged sales info year based chart powerpoint slides
Presenting three staged sales info year based chart powerpoint slides. This Power Point template diagram with graphic of three staged year info chart diagram. This PPT diagram contains the concept of year based sales planning. Use this PPT diagram for business and sales related presentations.
-
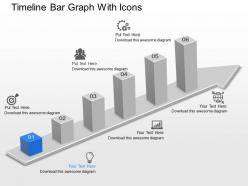 Du timeline bar graph with icons powerpoint template
Presenting du timeline bar graph with icons powerpoint template. Presenting du timeline bar graph with icons powerpoint template. Presenting du timeline bar graph with icons powerpoint template. This Power Point template diagram has been crafted with graphic of timeline and bar graph diagram. This PPT diagram contains the concept of business result analysis. Use this PPT diagram for business and marketing related presentations.
-
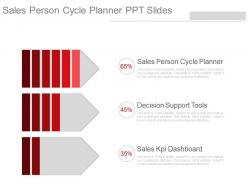 Sales person cycle planner ppt slides
Use of high-level of picture quality images and icons. Provided instructions to edit and modify the slide design. Easy to download and save. Instant addition of your company name or brand logo in the background. Edit the size, style and orientation of the slide icons. Beneficial for the sales and marketing professional s or the business managers The stages in this process are sales person cycle planner, decision support tools, sales kpi dashboard.
-
 One partition aware routing powerpoint templates microsoft
Presenting one partition aware routing powerpoint templates microsoft. This is a partition aware routing powerpoint templates microsoft. This is a three stage process. The stages in this process are additional routing, partition aware routing, voldemort cluster.
-
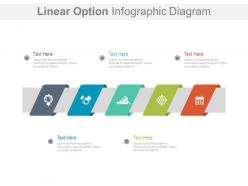 Five staged linear option infographic diagram powerpoint slides
Presenting five staged linear option infographic diagram powerpoint slides. This Power Point template diagram slide has been crafted with graphic of five staged linear option diagram. This PPT diagram contains the concept of business options representation. Use this PPT diagram for business and marketing related presentations.
-
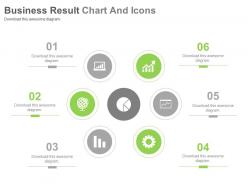 Six staged business result charts and icons powerpoint slides
Presenting six staged business result charts and icons powerpoint slides. This Power Point template slide has been crafted with graphic of six staged result chart and icons diagram. This PPT slide contains the concept of business result analysis. Use this PPT slide for business and finance related presentations.
-
 0314 profit and loss balance and cash flow statements
All software operates slides fluently. Download slides with no lagging issues. Company logo, name or trademark can be added without problems. PPT graphics pixelation does not occur when viewed on widescreen. Full Compatibility with google slides for ease of access. Insert titles and subtitles with zero space constraints. High resolution PPT slides for display clarity. Changeable PPT layout including font, text, color and design.
-
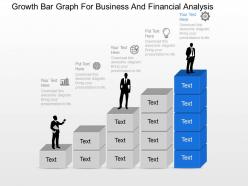 Growth bar graph for business and financial analysis powerpoint template slide
Meticulous PowerPoint template very convenient for management scholars, professionals from various fields etc., Comfortably adjustable into different configurations like PDF or JPG, Easy to insert your brand name or company emblem in the PPT templates , Redraft able subject matter, PowerPoint images, types , font etc., Dressed well with all Google slides and other operating software’s.
-
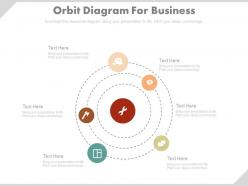 Six staged orbit diagram for business powerpoint slides
Presenting six staged orbit diagram for business powerpoint slides. This Power Point template slide has been crafted with graphic of six staged orbit diagram. This PPT slide contains the concept of business process flow analysis. Use this PPT slide for business and finance related presentations.
-
 0414 circular financial process diagram
High-resolution images and the slide icons. Allow saving in the multiple formats like JPG or PDF format. Easy to edit and customize the content or the slide icons. 100% access to edit the background, style and orientation of the slide icons once downloaded. Provided guidance to customize the background or the slide icons content. Beneficial for the business leaders and financial professionals..
-
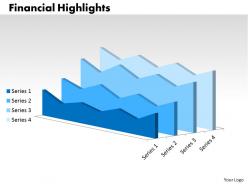 0414 growth analysis chart diagram
Businessmen, micro, small and medium enterprises can use the PPT visual as a key slide. PowerPoint presentation supports filling background in a different color from the text. All images are 100% editable in the presentation slide. Text can be differentiated form the background by the handy features provided by PPT layout. There is no space constrain in the PowerPoint design, thus enabling easy addition or edition of data.
-
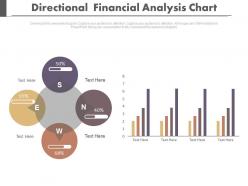 Four directional financial analysis chart powerpoint slides
Presenting four directional financial analysis chart powerpoint slides. This Power Point template diagram with graphic of four directional chart. This PPT diagram contains the concept of financial analysis. Use this PPT diagram for business and finance related presentations.
-
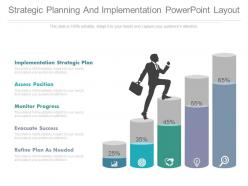 Strategic planning and implementation powerpoint layout
Presenting strategic planning and implementation powerpoint layout. This is a strategic planning and implementation powerpoint layout. This is a five stage process. The stages in this process are implementation strategic plan, assess position, monitor progress, evacuate success, refine plan as needed.
-
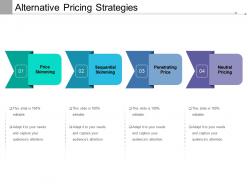 Alternative pricing strategies
Presenting this set of slides with name - Alternative Pricing Strategies. This is a four stage process. The stages in this process are Alternative, Different, Other.
-
 Bar graph with percentage for financial analysis powerpoint slides
Presenting bar graph with percentage for financial analysis powerpoint slides. This Power Point template slide has been crafted with graphic of bar graph and percentage icons. This PPT slide contains the concept of financial analysis. Use this PPT slide for business and finance related presentations.


