Pricing Strategies PowerPoint Templates, Presentation Slides & PPT Templates
- Sub Categories
-
- 30 60 90 Day Plan
- About Us Company Details
- Action Plan
- Agenda
- Annual Report
- Audit Reports
- Balance Scorecard
- Brand Equity
- Business Case Study
- Business Communication Skills
- Business Plan Development
- Business Problem Solving
- Business Review
- Capital Budgeting
- Career Planning
- Change Management
- Color Palettes
- Communication Process
- Company Location
- Company Vision
- Compare
- Competitive Analysis
- Corporate Governance
- Cost Reduction Strategies
- Custom Business Slides
- Customer Service
- Dashboard
- Data Management
- Decision Making
- Digital Marketing Strategy
- Digital Transformation
- Disaster Management
- Diversity
- Equity Investment
- Financial Analysis
- Financial Services
- Financials
- Growth Hacking Strategy
- Human Resource Management
- Innovation Management
- Interview Process
- Knowledge Management
- Leadership
- Lean Manufacturing
- Legal Law Order
- Management
- Market Segmentation
- Marketing
- Media and Communication
- Meeting Planner
- Mergers and Acquisitions
- Metaverse
- Newspapers
- Operations and Logistics
- Organizational Structure
- Our Goals
- Performance Management
- Pitch Decks
- Pricing Strategies
- Process Management
- Product Development
- Product Launch Ideas
- Product Portfolio
- Project Management
- Purchasing Process
- Quality Assurance
- Quotes and Testimonials
- Real Estate
- Risk Management
- Sales Performance Plan
- Sales Review
- SEO
- Service Offering
- Six Sigma
- Social Media and Network
- Software Development
- Solution Architecture
- Stock Portfolio
- Strategic Management
- Strategic Planning
- Supply Chain Management
- Swimlanes
- System Architecture
- Team Introduction
- Testing and Validation
- Thanks-FAQ
- Time Management
- Timelines Roadmaps
- Value Chain Analysis
- Value Stream Mapping
- Workplace Ethic
-
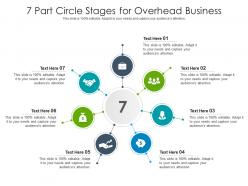 7 part circle stages for overhead business infographic template
This is a single slide titled 7 Part Circle Stages For Overhead Business Infographic Template. It is crafted using high quality vector based visuals that are 100 percent editable and available for immediate download in standard and widescreen aspect ratios.
-
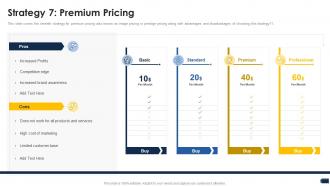 Strategy 7 premium pricing companys pricing strategies
This slide covers the seventh strategy for premium pricing also known as image pricing or prestige pricing along with advantages and disadvantages of choosing this strategy11. Introducing Strategy 7 Premium Pricing Companys Pricing Strategies to increase your presentation threshold. Encompassed with four stages, this template is a great option to educate and entice your audience. Dispence information on Competitive, Brand, Awareness, using this template. Grab it now to reap its full benefits.
-
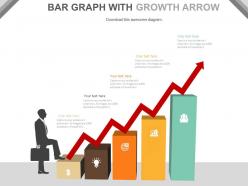 Bar graph with red growth arrow and icons for success powerpoint slides
Presenting bar graph with red growth arrow and icons for success powerpoint slides. This Power Point template slide has been crafted with graphic of bar graph and red growth arrow. This PPT slide contains the concept of financial growth analysis and success. Use this PPT slide for business and finance related presentations.
-
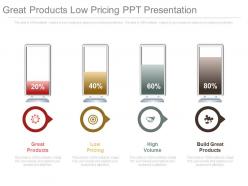 Great products low pricing ppt presentation
Presenting great products low pricing ppt presentation. This is a great products low pricing ppt presentation. This is a four stage process. The stages in this process are great products, low pricing, high volume, build great products.
-
 Mobile with social media icons powerpoint slides
Presenting mobile with social media icons powerpoint slides. This Power Point template diagram slide has been crafted with graphic of mobile and social media icons diagram. This PPT diagram contains the concept of social media communication. Use this PPT diagram for business and finance related presentations.
-
 Five staged colored pie graph powerpoint template
We are proud to present our five staged colored pie graph powerpoint template. Graphic of five staged pie graph has been used to craft this power point template diagram. This PPT diagram contains the concept of business result analysis. Use this PPT diagram for business and marketing related presentations.
-
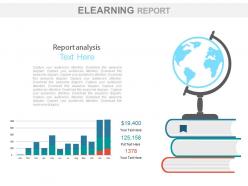 Bar graph for elearning report analysis powerpoint slides
Presenting bar graph for elearning report analysis powerpoint slides. This Power Point template slide has been crafted with graphic of bar graph, book and globe. This PPT slide contains the concept of global e-learning report analysis. Use this PPT slide and build an innovative presentation.
-
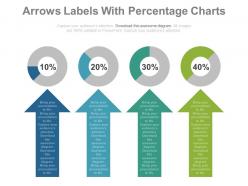 Four arrows labels with percentage charts powerpoint slides
Presenting four arrows labels with percentage charts powerpoint slides. This Power Point template slide has been crafted with graphic of four arrows labels and percentage chart. This PPT slide contains the concept of financial data analysis. Use this PPT slide for business and finance related presentations.
-
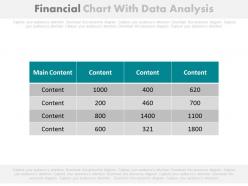 Financial chart with data analysis powerpoint slides
Presenting financial chart with data analysis powerpoint slides. This Power Point template slide has been crafted with graphic of financial chart and data icons. This PPT slide contains the concept of data analysis. Use this PPT slide for business and finance related presentations.
-
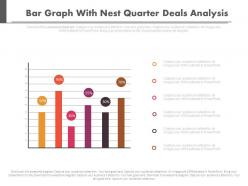 Bar graph with next quarter deals analysis powerpoint slides
Presenting bar graph with next quarter deals analysis powerpoint slides. This is a bar graph with next quarter deals analysis powerpoint slides. This is a six stage process. The stages in this process are financials.
-
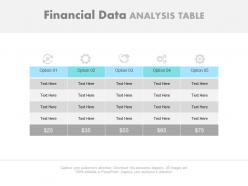 Five staged financial data analysis table powerpoint slides
Presenting five staged financial data analysis table powerpoint slides. This is a five staged financial data analysis table powerpoint slides. This is a five stage process. The stages in this process are financials.
-
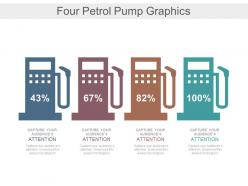 Four petrol pump graphics for financial percentage powerpoint slides
Presenting four petrol pump graphics for financial percentage powerpoint slides. This Power Point template slide has been crafted with graphic of four petrol pump graphics. This PPT slide contains the concept of financial percentage analysis. Use this PPT slide for business and finance related presentations.
-
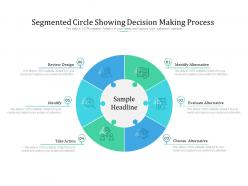 Segmented circle showing decision making process
Presenting this set of slides with name Segmented Circle Showing Decision Making Process. This is a six stage process. The stages in this process are Identify Alternative, Evaluate Alternative, Choose Alternative, Take Action, Identify, Review Design. This is a completely editable PowerPoint presentation and is available for immediate download. Download now and impress your audience.
-
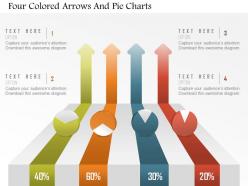 Am four colored arrows and pie charts powerpoint template
We are proud to present our am four colored arrows and pie charts powerpoint template. Graphic of four colored arrows and pie chart has been used to craft this PPT diagram. This PPT diagram contains the concept of financial analysis. Use this PPT and build an exclusive presentation for finance and marketing related topics.
-
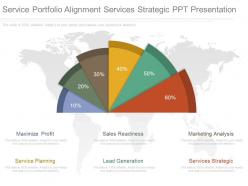 Service portfolio alignment services strategic ppt presentation
Presenting service portfolio alignment services strategic ppt presentation. This is a service portfolio alignment services strategic ppt presentation. This is a six stage process. The stages in this process are maximize profit, sales readiness, marketing analysis, service planning, lead generation, services strategic.
-
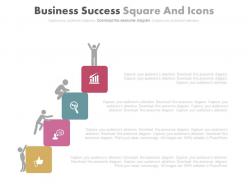 Business success square and icons diagram powerpoint slides
Presenting business success square and icons diagram powerpoint slides. This Power Point template diagram slide has been crafted with graphic of business square and icons diagram. This PPT diagram contains the concept of business success representation. Use this PPT diagram for business and finance related presentations.
-
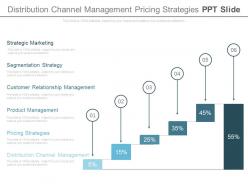 Distribution channel management pricing strategies ppt slide
Presenting distribution channel management pricing strategies ppt slide. This is a distribution channel management pricing strategies ppt slide. This is a six stage process. The stages in this process are management, finance.
-
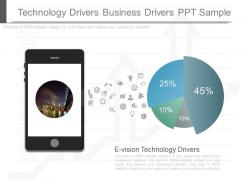 See technology drivers business drivers ppt sample
They will have an eye-opening impact on the audience by their astounding looks. They can be converted into different formats. They are result and technology oriented. They can be customised by changing the size and shape of icons and also by adding logos and images. They are compatible with google. The stages in this process are e vision, technology drivers, finance, marketing.
-
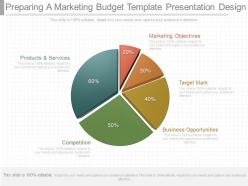 One preparing a marketing budget template presentation design
Presenting one preparing a marketing budget template presentation design. This is a preparing a marketing budget template presentation design. This is a five stage process. The stages in this process are marketing objectives, target mark, business opportunities, competition, products and services.
-
 7 part circle for starting a web based business infographic template
This is a single slide titled 7 Part Circle For Starting A Web Based Business Infographic Template. It is crafted using high quality vector based visuals that are 100 percent editable and available for immediate download in standard and widescreen aspect ratios.
-
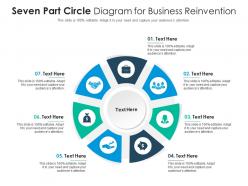 Seven part circle diagram for business reinvention infographic template
Deploy our Seven Part Circle Diagram For Business Reinvention Infographic Template to present high quality presentations. It is designed in PowerPoint and is available for immediate download in standard and widescreen sizes. Not only this, but this layout is also 100 percent editable, giving you full control over its applications.
-
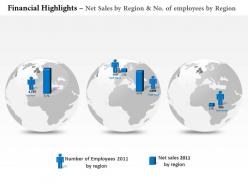 0514 global sales and net revenue financial graphic diagram
Compatibility across various software versions available online and offline. Professionally equipped and articulated set of visuals and information. Wide screen projection does not affect the output adversely. Easy to edit and customize PPT graphics. Precise and easy to comprehend information on PPT sample. Increase the level of personalization with your company logo and name. Compatible with all software and can be saved in any format i.e. jpeg or pdf.
-
 Three staged lego blocks finance business diagram powerpoint template slide
Presentation slideshow goes well with Google slides. PPT diagram can be show in standard and widescreen view. Entirely alterable PowerPoint design as editing is enabled. Simple to download and share with the audience. Similar designs comes with different nodes and stages. Perfect for finance industry and business leaders.
-
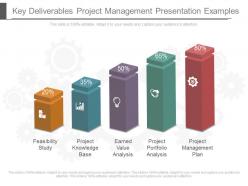 Key deliverables project management presentation examples
Presenting key deliverables project management presentation examples. This is a key deliverables project management presentation examples. This is a five stage process. The stages in this process are feasibility study, project knowledge base, earned value analysis, project portfolio analysis, project management plan.
-
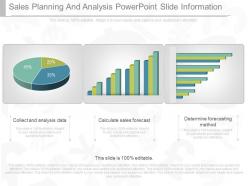 Custom sales planning and analysis powerpoint slide information
Presenting custom sales planning and analysis powerpoint slide information. This is a sales planning and analysis powerpoint slide information. This is a three stage process. The stages in this process are collect and analysis data, calculate sales forecast, determine forecasting method.
-
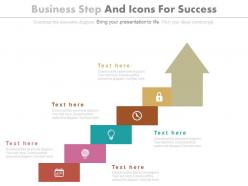 Five staged business steps and icons for success powerpoint slides
Presenting five staged business steps and icons for success powerpoint slides. This Power Point template diagram slide has been crafted with graphic of five staged business steps and icons diagram. This PPT diagram contains the concept of business success representation. Use this PPT diagram for business and marketing related presentations.
-
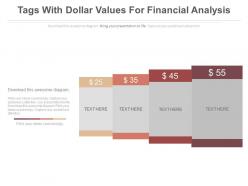 Four tags with dollar values for financial analysis powerpoint slides
Presenting four tags with dollar values for financial analysis powerpoint slides. This is a four tags with dollar values for financial analysis powerpoint slides. This is a four stage process. The stages in this process are financials.
-
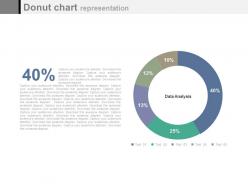 Circle donut chart with percentage graph powerpoint slides
Presenting circle donut chart with percentage graph powerpoint slides. This Power Point template slide has been crafted with graphic of circle donut chart and percentage graph .This PPT slide contains the concept of financial analysis. Use this PPT slide for business and finance related presentations.
-
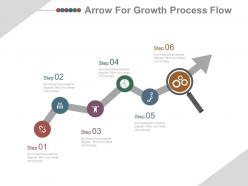 Six staged icons growth arrow for process flow powerpoint slides
Presenting six staged icons growth arrow for process flow powerpoint slides. This Power Point template slide has been crafted with graphic of six staged arrow and icons. This PPT slide contains the concept of process flow analysis. Use this PPT slide for business and finance related presentations.
-
 0414 pie chart for financial result
We are proud to present our 0414 pie chart for financial result. Activate the energies of your audience with our pie chart for financial result Powerpoint Templates. Get their creative juices flowing with your words. Enhance the stature of your presentation with our pie chart for financial result Powerpoint Templates. Adorn the beauty of your thoughts with their colourful backgrounds.
-
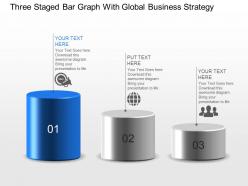 Three staged bar graph with global business strategy powerpoint template slide
We are proud to present our three staged bar graph with global business strategy powerpoint template slide. Graphic of three staged bar graph has been used to craft this power point template diagram. This PPT diagram contains the concept of business strategy .Use this PPT diagram for business and management related presentations.
-
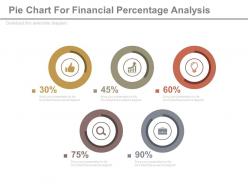 Five pie charts for financial percentage analysis powerpoint slides
Presenting five pie charts for financial percentage analysis powerpoint slides. This Power Point template slide has been crafted with graphic of five pie charts. This PPT slide contains the concept of financial percentage analysis. Use this PPT slide for business and finance related presentations.
-
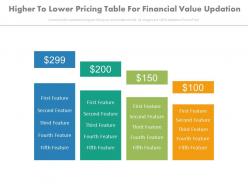 Higher to lower pricing table for financial value updation powerpoint slides
Presenting higher to lower pricing table for financial value updation powerpoint slides. This Power Point template slide has been crafted with graphic of pricing table. This PPT slide contains the concept of higher to lower financial value updation and representation. Use this PPT slide for business and finance related presentations.
-
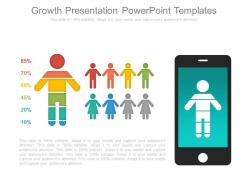 Growth presentation powerpoint templates
Presenting growth presentation powerpoint templates. This is a growth presentation powerpoint templates. This is a one stage process. The stages in this process are business, mobile, presentation,diagram, percentage.
-
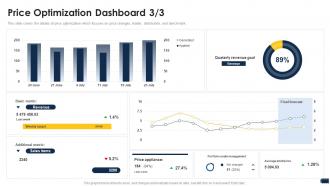 Price optimization dashboard companys pricing strategies
This slide covers the details of price optimization which focuses on price changes, leader, distribution, and benchmark. Present the topic in a bit more detail with this Price Optimization Dashboard Companys Pricing Strategies. Use it as a tool for discussion and navigation on Price Optimization Dashboard. This template is free to edit as deemed fit for your organization. Therefore download it now.
-
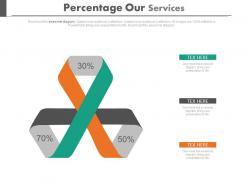 Three staged percentage our services diagram powerpoint slides
Presenting three staged percentage our services diagram powerpoint slides. This Power Point template diagram slide has been crafted with graphic of three staged percentage diagram. This PPT diagram slide contains the concept of our services representation. Use this PPT slide for finance and business related presentations.
-
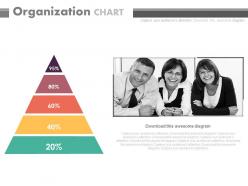 Triangle with percentage organization chart powerpoint slides
Presenting triangle with percentage organization chart powerpoint slides. This Power Point template slide has been crafted with graphic of triangle and percentage..This PPT slide contains the concept of financial data analysis. Use this PPT slide for business and finance related presentations.
-
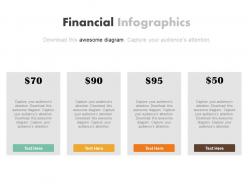 Four different price tags for finance powerpoint slides
Presentation slide graphic of four different price tags for finance. Can be used by marketers, sales people, business analysts, etc. Compatible with number of software options. Colors and text can be easily changed as the PPT slide is completely editable. Personalize the presentation with individual company name and logo. Available in both Standard and Widescreen slide size. Easy and quick downloading process. Flexible option for conversion in PDF or JPG formats. Can use with Google slides.
-
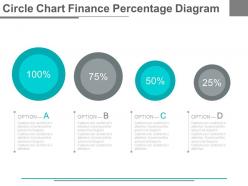 Four circle chart with finance percentage diagram powerpoint slides
Presentation slide representing circle charts with finance percentages. Useful combination of charts and percentages. Compatible with number of software options. Colors, text and fonts can be easily changed as the PPT slide is completely editable. Personalize the presentation with individual company name and logo. Available in both Standard and Widescreen slide size. Easy and quick downloading process. Flexible option for conversion in PDF or JPG formats. Can use with Google slides.
-
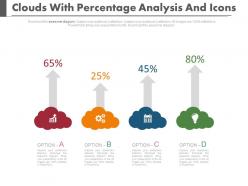 Four clouds with percentage analysis and icons powerpoint slides
Presenting four clouds with percentage analysis and icons powerpoint slides. This Power Point template diagram with graphic of four clouds and percentage. This PPT diagram contains the concept of financial analysis. Use this PPT diagram for business and finance related presentations.
-
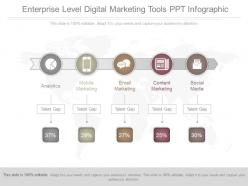 See enterprise level digital marketing tools ppt infographic
Presenting see enterprise level digital marketing tools ppt infographic. This is a enterprise level digital marketing tools ppt infographic. This is five stage process. The stages in this proces are analytics, mobile marketing, email marketing, content marketing, social media.
-
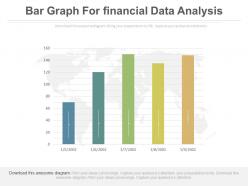 Five staged bar graph for financial data analysis powerpoint slides
Presenting five staged bar graph for financial data analysis powerpoint slides. This Power Point template slide has been crafted with graphic of five staged bar graph. This PPT slide contains the concept of financial data analysis. Use this PPT slide for business and finance related presentations.
-
 Ml pie chart percentage growth indication powerpoint template
Presenting ml pie chart percentage growth indication powerpoint template. This Power Point template diagram has been crafted with graphic of pie chart and percentage diagram. This PPT diagram contains the concept of growth indication. Use this PPT diagram for business and marketing related presentations.
-
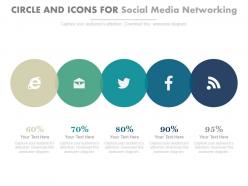 Five circles and icons for social media networking powerpoint slides
Presenting five circles and icons for social media networking powerpoint slides. This Power Point template diagram with graphic of five circles and icons. This PPT diagram contains the concept of social media networking. Use this PPT diagram for business and internet related presentations.
-
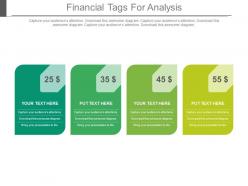 Four staged financial tags for analysis powerpoint slides
Presenting four staged financial tags for analysis powerpoint slides. This Power Point template diagram with graphic of four staged tags. This PPT diagram contains the concept of financial analysis. Use this PPT diagram for business and finance related presentations.
-
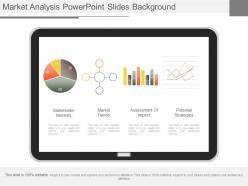 Use market analysis powerpoint slides background
Presenting use market analysis powerpoint slides background. This is a market analysis powerpoint slides background. This is a four stage process. The stages in this process are stakeholder interests, market trends, assessment of impact, potential strategies.
-
 Business peoples social media percentage powerpoint slides
Presenting business peoples social media percentage powerpoint slides. This Power Point template diagram slide has been crafted with graphic of business peoples and percentage diagram. This PPT diagram contains the concept of social media communication. Use this PPT diagram for business and internet related presentations.
-
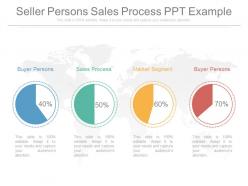 Seller persons sales process ppt example
Presenting seller persons sales process ppt example. This is a seller persons sales process ppt example. This is a four stage process. The stages in this process are finance, business, management.
-
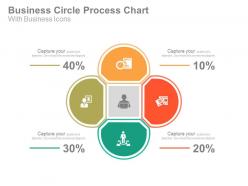 Business circle process chart with business icons powerpoint slides
Presenting business circle process chart with business icons powerpoint slides. This Power Point template diagram has been crafted with graphic of business circle process chart and icons diagram. This PPT diagram contains the concept of business process analysis. Use this PPT diagram for business and finance related presentations.
-
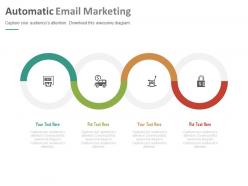 Four staged automatic email marketing powerpoint slides
Presenting four staged automatic email marketing powerpoint slides. This Power Point template diagram has been crafted with graphic of email diagram. This PPT diagram contains the concept of automatic email marketing. Use this PPT diagram for business and marketing related presentations.
-
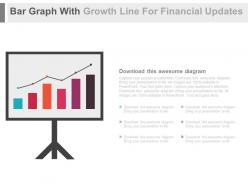 Bar graph with growth line for financial updates powerpoint slides
Presenting bar graph with growth line for financial updates powerpoint slides. This is a bar graph with growth line for financial updates powerpoint slides. This is a one stage process. The stages in this process are financials.
-
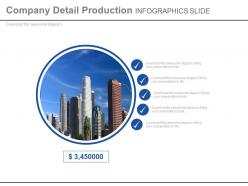 Company detail product infographics slide powerpoint slides
Presenting company detail product infographics slide powerpoint slides. This is a company detail product infographics slide powerpoint slides. This is a one stage process. The stages in this process are financials.
-
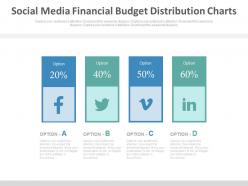 Social media financial budget distribution charts powerpoint slides
Presenting social media financial budget distribution charts powerpoint slides. This Power Point template slide has been crafted with graphic of distribution chart diagram. This PPT slide contains the concept of financial budget distribution for social media usage. Use this PPT slide for business and finance related presentations.
-
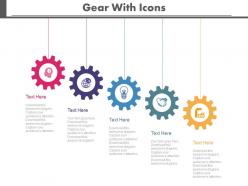 Colored gears with icons for process control powerpoint slides
Presenting colored gears with icons for process control powerpoint slides. This Power Point template diagram slide has been crafted with graphic of colored gears and icons diagram. This PPT diagram contains the concept of business process control representation. Use this PPT diagram for business and finance related presentations.
-
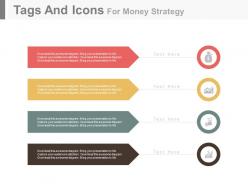 Four colored tags and icons for money strategy powerpoint slides
Presenting four colored tags and icons for money strategy powerpoint slides. This Power Point template diagram slide has been crafted with graphic of four colored tags and icons diagram. This PPT diagram contains the concept of money strategy representation. Use this PPT diagram for business and marketing related presentations.
-
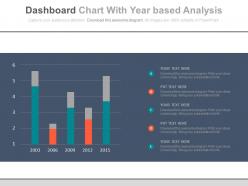 Dashboard chart with year based analysis powerpoint slides
Presenting dashboard chart with year based analysis powerpoint slides. This Power Point template slide has been crafted with graphic of dashboard chart. This PPT slide contains the concept of year based analysis. Use this PPT slide for business and finance related presentations.
-
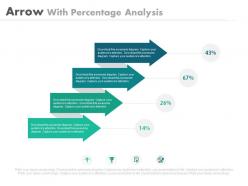 Four arrows with percentage analysis powerpoint slides
Presenting four arrows with percentage analysis powerpoint slides. This Power Point template slide has been crafted with graphic of four arrows and percentage icons. This PPT slide contains the concept of percentage analysis representation. Use this PPT slide for business and finance related presentations.
-
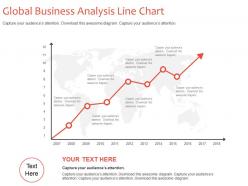 Global business analysis line chart powerpoint slides
Presenting global business analysis line chart powerpoint slides. This Power Point template slide has been crafted with graphic of line chart. This PPT slide contains the concept of global business analysis representation. Use this PPT slide for business and finance related presentations.
-
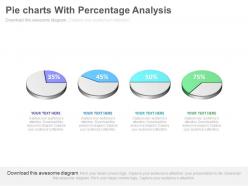 Four pie charts with percentage analysis powerpoint slides
Presenting four pie charts with percentage analysis powerpoint slides. This is a four pie charts with percentage analysis powerpoint slides. This is a four stage process. The stages in this process are financials.
-
 Six staged pie chart for financial management analysis powerpoint slides
Presenting six staged pie chart for financial management analysis powerpoint slides. This Power Point template diagram has been crafted with graphic of six staged pie chart and percentage diagram. This PPT diagram contains the concept of financial management analysis. Use this PPT diagram for business and finance related presentations.


