Pricing Strategies PowerPoint Templates, Presentation Slides & PPT Templates
- Sub Categories
-
- 30 60 90 Day Plan
- About Us Company Details
- Action Plan
- Agenda
- Annual Report
- Audit Reports
- Balance Scorecard
- Brand Equity
- Business Case Study
- Business Communication Skills
- Business Plan Development
- Business Problem Solving
- Business Review
- Capital Budgeting
- Career Planning
- Change Management
- Color Palettes
- Communication Process
- Company Location
- Company Vision
- Compare
- Competitive Analysis
- Corporate Governance
- Cost Reduction Strategies
- Custom Business Slides
- Customer Service
- Dashboard
- Data Management
- Decision Making
- Digital Marketing Strategy
- Digital Transformation
- Disaster Management
- Diversity
- Equity Investment
- Financial Analysis
- Financial Services
- Financials
- Growth Hacking Strategy
- Human Resource Management
- Innovation Management
- Interview Process
- Knowledge Management
- Leadership
- Lean Manufacturing
- Legal Law Order
- Management
- Market Segmentation
- Marketing
- Media and Communication
- Meeting Planner
- Mergers and Acquisitions
- Metaverse
- Newspapers
- Operations and Logistics
- Organizational Structure
- Our Goals
- Performance Management
- Pitch Decks
- Pricing Strategies
- Process Management
- Product Development
- Product Launch Ideas
- Product Portfolio
- Project Management
- Purchasing Process
- Quality Assurance
- Quotes and Testimonials
- Real Estate
- Risk Management
- Sales Performance Plan
- Sales Review
- SEO
- Service Offering
- Six Sigma
- Social Media and Network
- Software Development
- Solution Architecture
- Stock Portfolio
- Strategic Management
- Strategic Planning
- Supply Chain Management
- Swimlanes
- System Architecture
- Team Introduction
- Testing and Validation
- Thanks-FAQ
- Time Management
- Timelines Roadmaps
- Value Chain Analysis
- Value Stream Mapping
- Workplace Ethic
-
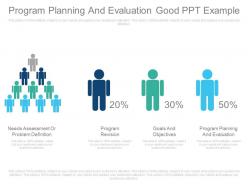 Custom program planning and evaluation good ppt example
Presenting custom program planning and evaluation good ppt example. This is a program planning and evaluation good ppt example. This is a four stage process. The stages in this process are needs assessment or problem definition, program revision, goals and objectives, program planning and evaluation.
-
 Business contingency planning templates market pricing strategies projects management cpb
Presenting this set of slides with name - Business Contingency Planning Templates Market Pricing Strategies Projects Management Cpb. This is an editable six graphic that deals with topics like Business Contingency Planning Templates, Market Pricing Strategies, Projects Management to help convey your message better graphically. This product is a premium product available for immediate download, and is 100 percent editable in Powerpoint. Download this now and use it in your presentations to impress your audience
-
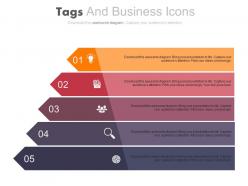 Five staged colored tags and business icons powerpoint slides
Presenting five staged colored tags and business icons powerpoint slides. This Power Point template diagram slide has been crafted with graphic of five staged colored tags and icons diagram. This PPT diagram contains the concept of business data representation. Use this PPT diagram for business and marketing related presentations.
-
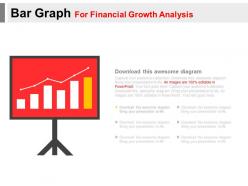 Bar graph for financial growth analysis powerpoint slides
Presenting bar graph for financial growth analysis powerpoint slides. This Power Point template slide has been crafted with graphic of bar graph and finance icons. This PPT slide contains the concept of year based financial growth analysis. Use this PPT slide for business and finance related presentations.
-
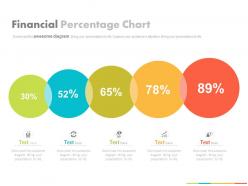 Five staged financial percentage chart powerpoint slides
Presenting five staged financial percentage chart powerpoint slides. This Power Point template slide has been crafted with graphic of five staged percentage chart. This PPT slide contains the concept of financial analysis. Use this PPT slide for business and finance related presentations.
-
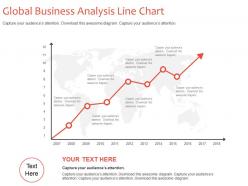 Global business analysis line chart powerpoint slides
Presenting global business analysis line chart powerpoint slides. This Power Point template slide has been crafted with graphic of line chart. This PPT slide contains the concept of global business analysis representation. Use this PPT slide for business and finance related presentations.
-
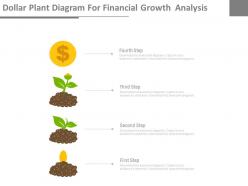 Dollar plant diagram for financial growth analysis powerpoint slides
Presenting dollar plant diagram for financial growth analysis powerpoint slides. This Power Point template diagram with graphic of dollar plant and finance icons. This PPT diagram contains the concept of financial growth analysis. Use this PPT diagram for business and finance related presentations.
-
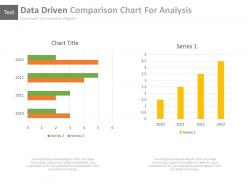 Two data driven comparison charts for analysis powerpoint slides
Presenting two data driven comparison charts for analysis powerpoint slides. This Power Point template diagram with graphic of two data driven chart diagram. This PPT diagram contains the concept of data comparison analysis. Use this PPT diagram for business and finance related presentations.
-
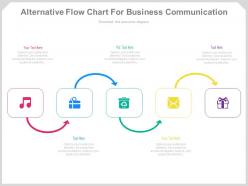 Alternative flow chart for business communication powerpoint slides
Presenting alternative flow chart for business communication powerpoint slides. This Power Point template diagram has been crafted with graphic of alternative flow chart diagram. This PPT diagram contains the concept of business communication. Use this PPT diagram for business and management related presentations.
-
 0314 layout for financial information
We are proud to present our 0314 layout for financial information. Our 0314 Layout For Financial Information are effectively colour coded to priorities your plans. They automatically highlight the sequence of events you desire.
-
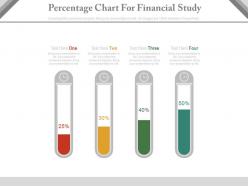 Four staged percentage chart for financial study powerpoint slides
Presenting four staged percentage chart for financial study powerpoint slides. This Power Point template diagram slide has been crafted with graphic of four staged circle and percentage chart. This PPT diagram slide contains the concept of financial study representation. Use this PPT slide for finance and business related presentations.
-
 Pptx management foundation powerpoint slide download
Presenting pptx management foundation powerpoint slide download. This is a management foundation powerpoint slide download. This is a five stage process. The stages in this process are engineering foundation, management foundation, design electives, thesis project, leadership electives.
-
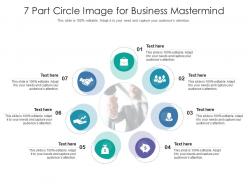 7 part circle image for business mastermind infographic template
This is our 7 Part Circle Image For Business Mastermind Infographic Template designed in PowerPoint, however, you can also access it in Google Slides. It comes in two aspect ratios standard and widescreen, with fully editable visual content.
-
 Seven part circle for starting a web based business infographic template
Deploy our Seven Part Circle For Starting A Web Based Business Infographic Template to present high quality presentations. It is designed in PowerPoint and is available for immediate download in standard and widescreen sizes. Not only this, but this layout is also 100 percent editable, giving you full control over its applications.
-
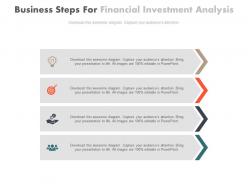 Four tags business steps for financial investment analysis powerpoint slides
Presenting four tags business steps for financial investment analysis powerpoint slides. This Power Point template diagram has been crafted with graphic of four tags and business steps diagram. This PPT diagram contains the concept of financial investment analysis representation. Use this PPT diagram for business and finance related presentations.
-
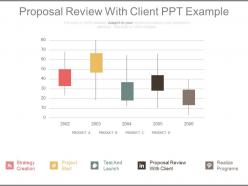 Proposal review with client ppt example
Presenting proposal review with client ppt example. This is a proposal review with client ppt example. This is a five stage process. The stages in this process are finance, business, management.
-
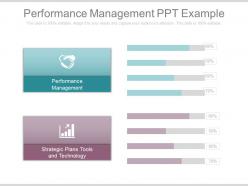 Performance management ppt example
This PowerPoint template is a modern way to represent performance management of your organization through a presentation. You can easily alter the text by editing it in PowerPoint software and include your company logo. You can change the color of the block diagram shown in the figure and choose it according to your liking. Use it in full screen mode after downloading. The stages in this process are performance management, strategic plans tools and technology.
-
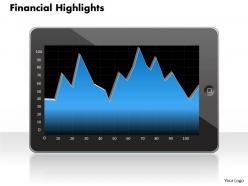 0314 financial graph
We are proud to present our 0314 financial graph. Subscribe to our Data Driven Financial Graph and receive great value for your money. Be assured of finding the best projection to highlight your words.
-
 Arrow upward and downward with percentage chart powerpoint slides
Presenting arrow upward and downward with percentage chart powerpoint slides. This Power Point template diagram has been crafted with graphic of arrow in upward and downward directions with percentage chart diagram. This PPT diagram contains the concept of financial process flow. Use this PPT diagram for business and finance related presentations.
-
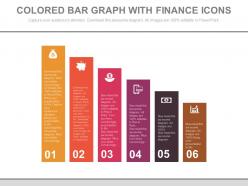 Six staged colored bar graph with finance icons powerpoint slides
Presenting six staged colored bar graph with finance icons powerpoint slides. This Power Point template diagram has been crafted with graphic of six staged colored bar graph and finance icons diagram. This PPT diagram contains the concept of financial data analysis representation. Use this PPT diagram for business and finance related presentations.
-
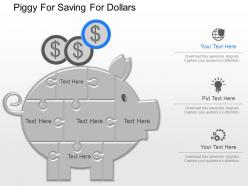 Ppt piggy for saving for dollars powerpoint template
Presenting ppt piggy for saving for dollars powerpoint template. This Power Point template diagram has been crafted with graphic of piggy and dollars. This PPT diagram contains the concept of money saving and investment representation. Use this PPT diagram for business and finance related presentations.
-
 Business man text boxes for communication idea generation powerpoint slides
Presenting business man text boxes for communication idea generation powerpoint slides. This Power Point template diagram slide has been crafted with graphic of business man and text boxes. This PPT diagram contains the concept of idea generation and communication. Use this PPT diagram for business and finance related presentations.
-
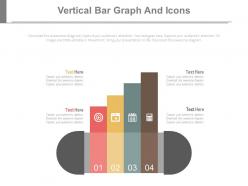 Four staged vertical bar graph and icons powerpoint slides
Presenting four staged vertical bar graph and icons powerpoint slides. This Power Point template diagram slide has been crafted with graphic of four staged vertical bar graph and icons diagram. This PPT diagram contains the concept of financial analysis. Use this PPT diagram for business and marketing related presentations.
-
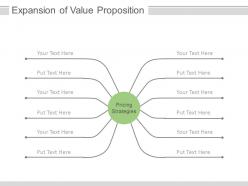 Expansion of value proposition pricing strategies ppt slides
Presenting expansion of value proposition pricing strategies ppt slides. This is a expansion of value proposition pricing strategies ppt slides. This is a one stage process. The stages in this process are strategy, business, management.
-
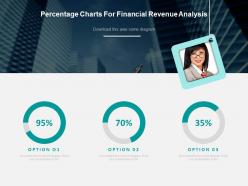 Percentage charts for financial revenue analysis powerpoint slides
Presenting percentage charts for financial revenue analysis powerpoint slides. This is a percentage charts for financial revenue analysis powerpoint slides. This is a three stage process. The stages in this process are financials.
-
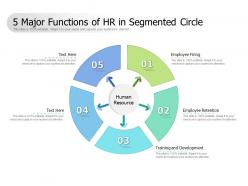 5 major functions of hr in segmented circle
Presenting this set of slides with name 5 Major Functions Of HR In Segmented Circle. This is a five stage process. The stages in this process are Employee Firing, Employee Retention, Training And Development. This is a completely editable PowerPoint presentation and is available for immediate download. Download now and impress your audience.
-
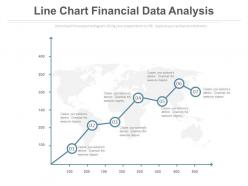 Line chart for finance data analysis powerpoint slides
Perfect PPT slide for marketing and sales people, business analysts, market researchers. Completely editable content including fonts, text, colors, etc. Useful illustration of numerical figures using editable excel linked chart. Compatible with number of software options. Personalize the presentation with individual company name and logo. Excellence in picture quality even on wide screen output. Easy and quick downloading process. Flexible option for conversion in PDF or JPG formats. Compatible with Google slides.
-
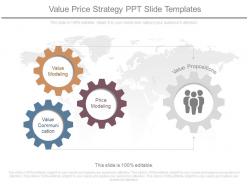 Value price strategy ppt slide templates
Presenting value price strategy ppt slide templates. This is a value price strategy ppt slide templates. This is a three stage process. The stages in this process are value modeling, value communication, price modeling, value propositions.
-
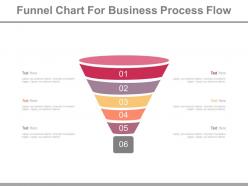 Six staged funnel chart for business process flow powerpoint slides
Presenting six staged funnel chart for business process flow powerpoint slides. This Power Point template diagram has been crafted with graphic of six staged funnel chart diagram. This PPT diagram contains the concept of business process flow representation. Use this PPT diagram for business and finance related presentations.
-
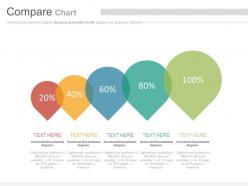 Linear sequential compare chart with percentage powerpoint slides
Presenting linear sequential compare chart with percentage powerpoint slides. This Power Point template diagram slide has been crafted with graphic of linear sequential chart and percentage diagram. This PPT diagram contains the concept of data comparison analysis representation. Use this PPT diagram for business and finance related presentations.
-
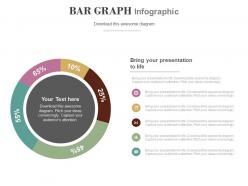 Circle bar graph with percentage analysis powerpoint slides
Presenting circle bar graph with percentage analysis powerpoint slides. This Power Point template slide has been crafted with graphic of circle bar graph and percentage icons. This PPT slide contains the concept of financial analysis. Use this PPT slide for business and marketing related presentations.
-
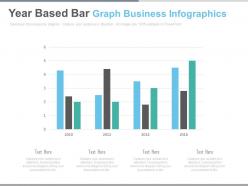 Year based bar graph business infographics powerpoint slides
Presenting year based bar graph business infographics powerpoint slides. This Power Point template diagram with graphic of year based bar graph diagram. This PPT diagram contains the concept of data analysis. Use this PPT diagram for business and finance related presentations.
-
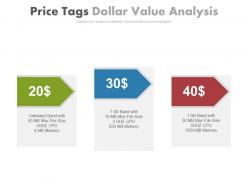 Three price tags dollar value analysis powerpoint slides
Presenting three price tags dollar value analysis powerpoint slides. This is a three price tags dollar value analysis powerpoint slides. This is a three stage process. The stages in this process are financials.
-
 Existing business loan or investment ppt sample
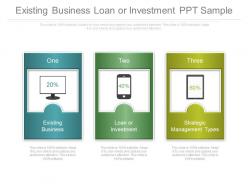
Presenting existing business loan or investment ppt sample. This is a existing business loan or investment ppt sample. This is a three stage process. The stages in this process are business, finance, strategy.
-
 Blackboard with text boxes for financial analysis powerpoint slides
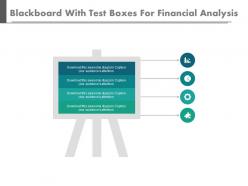
Presenting blackboard with text boxes for financial analysis powerpoint slides. This Power Point template diagram slide has been crafted with graphic of black board and text boxes. This PPT diagram contains the concept of financial analysis. Use this PPT diagram for business and finance related presentations.
-
 Four staged circle with percentage icons powerpoint slides
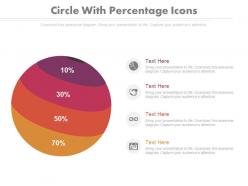
Presenting four staged circle with percentage icons powerpoint slides. This Power Point template diagram slide has been crafted with graphic of four staged circle and percentage icons. This PPT diagram slide contains the concept of financial analysis representation. Use this PPT slide for finance and business related presentations.
-
 Seven staged cost flow model powerpoint slides
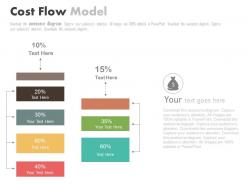
Presenting seven staged cost flow model powerpoint slides. This Power Point template slide has been crafted with graphic of seven staged cost flow model. This PPT slide contains the concept of financial analysis. Use this PPT slide for business and finance related presentations.
-
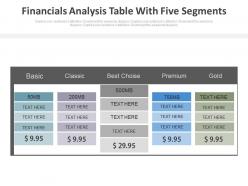 Financial analysis table with five segments powerpoint slides
Presenting financial analysis table with five segments powerpoint slides. This Power Point template diagram with graphic of finance table with five segments. This PPT diagram contains the concept of financial analysis. Use this PPT diagram for business and finance related presentations.
-
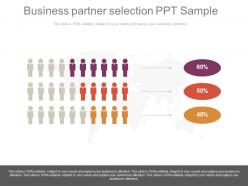 Business partner selection ppt sample
Presenting business partner selection ppt sample. This is a business partner selection ppt sample. This is a three stage process. The stages in this process are business, finance, teamwork, management, success.
-
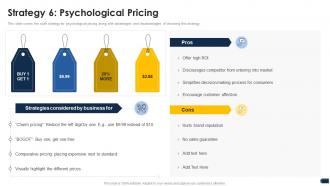 Companys pricing strategies strategy 6 psychological pricing
This slide covers the sixth strategy for psychological pricing along with advantages and disadvantages of choosing this strategy. Increase audience engagement and knowledge by dispensing information using Companys Pricing Strategies Strategy 6 Psychological Pricing. This template helps you present information on four stages. You can also present information on Strategies, Business, Competitor using this PPT design. This layout is completely editable so personaize it now to meet your audiences expectations.
-
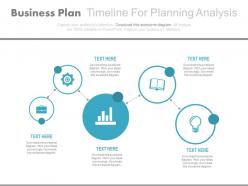 Business plan timeline for planning analysis powerpoint slides
Presenting business plan timeline for planning analysis powerpoint slides. This Power Point template diagram has been crafted with graphic of business plan timeline diagram. This PPT diagram contains the concept of business planning analysis and timeline formation. Use this PPT diagram for business and finance related presentations.
-
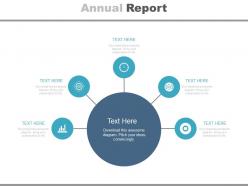 Five staged annual report for business powerpoint slides
Presenting five staged annual report for business powerpoint slides. This Power Point template diagram has been crafted with graphic of five staged annual report diagram. This PPT diagram contains the concept of annual report analysis. Use this PPT diagram for business and finance related presentations.
-
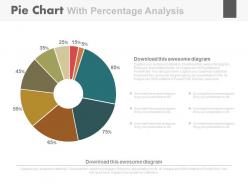 Pie chart with percentage analysis and icons powerpoint slides
Presenting pie chart with percentage analysis and icons powerpoint slides. This Power Point template diagram has been crafted with graphic of pie chart and percentage diagram. This PPT diagram contains the concept of percentage analysis representation. Use this PPT diagram for business and finance related presentations.
-
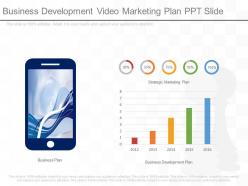 Business development video marketing plan ppt slide
PPT slide supports resize, recolor and reverse the images. Good quality images can be used to compliment and reinforce message. Works well in Windows 7, 8, 10, XP, Vista and Citrix. Editing in presentation slide show can be done from anywhere by any device. Elegant and beautiful presentation which can be oriented and customized according to requirement.The stages in this process are marketing, communication, technology, finance, internet.
-
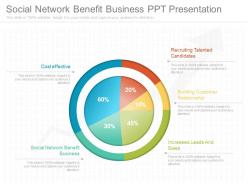 Social network benefit business ppt presentation
Presenting social network benefit business ppt presentation. This is a social network benefit business ppt presentation. This is a five stage process. The stages in this process are process, strategy, finance, marketing.
-
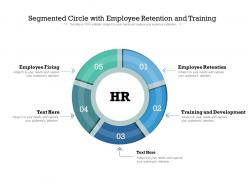 Segmented circle with employee retention and training
Presenting this set of slides with name Segmented Circle With Employee Retention And Training. This is a five stage process. The stages in this process are Employee Retention, Training And Development, Employee Firing. This is a completely editable PowerPoint presentation and is available for immediate download. Download now and impress your audience.
-
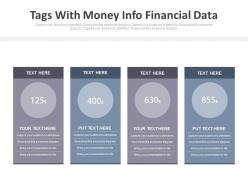 Four tags with money info financial data powerpoint slides
Presenting four tags with money info financial data powerpoint slides. This is a four tags with money info financial data powerpoint slides. This is a four stage process. The stages in this process are financials.
-
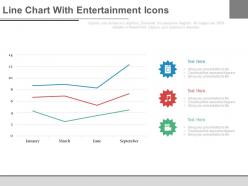 Line chart with entertainment icons month based analysis powerpoint slides
Presenting line chart with entertainment icons month based analysis powerpoint slides. This is a line chart with entertainment icons month based analysis powerpoint slides. This is a three stage process. The stages in this process are financials.
-
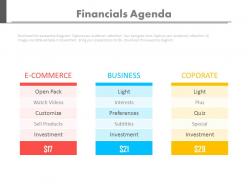 Three tags for ecommerce business and financial agendas powerpoint slides
Presenting three tags for ecommerce business and financial agendas powerpoint slides. This Power Point template diagram slide has been crafted with graphic of three tags diagram. This PPT diagram slide contains the concept of business and financial agenda representation. Use this PPT slide for finance and business related presentations.
-
 Four colored tags and percentage analysis powerpoint slides
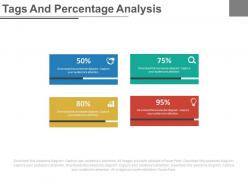
Presenting four colored tags and percentage analysis powerpoint slides. This Power Point template slide has been crafted with graphic of four colored tags and percentage icons. This PPT slide contains the concept of financial data analysis representation. Use this PPT slide for business and finance related presentations.
-
 New product pricing strategies ppt sample download
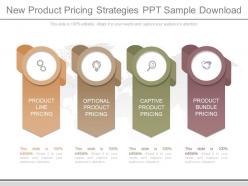
Presenting new product pricing strategies ppt sample download. This is a new product pricing strategies ppt sample download. This is a four stage process. The stages in this process are product line pricing, optional product pricing, captive product pricing, product bundle pricing.
-
 Five staged bar graph horizontal arrow diagram powerpoint slides
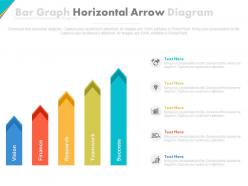
Presenting five staged bar graph horizontal arrow diagram powerpoint slides. This Power Point template diagram slide has been crafted with graphic of five staged bar graph and arrow diagram. This PPT diagram contains the concept of business data analysis representation. Use this PPT diagram for business and data related presentations.
-
 Strategic planning services powerpoint layout
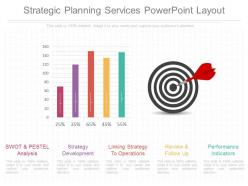
Presenting strategic planning services powerpoint layout. This is a strategic planning services powerpoint layout. This is a five stage process. The stages in this process are swot and pastel analysis, strategy development, linking strategy to operations, review and follow up, performance indicators.
-
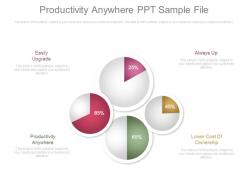 Productivity anywhere ppt sample file
Presenting productivity anywhere ppt sample file. This is a productivity anywhere ppt sample file. This is a four stage process. The stages in this process are easily upgrade, always up, productivity anywhere, lower cost of ownership.
-
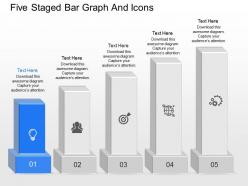 Is five staged bar graph and icons powerpoint template
Presenting is five staged bar graph and icons powerpoint template. Graphic of five staged bar graph and icons has been used to craft this power point template diagram. This PPT diagram contains concept of business result analysis representation. Use this PPT diagram for business and marketing related presentations.
-
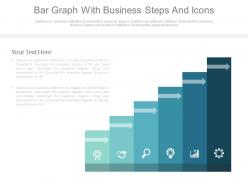 Bar graph with business steps and icons powerpoint slides
Presenting bar graph with business steps and icons powerpoint slides. This is a bar graph with business steps and icons powerpoint slides. This is a three stage process. The stages in this process are financials.
-
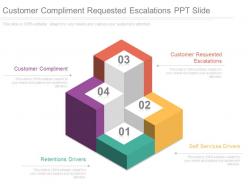 Customer compliment requested escalations ppt slide
Presenting customer compliment requested escalations ppt slide. This is a customer compliment requested escalations ppt slide. This is a four stage process. The stages in this process are strategy, leadership, winners.
-
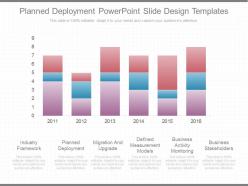 Download planned deployment powerpoint slide design templates
Presenting download planned deployment powerpoint slide design templates. This is a planned deployment powerpoint slide design templates. This is a six stage process. The stages in this process are industry framework, planned deployment, migration and upgrade, defined measurement models, business activity monitoring, business stakeholders.
-
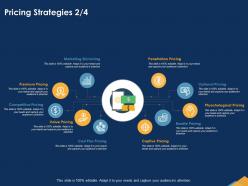 Pricing strategies cost plus pricing ppt powerpoint presentation professional
Presenting this set of slides with name Pricing Strategies Cost Plus Pricing Ppt Powerpoint Presentation Professional. This is a ten stage process. The stages in this process are Marketing Skimming, Penetration Pricing, Optional Pricing, Phycological Pricing, Bundle Pricing. This is a completely editable PowerPoint presentation and is available for immediate download. Download now and impress your audience.
-
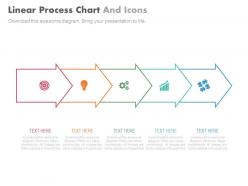 Five staged linear process chart and icons powerpoint slides
Presenting five staged linear process chart and icons powerpoint slides. This Power Point template diagram slide has been crafted with graphic of five staged linear process chart and icons . This PPT diagram slide contains the concept of business process flow. Use this PPT slide for finance and business related presentations.


