Financials PowerPoint Templates, Financial Statement PPT Templates
- Sub Categories
-
- 30 60 90 Day Plan
- About Us Company Details
- Action Plan
- Agenda
- Annual Report
- Audit Reports
- Balance Scorecard
- Brand Equity
- Business Case Study
- Business Communication Skills
- Business Plan Development
- Business Problem Solving
- Business Review
- Capital Budgeting
- Career Planning
- Change Management
- Color Palettes
- Communication Process
- Company Location
- Company Vision
- Compare
- Competitive Analysis
- Corporate Governance
- Cost Reduction Strategies
- Custom Business Slides
- Customer Service
- Dashboard
- Data Management
- Decision Making
- Digital Marketing Strategy
- Digital Transformation
- Disaster Management
- Diversity
- Equity Investment
- Financial Analysis
- Financial Services
- Financials
- Growth Hacking Strategy
- Human Resource Management
- Innovation Management
- Interview Process
- Knowledge Management
- Leadership
- Lean Manufacturing
- Legal Law Order
- Management
- Market Segmentation
- Marketing
- Media and Communication
- Meeting Planner
- Mergers and Acquisitions
- Metaverse
- Newspapers
- Operations and Logistics
- Organizational Structure
- Our Goals
- Performance Management
- Pitch Decks
- Pricing Strategies
- Process Management
- Product Development
- Product Launch Ideas
- Product Portfolio
- Project Management
- Purchasing Process
- Quality Assurance
- Quotes and Testimonials
- Real Estate
- Risk Management
- Sales Performance Plan
- Sales Review
- SEO
- Service Offering
- Six Sigma
- Social Media and Network
- Software Development
- Solution Architecture
- Stock Portfolio
- Strategic Management
- Strategic Planning
- Supply Chain Management
- Swimlanes
- System Architecture
- Team Introduction
- Testing and Validation
- Thanks-FAQ
- Time Management
- Timelines Roadmaps
- Value Chain Analysis
- Value Stream Mapping
- Workplace Ethic
-
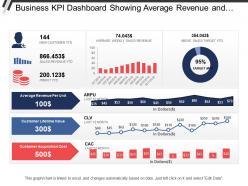 Business Kpi Dashboard Showing Average Revenue And Clv
Presenting this set of slides with name - Business Kpi Dashboard Showing Average Revenue And Clv. This is a three stage process. The stages in this process are Business Dashboard, Business Kpi, Business Performance.
-
 Project Issue Tracking KPI Dashboard
This slide illustrates the dashboard for the project issue tracking and management. It includes the column chart for issues assignee, incomplete issues by priority and project, monthly percentage increase in issues created and closed, etc. Presenting our well structured Project Issue Tracking KPI Dashboard. The topics discussed in this slide are Project Issue Tracking, KPI Dashboard, Issue Status. This is an instantly available PowerPoint presentation that can be edited conveniently. Download it right away and captivate your audience.
-
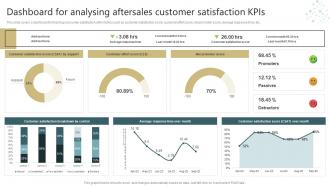 Conducting Successful Customer Dashboard For Analysing Aftersales Customer Satisfaction Kpis
This slide covers a dashboard for tracking consumer satisfaction with metrics such as customer satisfaction score, customer effort score, net promoter score, average response time, etc. Present the topic in a bit more detail with this Conducting Successful Customer Dashboard For Analysing Aftersales Customer Satisfaction Kpis. Use it as a tool for discussion and navigation on Satisfaction, Response, Promoter. This template is free to edit as deemed fit for your organization. Therefore download it now.
-
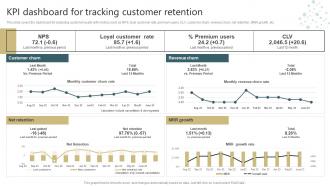 Conducting Successful Customer Kpi Dashboard For Tracking Customer Retention
This slide covers the dashboard for analyzing customer loyalty with metrics such as NPS, loyal customer rate, premium users, CLV, customer churn, revenue churn, net retention, MRR growth, etc. Deliver an outstanding presentation on the topic using this Conducting Successful Customer Kpi Dashboard For Tracking Customer Retention. Dispense information and present a thorough explanation of Rate, Premium Users using the slides given. This template can be altered and personalized to fit your needs. It is also available for immediate download. So grab it now.
-
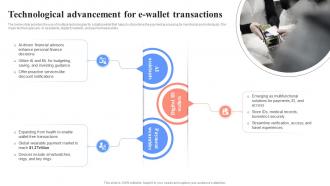 Technological Advancement For Unlocking Digital Wallets All You Need Fin SS
The below slide provides the use of multiple technologies for a digital wallet that helps to streamline the payment processing for merchants and individuals. The major technologies are AI assistants, digital ID wallets, and payment wearables. Increase audience engagement and knowledge by dispensing information using Technological Advancement For Unlocking Digital Wallets All You Need Fin SS. This template helps you present information on three stages. You can also present information on AI Assistants, Digital Id Wallets, Payment Wearables using this PPT design. This layout is completely editable so personaize it now to meet your audiences expectations.
-
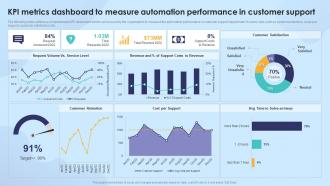 Strengthening Process Improvement KPI Metrics Dashboard To Measure Automation Performance
The following slide outlines a comprehensive KPI dashboard which can be used by the organization to measure the automation performance in customer support department. It covers kpis such as customer retention, costs per support, customer satisfaction, etc. Present the topic in a bit more detail with this Strengthening Process Improvement KPI Metrics Dashboard To Measure Automation Performance. Use it as a tool for discussion and navigation on Request Volume Vs Service Level, Customer Satisfaction, Cost Per Support, Customer Retention. This template is free to edit as deemed fit for your organization. Therefore download it now.
-
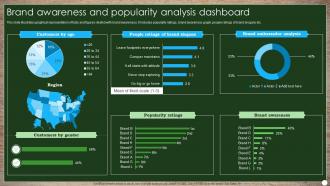 Brand Awareness And Popularity Analysis Dashboard
This slide illustrates graphical representation of facts and figures related with brand awareness. It includes popularity ratings, brand awareness graph, people ratings of brand slogans etc. Introducing our Brand Awareness And Popularity Analysis Dashboard set of slides. The topics discussed in these slides are Customers By Gender, Popularity Ratings, Brand Awareness. This is an immediately available PowerPoint presentation that can be conveniently customized. Download it and convince your audience.
-
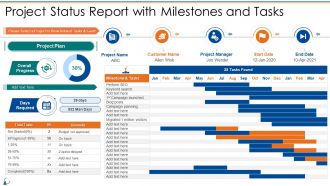 Project Status Report With Milestones And Tasks Communication Management Bundle
Deliver an outstanding presentation on the topic using this Project Status Report With Milestones And Tasks Communication Management Bundle. Dispense information and present a thorough explanation of Project Status Report With Milestones And Tasks using the slides given. This template can be altered and personalized to fit your needs. It is also available for immediate download. So grab it now.
-
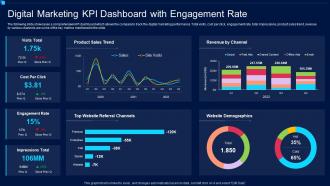 Digital Marketing KPI Dashboard Snapshot With Engagement Rate
The following slide showcases a comprehensive KPI dashboard which allows the company to track the digital marketing performance. Total visits, cost per click, engagement rate, total impressions, product sales trend, revenue by various channels are some of the key metrics mentioned in the slide. Introducing our Digital Marketing KPI Dashboard Snapshot With Engagement Rate set of slides. The topics discussed in these slides are Product Sales Trend, Revenue By Channel, Top Website Referral Channels, Website Demographics, Engagement Rate, Impressions Total. This is an immediately available PowerPoint presentation that can be conveniently customized. Download it and convince your audience.
-
 Financial Plan Powerpoint Presentation Slides
These slides are instantly downloadable. 100% editable templates. Our PowerPoint show consists of 40 slides. Originative high-resolution designs. Compatible presentation layout. Easily convertible to PDF and JPG formats. 100% risk-free designs. Our visuals can be used by promoters, marketers, sales, money manager, investment advisor, and business professionals.The stages in this process are financial statement, financial plan, forecast.
-
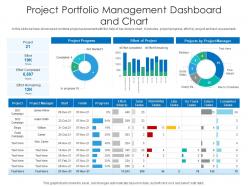 Project portfolio management dashboard and chart
In this slide we have showcased combine project assessment with the help of bar and pie chart, it includes- project progress, effort by project and task assessment. Introducing our Project Portfolio Management Dashboard And Chart set of slides. The topics discussed in these slides are Project Portfolio Management Dashboard And Chart. This is an immediately available PowerPoint presentation that can be conveniently customized. Download it and convince your audience.
-
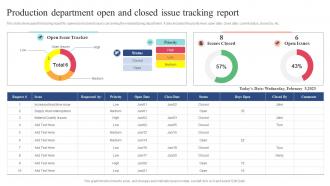 Production Department Open And Closed Issue Tracking Report
This slide showcases the tracking report for opened and closed issues concerning the manufacturing department. It also includes the priority level, open date, close date, current status, closed by, etc. Presenting our well structured Production Department Open And Closed Issue Tracking Report. The topics discussed in this slide are Production Department, Open Closed Issue, Tracking Report. This is an instantly available PowerPoint presentation that can be edited conveniently. Download it right away and captivate your audience.
-
 Financial statement analysis powerpoint presentation slides
This PowerPoint presentation contains 74 slides. PowerPoint templates are 100 percent editable. Presentation templates are accessible in both formats standard and widescreen. All slides provided in this product are compatible with Google Slides. This PPT is useful for the professional financial analyst to measure the value of a company and its stock or debt.
-
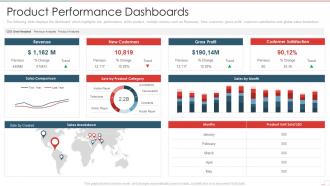 New product performance evaluation product performance dashboards
The following slide displays the dashboard which highlights the performance of the product, multiple metrics such as Revenues, New customer, gross profit, customer satisfaction and global sales breakdown Present the topic in a bit more detail with this New Product Performance Evaluation Product Performance Dashboards. Use it as a tool for discussion and navigation on Product Performance Dashboards. This template is free to edit as deemed fit for your organization. Therefore download it now.
-
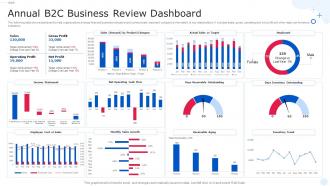 Annual B2C Business Review Dashboard Snapshot
The following slide shows dashboard to help organizations arrange financial business indicators and communicate important companys information to key stakeholders. It includes sales, gross, operating and net profit and other major performance indicators. Introducing our Annual B2C Business Review Dashboard Snapshot set of slides. The topics discussed in these slides are Monthly Sales Growth, Days Receivable Outstanding, Days Inventory Outstanding. This is an immediately available PowerPoint presentation that can be conveniently customized. Download it and convince your audience.
-
 Client financial and budget planning process powerpoint presentation slides
Pre made 53 presentation themes for planning process. Also suitable for budget planners or banking professionals. High resolution presentation diagrams. Apply any sort of editing to perfectly match your style. Presentation slide of business quote and thanks in end. Free from permanent water marks. Goes well with Google slides. Quickly downloadable. Can be easily converted into PDF or JPG formats.
-
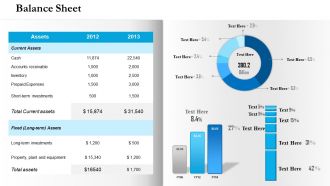 0314 presentation of financial statements
High-quality PowerPoint presentation backgrounds. Adaptable PPT slides as fully compatible with Google slides. Does not interfere with the speed and consistency of the system. Beneficial for industry professionals, managers, executives, researchers, etc. The presentation template can be downloaded and saved in any desired format. Privilege of insertion of logo and trademarks for more personalization. Runs effortlessly with all the software’s without generating any errors.
-
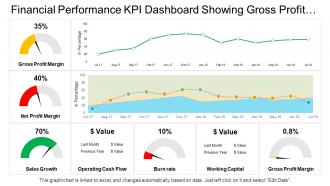 Financial performance kpi dashboard showing gross profit margin sales growth operating cash flow
Presenting this set of slides with name - Financial Performance Kpi Dashboard Showing Gross Profit Margin Sales Growth Operating Cash Flow. This is a three stage process. The stages in this process are Financial Performance, Financial Report, Financial Review.
-
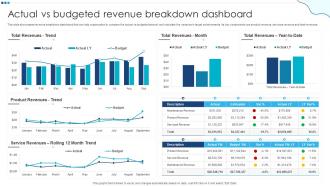 Actual Vs Budgeted Revenue Breakdown Dashboard
This style showcases revenue breakdown dashboard that can help organization to compare the actual vs budgeted amount and calculate the variance in target achievements. Its key components are product revenue, services revenue and total revenues Introducing our Actual Vs Budgeted Revenue Breakdown Dashboard set of slides. The topics discussed in these slides are Actual Vs Budgeted, Revenue Breakdown Dashboard. This is an immediately available PowerPoint presentation that can be conveniently customized. Download it and convince your audience.
-
 Predictive Analytics Impact On Marketing Campaign
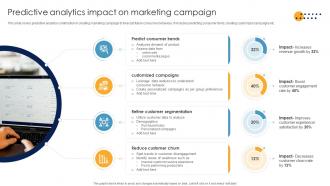
This slide covers predictive analytics contribution in creating marketing campaign to forecast future consumer behaviour. It includes predicting consumer trend, creating customized campaigns etc. Introducing our Predictive Analytics Impact On Marketing Campaign set of slides. The topics discussed in these slides are Predict Consumer Trends, Customized Campaigns, Refine Customer Segmentation. This is an immediately available PowerPoint presentation that can be conveniently customized. Download it and convince your audience.
-
 Freelance Recruitment Comparative Assessment Based On Industrial Sector
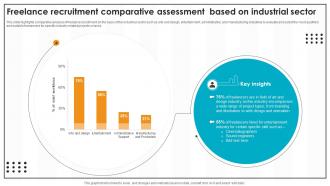
This slide highlights comparative analysis of freelance recruitment on the basis of the industrial sector such as arts and design, entertainment, administrative, and manufacturing industries to evaluate and select the most qualified and suitable freelancers for specific industry-related projects or tasks. Introducing our Freelance Recruitment Comparative Assessment Based On Industrial Sector set of slides. The topics discussed in these slides are Freelance Recruitment, Comparative Assessment, Industrial Sector. This is an immediately available PowerPoint presentation that can be conveniently customized. Download it and convince your audience.
-
 Financial analysis module powerpoint presentation slides
This PowerPoint presentation contains 62 slides. PowerPoint templates are 100 percent editable; you can customize these as per your requirements. PowerPoint product is available in both formats standard & widescreen. All slides provided in this product are compatible with Google Slides. This PPT is useful for stakeholders, equity investors and decision maker within the organization. We offer premium customer support.
-
 Agile HR Transformation KPI Dashboard Snapshot
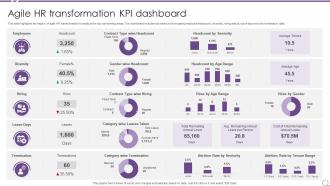
This slide highlights the impact of agile HR transformation to analyze the key performing areas. The dashboard includes key metrics showcasing employee headcount, diversity, hiring status, leave days and the termination data. Introducing our Agile HR Transformation KPI Dashboard Snapshot set of slides. The topics discussed in these slides are Attrition Rate, Contract Type Wise Hiring, Category Wise Termination. This is an immediately available PowerPoint presentation that can be conveniently customized. Download it and convince your audience.
-
 Financial Management Powerpoint Presentation Slides
Presenting Financial Management PowerPoint Presentation Slides. This complete deck contains 77 content ready templates. These PPT slides can be easy to customize. Users can edit the fonts, colors, and slide backdrop as per their need. Users can quickly download Presentation templates in both widescreen and standard screen. The presentation is fully supported with Google Slides. It can be easily converted into JPG or PDF format.
-
 Benefits Of Conducting Financial Statement Analysis For Improving Business Fin SS
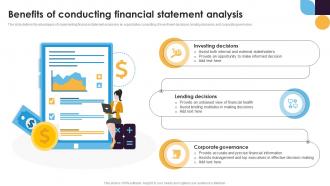
This slide defines the advantages of implementing financial statement analysis in an organization consisting of investment decisions, lending decisions, and corporate governance. Increase audience engagement and knowledge by dispensing information using Benefits Of Conducting Financial Statement Analysis For Improving Business Fin SS. This template helps you present information on three stages. You can also present information on Investing Decisions, Lending Decisions, Corporate Governance using this PPT design. This layout is completely editable so personaize it now to meet your audiences expectations.
-
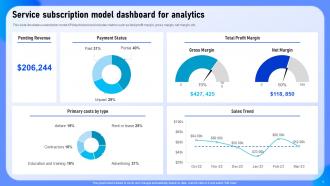 Service Subscription Model Dashboard For Analytics
This slide illustrates subscription model KPI or dashboard and includes metrics such as total profit margin, gross margin, net margin, etc. Introducing our Service Subscription Model Dashboard For Analytics set of slides. The topics discussed in these slides are Service Subscription Model, Dashboard For Analytics, Gross Margin, Net Margin. This is an immediately available PowerPoint presentation that can be conveniently customized. Download it and convince your audience.
-
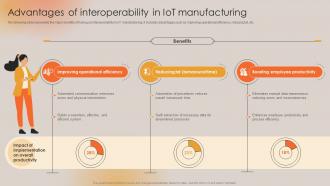 Advantages Of Interoperability In IoT Manufacturing Boosting Manufacturing Efficiency With IoT
The following slide represents the major benefits of having an interoperability in IoT manufacturing. It includes advantages such as improving operational efficiency, reducing tat, etc. Present the topic in a bit more detail with this Advantages Of Interoperability In IoT Manufacturing Boosting Manufacturing Efficiency With IoT. Use it as a tool for discussion and navigation on Operational Efficiency, Turnaround Time, Employee Productivity. This template is free to edit as deemed fit for your organization. Therefore download it now.
-
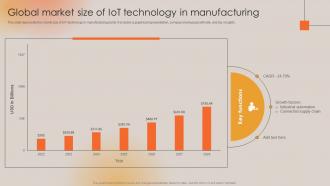 Global Market Size Of IoT Technology In Manufacturing Boosting Manufacturing Efficiency With IoT
This slide represents the market size of IoT technology in manufacturing plants. It includes a graphical representation, compound annual growth rate, and key insights. Deliver an outstanding presentation on the topic using this Global Market Size Of IoT Technology In Manufacturing Boosting Manufacturing Efficiency With IoT. Dispense information and present a thorough explanation of Growth Factors, Key Functions, Supply Chain using the slides given. This template can be altered and personalized to fit your needs. It is also available for immediate download. So grab it now.
-
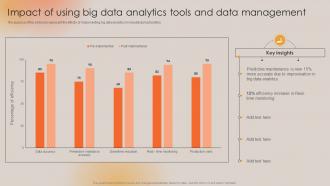 Impact Of Using Big Data Analytics Tools And Data Boosting Manufacturing Efficiency With IoT
The purpose of this slide is to represent the effects of implementing big data analytics in manufacturing facilities. Deliver an outstanding presentation on the topic using this Impact Of Using Big Data Analytics Tools And Data Boosting Manufacturing Efficiency With IoT. Dispense information and present a thorough explanation of Big Data Analytics, Time Monitoring, Key Insights using the slides given. This template can be altered and personalized to fit your needs. It is also available for immediate download. So grab it now.
-
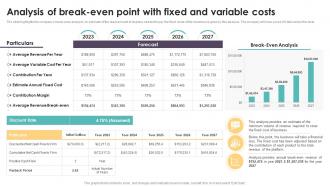 Analysis Of Break Even Point Coworking Space Business Plan BP SS
The slide highlights the companys break-even analysis. An estimate of the least amount of revenue needed to pay the fixed costs of the business is given by this analysis. The company will incur a loss if it falls below this level. Present the topic in a bit more detail with this Analysis Of Break Even Point Coworking Space Business Plan BP SS. Use it as a tool for discussion and navigation on Variable Cost, Fixed Cost, Contribution Margin. This template is free to edit as deemed fit for your organization. Therefore download it now.
-
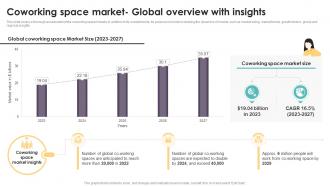 Coworking Space Market Global Coworking Space Business Plan BP SS
This slide covers a thorough assessment of the coworking space industry in addition to its market trends. Its purpose is to help in studying the dynamics of market, such as market sizing, market trends, growth factors, global and regional insights. Deliver an outstanding presentation on the topic using this Coworking Space Market Global Coworking Space Business Plan BP SS. Dispense information and present a thorough explanation of Global Coworking, Market Size, Coworking Space using the slides given. This template can be altered and personalized to fit your needs. It is also available for immediate download. So grab it now.
-
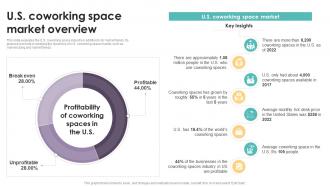 U S Coworking Space Market Overview Coworking Space Business Plan BP SS
This slide evaluates the U.S. coworking space industry in addition to its market trends. Its purpose is to help in studying the dynamics of U.S. coworking space market, such as market sizing and market trends. Deliver an outstanding presentation on the topic using this U S Coworking Space Market Overview Coworking Space Business Plan BP SS. Dispense information and present a thorough explanation of Coworking Spaces, Spaces Industry, United States using the slides given. This template can be altered and personalized to fit your needs. It is also available for immediate download. So grab it now.
-
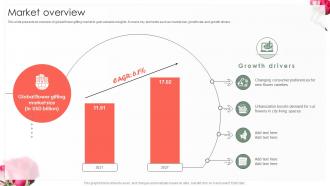 Market Overview Flower Delivery Retail Business Startup Go To Market Strategy GTM SS V
This slide presents an overview of global flower gifting market to gain valuable insights. It covers key elements such as market size, growth rate and growth drivers. Present the topic in a bit more detail with this Market Overview Flower Delivery Retail Business Startup Go To Market Strategy GTM SS V. Use it as a tool for discussion and navigation on Growth Drivers, Consumer Preferences, Global Flower Gifting Market Size. This template is free to edit as deemed fit for your organization. Therefore download it now.
-
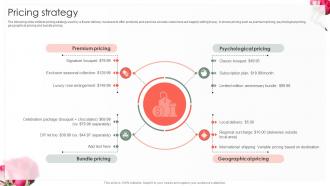 Pricing Strategy Flower Delivery Retail Business Startup Go To Market Strategy GTM SS V
The following slide outlines pricing strategy used by a flower delivery business to offer products and services at costs customers are happily willing to pay. It shows pricing such as premium pricing, psychological pricing, geographical pricing and bundle pricing. Introducing Pricing Strategy Flower Delivery Retail Business Startup Go To Market Strategy GTM SS V to increase your presentation threshold. Encompassed with four stages, this template is a great option to educate and entice your audience. Dispence information on Premium Pricing, Bundle Pricing, Psychological Pricing, Geographical Pricing, using this template. Grab it now to reap its full benefits.
-
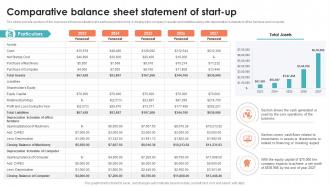 Comparative Balance Sheet Statement Recruitment Agency Business Plan BP SS
The slides provide a picture of the businesss financial situation at a particular point in time. It displays the companys assets and liabilities along with depreciation schedule of office furniture and computer. Present the topic in a bit more detail with this Comparative Balance Sheet Statement Recruitment Agency Business Plan BP SS. Use it as a tool for discussion and navigation on Cash Generated, Investing Aspect, Company Expects. This template is free to edit as deemed fit for your organization. Therefore download it now.
-
 Financial Ratio Analysis Powerpoint Presentation Slides
Presenting Financial Ratio Analysis PowerPoint Presentation Slides. Pictures do no blur out even when they are projected on large screen. PPT icons can be utilized by sales and marketing teams and business managers. Immediately downloadable slide and supports formats like JPEG and PDF. Fully adjusted with Google slides. Easy to add company logo, trademark or name. Modify colors, text and fonts as per your business requirements.
-
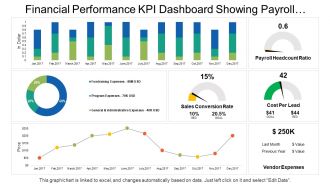 Financial performance kpi dashboard showing payroll headcount ratio cost per lead
Presenting this set of slides with name - Financial Performance Kpi Dashboard Showing Payroll Headcount Ratio Cost Per Lead. This is a seven stage process. The stages in this process are Financial Performance, Financial Report, Financial Review.
-
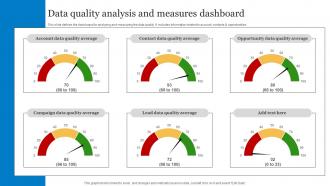 Data Quality Analysis And Measures Dashboard Snapshot
This slide defines the dashboard for analyzing and measuring the data quality. It includes information related to account, contacts and opportunities. Introducing our Data Quality Analysis And Measures Dashboard Snapshot set of slides. The topics discussed in these slides are Campaign Data, Quality Average, Opportunity Data. This is an immediately available PowerPoint presentation that can be conveniently customized. Download it and convince your audience.
-
 Financial technology icons
Presenting this set of slides with name - Financial Technology Icons. This is a twelve stage process. The stages in this process are Financial Technology, Fintech, Financial Services.
-
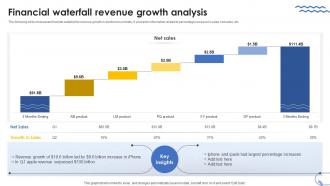 Financial Waterfall Revenue Growth Analysis
The following slide showcases financial waterfall for revenue growth in electronics industry. It presents information related to percentage increase in sales, net sales, etc. Introducing our Financial Waterfall Revenue Growth Analysis set of slides. The topics discussed in these slides are Financial Waterfall, Revenue, Growth Analysis. This is an immediately available PowerPoint presentation that can be conveniently customized. Download it and convince your audience.
-
 Portfolio Management Powerpoint Presentation Slides
Presenting this set of slides with name - Portfolio Management Powerpoint Presentation Slides. Our creatively crafted slides come with apt research and planning. This exclusive deck with seventy-three slides is here to help you to strategize, plan, analyze, or segment the topic with clear understanding and apprehension. Utilize ready to use presentation slides on Portfolio Management Powerpoint Presentation Slides with all sorts of editable templates, charts and graphs, overviews, analysis templates. Download PowerPoint templates in both widescreen and standard screen. The presentation is fully supported by Google Slides. It can be easily converted into JPG or PDF format.n.
-
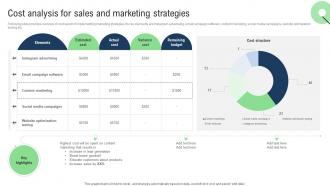 Cost Analysis For Sales And Sales Improvement Strategies For Ecommerce Website
Following slide provides overview of cost spent of implementing marketing strategies. Its key elements are Instagram advertising, email campaign software, content marketing, social media campaigns, website optimization testing etc. Deliver an outstanding presentation on the topic using this Cost Analysis For Sales And Sales Improvement Strategies For Ecommerce Website. Dispense information and present a thorough explanation of Lead Generation, Boost Brand, Increase Sales using the slides given. This template can be altered and personalized to fit your needs. It is also available for immediate download. So grab it now.
-
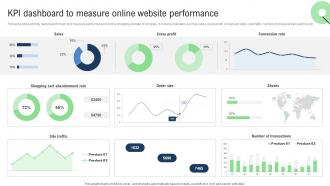 KPI Dashboard To Measure Online Sales Improvement Strategies For Ecommerce Website
Following slide exhibits dashboard to track and measure performance of online shopping website of company. It include indicators such as sales, gross profit, conversion rates, site traffic, number of shares and transactions etc. Present the topic in a bit more detail with this KPI Dashboard To Measure Online Sales Improvement Strategies For Ecommerce Website. Use it as a tool for discussion and navigation on Cross Profit, Conversion Rate, Order Size. This template is free to edit as deemed fit for your organization. Therefore download it now.
-
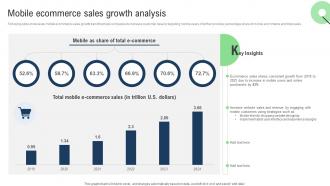 Mobile Ecommerce Sales Growth Sales Improvement Strategies For Ecommerce Website
Following slide showcases mobile ecommerce sales growth trend that help companies to increase customer base by targeting mobile users. It further provides percentage share of mobile ecommerce and total sales. Deliver an outstanding presentation on the topic using this Mobile Ecommerce Sales Growth Sales Improvement Strategies For Ecommerce Website. Dispense information and present a thorough explanation of Ecommerce Sales, Website Sales, Experience Designs using the slides given. This template can be altered and personalized to fit your needs. It is also available for immediate download. So grab it now.
-
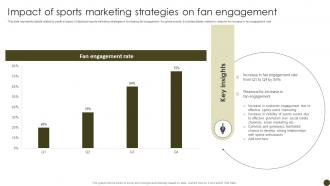 Impact Of Sports Marketing Tactics To Effectively Promote Sports Events Strategy SS V
This slide represents details related to positive impact of deployed sports marketing strategies in increasing fan engagement for sports events. It includes details related to reasons for increase in fan engagement rate. Present the topic in a bit more detail with this Impact Of Sports Marketing Tactics To Effectively Promote Sports Events Strategy SS V. Use it as a tool for discussion and navigation on Event Marketing, Strong Relationships, Giveaways Facilitated. This template is free to edit as deemed fit for your organization. Therefore download it now.
-
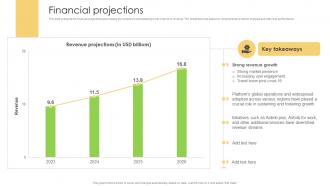 Financial Projections Bed And Breakfast Business Model BMC V
This slide presents the financial projections showcasing the companys anticipated growth in terms of revenue. The predictions are based on comprehensive market analysis and historical performance. Deliver an outstanding presentation on the topic using this Financial Projections Bed And Breakfast Business Model BMC V. Dispense information and present a thorough explanation of Financial Projections, Market Presence, Fostering Growth using the slides given. This template can be altered and personalized to fit your needs. It is also available for immediate download. So grab it now.
-
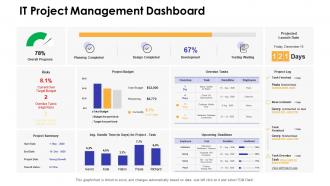 Dashboards by function it project management dashboard
Present the topic in a bit more detail with this Dashboards By Function It Project Management Dashboard. Use it as a tool for discussion and navigation on It Project Management Dashboard. This template is free to edit as deemed fit for your organization. Therefore download it now.
-
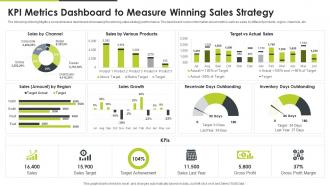 KPI Metrics Dashboard To Measure Winning Sales Strategy
The following slide highlights a comprehensive dashboard showcasing the winning sales strategy performance. The dashboard covers information about metrics such as sales by different products, region, channels, etc. Introducing our KPI Metrics Dashboard To Measure Winning Sales Strategy set of slides. The topics discussed in these slides are Sales Growth, Target Vs Actual Sales, Target Achievement. This is an immediately available PowerPoint presentation that can be conveniently customized. Download it and convince your audience.
-
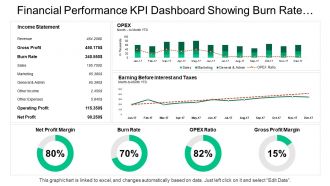 Financial performance kpi dashboard showing burn rate opex ratio gross profit
Presenting this set of slides with name - Financial Performance Kpi Dashboard Showing Burn Rate Opex Ratio Gross Profit. This is a four stage process. The stages in this process are Financial Performance, Financial Report, Financial Review.
-
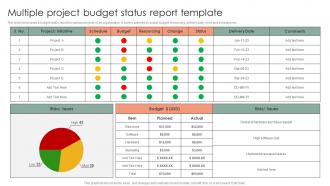 Multiple Project Budget Status Report Template
The Slide Showcases A Budget Status Report For Various Projects Of An Organization. It Covers Planned Vs Actual Budget, Resourcing, Delivery Date, Risks And Schedule Etc. Presenting Our Well Structured Multiple Project Budget Status Report Template. The Topics Discussed In This Slide Are Organization, Resourcing, Schedule. This Is An Instantly Available Powerpoint Presentation That Can Be Edited Conveniently. Download It Right Away And Captivate Your Audience.
-
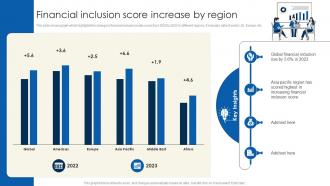 Financial Inclusion Score Financial Inclusion To Promote Economic Fin SS
This slide shows graph which highlights the change in financial inclusion index score from 2022 to 2023 in different regions. It includes data of world, US, Europe, etc. Deliver an outstanding presentation on the topic using this Financial Inclusion Score Financial Inclusion To Promote Economic Fin SS. Dispense information and present a thorough explanation of Global Financial Inclusion, Financial Inclusion Score, Key Insights using the slides given. This template can be altered and personalized to fit your needs. It is also available for immediate download. So grab it now.
-
 403 B Savings Plan For Retirement Strategic Retirement Planning To Build Secure Future Fin SS
This slide shows information which can be used by individuals to get basic understanding about 403 b retirement savings plan. It includes elements such as types, contributions and contributions limit. Introducing 403 B Savings Plan For Retirement Strategic Retirement Planning To Build Secure Future Fin SS to increase your presentation threshold. Encompassed with two stages, this template is a great option to educate and entice your audience. Dispence information on Traditional, Contributions, Contributions Limit, using this template. Grab it now to reap its full benefits.
-
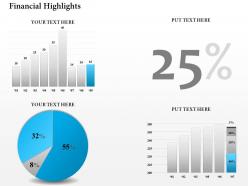 0314 comparison of financial data
Alter the PPT diagram by addition of business label. Swift download and easy to alter into JPEG and PDF document. PowerPoint diagram well-attuned with Google slides. Greater quality presentation design. Specific and easy to apprehend information. Choice to present design in standard and widescreen display view. Presentation slide can be accessed with different nodes and stages. Suitable for finance data management experts, financial reporting team, data analyst etc.
-
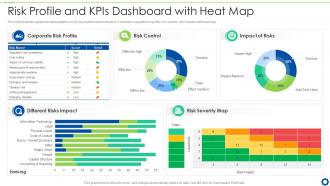 Risk Profile And KPIs Dashboard Snapshot With Heat Map
This slide illustrates graphical representation of risk key performance indicators. It includes corporate risk profile, risk control, risk impacts with heat map. Introducing our Risk Profile And KPIs Dashboard Snapshot With Heat Map set of slides. The topics discussed in these slides are Corporate Risk Profile, Risk Control, Impact of Risks, Different Risks Impact. This is an immediately available PowerPoint presentation that can be conveniently customized. Download it and convince your audience.
-
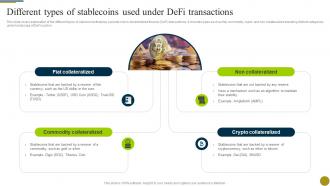 Different Types Of Stablecoins Used Under Defi Transactions Understanding Role Of Decentralized BCT SS
This slide covers exploration of the different types of stablecoins that play a pivotal role in decentralized finance DeFi transactions. It includes types such as fiat, commodity, crypto and non collateralized elevating distinct categories under landscape of DeFi system. Increase audience engagement and knowledge by dispensing information using Different Types Of Stablecoins Used Under Defi Transactions Understanding Role Of Decentralized BCT SS This template helps you present information on four stages. You can also present information on Fiat Collateralized, Commodity Collateralized, Crypto Collateralized using this PPT design. This layout is completely editable so personaize it now to meet your audiences expectations.
-
 Startup investor presentation ppt complete powerpoint deck with slides
Presenting Startup Investor Presentation Ppt PowerPoint Presentation Slides. Templates are editable in PowerPoint. Change the colors and fonts as per your startup’s branding. This presentation has 59 slides. Available in both widescreen (16:9 aspect ratio) and standard (4:3) aspect ratio. Downloads are risk-free. This presentation is useful for stakeholders, company investors etc. Graphics are compatible with Google slides. Customers have prime support. This ready-to-use PPT comprises visually stunning PowerPoint templates, icons, visual designs, data-driven charts and graphs and business diagrams. Download the presentation, enter your content in the placeholders and present with confidence!
-
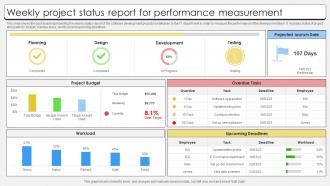 Weekly Project Status Report For Performance Measurement
This slide shows the dashboard representing the weekly status report of the software development projects undertaken by the IT department in order to measure the performance of the development team. It includes status of project along with its budget, overdue tasks, workload and upcoming deadlines. Introducing our Weekly Project Status Report For Performance Measurement set of slides. The topics discussed in these slides are Weekly Project, Status Report, For Performance, Measurement. This is an immediately available PowerPoint presentation that can be conveniently customized. Download it and convince your audience.
-
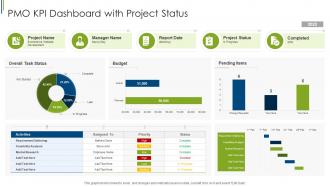 PMO KPI Dashboard Snapshot With Project Status
Introducing our PMO KPI Dashboard Snapshot With Project Status set of slides. The topics discussed in these slides are Budget, Analysis, Market Research. This is an immediately available PowerPoint presentation that can be conveniently customized. Download it and convince your audience.
-
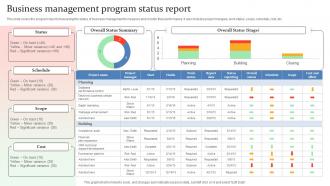 Business Management Program Status Report
This slide covers the program report showcasing the status of business management to measure and monitor their performance. It also includes project mangers, work status, scope, schedule, cost, etc. Presenting our well structured Business Management Program Status Report. The topics discussed in this slide are Overall Status Summary, Work Status.This is an instantly available PowerPoint presentation that can be edited conveniently. Download it right away and captivate your audience.
-
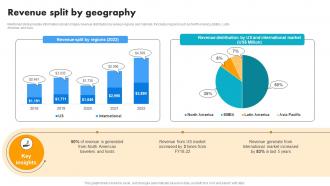 Revenue Split By Geography Vacation Rental Solution Company Profile CP SS V
Mentioned slide provides information about company revenue distribution by various regions and markets. It includes regions such as North America, EMEA, Latin America, and Asia. Deliver an outstanding presentation on the topic using this Revenue Split By Geography Vacation Rental Solution Company Profile CP SS V Dispense information and present a thorough explanation of North American Travelers And Hosts, Revenue From US Market using the slides given. This template can be altered and personalized to fit your needs. It is also available for immediate download. So grab it now.


