Pricing Strategies PowerPoint Templates, Presentation Slides & PPT Templates
- Sub Categories
-
- 30 60 90 Day Plan
- About Us Company Details
- Action Plan
- Agenda
- Annual Report
- Audit Reports
- Balance Scorecard
- Brand Equity
- Business Case Study
- Business Communication Skills
- Business Plan Development
- Business Problem Solving
- Business Review
- Capital Budgeting
- Career Planning
- Change Management
- Color Palettes
- Communication Process
- Company Location
- Company Vision
- Compare
- Competitive Analysis
- Corporate Governance
- Cost Reduction Strategies
- Custom Business Slides
- Customer Service
- Dashboard
- Data Management
- Decision Making
- Digital Marketing Strategy
- Digital Transformation
- Disaster Management
- Diversity
- Equity Investment
- Financial Analysis
- Financial Services
- Financials
- Growth Hacking Strategy
- Human Resource Management
- Innovation Management
- Interview Process
- Knowledge Management
- Leadership
- Lean Manufacturing
- Legal Law Order
- Management
- Market Segmentation
- Marketing
- Media and Communication
- Meeting Planner
- Mergers and Acquisitions
- Metaverse
- Newspapers
- Operations and Logistics
- Organizational Structure
- Our Goals
- Performance Management
- Pitch Decks
- Pricing Strategies
- Process Management
- Product Development
- Product Launch Ideas
- Product Portfolio
- Project Management
- Purchasing Process
- Quality Assurance
- Quotes and Testimonials
- Real Estate
- Risk Management
- Sales Performance Plan
- Sales Review
- SEO
- Service Offering
- Six Sigma
- Social Media and Network
- Software Development
- Solution Architecture
- Stock Portfolio
- Strategic Management
- Strategic Planning
- Supply Chain Management
- Swimlanes
- System Architecture
- Team Introduction
- Testing and Validation
- Thanks-FAQ
- Time Management
- Timelines Roadmaps
- Value Chain Analysis
- Value Stream Mapping
- Workplace Ethic
-
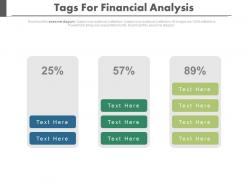 Three staged tags for financial analysis diagram powerpoint slides
Presenting three staged tags for financial analysis diagram powerpoint slides. This Power Point template diagram with graphic of three staged tags diagram. This PPT diagram contains the concept of financial analysis. Use this PPT diagram for business and finance related presentations.
-
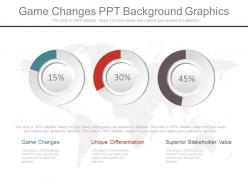 Game changes ppt background graphics
Presenting game changes ppt background graphics. This is a game changes ppt background graphics. This is a three stage process. The stages in this process are game changes, unique differentiation, superior stakeholder value.
-
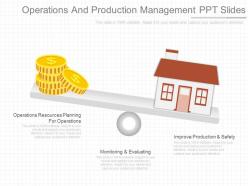 Operations and production management ppt slides
Presenting operations and production management ppt slides. This is a operations and production management ppt slides. This is a two stage process. The stages in this process are operations resources planning for operations, monitoring and evaluating, improve production and safety.
-
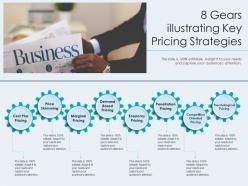 8 gears illustrating key pricing strategies
Presenting our set of slides with 8 Gears Illustrating Key Pricing Strategies. This exhibits information on eight stages of the process. This is an easy-to-edit and innovatively designed PowerPoint template. So download immediately and highlight information on Cost Plus Pricing, Price Skimming , Marginal Pricing, Demand Based Pricing, Economy Pricing.
-
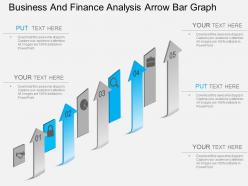 Ei business and finance analysis arrow bar graph powerpoint template
Utilization of cutting edge determination of pictures and the symbols in the slides. Permit altering of the size, style and introduction of the slide symbols. Inconvenience free inclusion of the organization's name or watermark. If guidelines to alter and change the slide symbol outline. Flexible with multiple format options like JPEG, JPG or PDF. Accessible an assortment of symbols to download and supplant in the slides. Valuable for the expert moderators and the business chiefs, financiers, businessmen, entrepreneurs, investors, and funding companies.
-
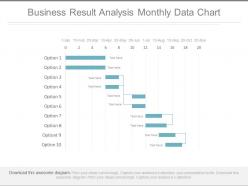 Business result analysis monthly data chart powerpoint slides
Presenting business result analysis monthly data chart powerpoint slides. This is a business result analysis monthly data chart powerpoint slides. This is a ten stage process. The stages in this process are financials.
-
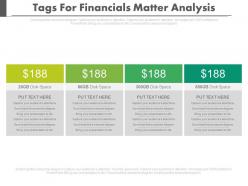 Four tags for financial matter analysis powerpoint slides
Presenting four tags for financial matter analysis powerpoint slides. This is a four tags for financial matter analysis powerpoint slides. This is a four stage process. The stages in this process are financials.
-
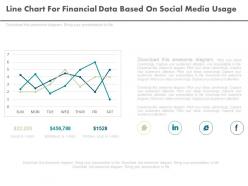 Line chart for financial data based on social media usage powerpoint slides
Presenting line chart for financial data based on social media usage powerpoint slides. This is a line chart for financial data based on social media usage powerpoint slides. This is a three stage process. The stages in this process are financials.
-
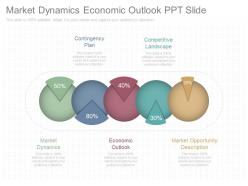 Market dynamics economic outlook ppt slide
Presenting market dynamics economic outlook ppt slide. This is a market dynamics economic outlook ppt slide. This is a five stage process. The stages in this process are contingency plan, competitive landscape, market opportunity description, economic outlook, market dynamics.
-
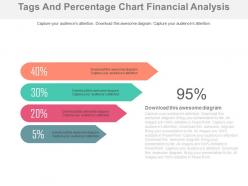 Four tags and percentage chart financial analysis powerpoint slides
Presenting four tags and percentage chart financial analysis powerpoint slides. This Power Point template diagram slide has been crafted with graphic of four tags and percentage chart diagram. This PPT diagram contains the concept of financial analysis. Use this PPT diagram for business and finance related presentations.
-
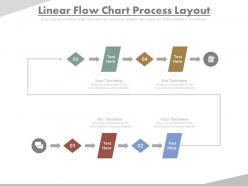 Linear flow chart process layout powerpoint slides
Presenting linear flow chart process layout powerpoint slides. This Power Point template diagram slide has been crafted with graphic of linear flow chart diagram. This PPT diagram contains the concept of business process layout representation. Use this PPT diagram for business and finance related presentations.
-
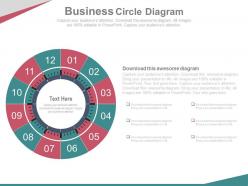 Twelve staged business circle diagram powerpoint slides
Presenting twelve staged business circle diagram powerpoint slides. This Power Point template diagram slide has been crafted with graphic of twelve staged circle diagram. This PPT diagram contains the concept of business process flow representation. Use this PPT diagram for business and finance related presentations.
-
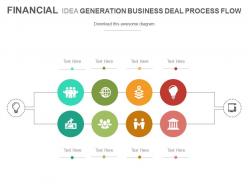 Financial idea generation business deal process flow powerpoint slides
Presenting financial idea generation business deal process flow powerpoint slides. This Power Point template slide has been crafted with graphic of finance info graphics. This PPT slide contains the concept of financial idea generation and business deal analysis. Use this PPT slide for business and finance related presentations.
-
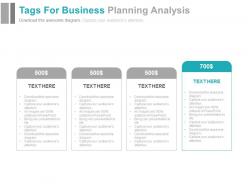 Four tags for business planning analysis powerpoint slides
Presenting four tags for business planning analysis powerpoint slides. This Power Point template slide has been crafted with graphic of four tags. This PPT slide contains the concept of business planning analysis. Use this PPT slide for business and finance related presentations.
-
 Saving piggy mobile dollars financial planning powerpoint slides
Presenting saving piggy mobile dollars financial planning powerpoint slides. This Power Point template slide has been crafted with graphic of piggy bank, dollars and mobile icons. This PPT slide contains the concept of financial planning. Use this PPT slide for business and finance related presentations.
-
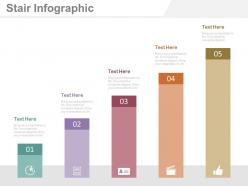 Five staged bar graph for financial management analysis powerpoint slides
Presenting five staged bar graph for financial management analysis powerpoint slides. This Power Point template diagram with graphic of five staged bar graph and icons. This PPT diagram contains the concept of financial management analysis. Use this PPT diagram for business and finance related presentations.
-
 Three social networks google plus viber and linkdin powerpoint slides
Presenting three social networks google plus viber and linkdin powerpoint slides. This Power Point template diagram with graphic of three social networks. This PPT diagram contains the concept of social networking for google,viber and LinkedIn. Use this PPT diagram for business and finance related presentations.
-
 Portfolio price analysis strategy ppt icons graphics
Presenting portfolio price analysis strategy ppt icons graphics. This Power Point template slide has been crafted with graphic of portfolio and finance icons. This PPT slide contains the concept of portfolio price strategy and analysis. Use this PPT slide for business and finance related presentations.
-
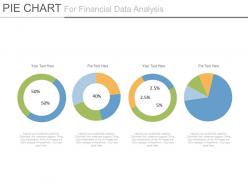 Four pie charts for financial data analysis powerpoint slides
Presenting four pie charts for financial data analysis powerpoint slides. This Power Point template diagram has been crafted with graphic of four pie charts diagram. This PPT diagram contains the concept of financial data analysis. Use this PPT diagram for business and finance related presentations.
-
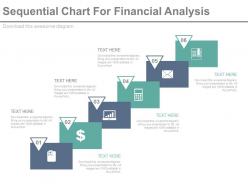 Six staged sequential chart for financial analysis powerpoint slides
Presenting six staged sequential chart for financial analysis powerpoint slides. This Power Point template diagram has been crafted with graphic of six staged sequential chart and percentage diagram. This PPT diagram contains the concept of financial analysis. Use this PPT diagram for business and finance related presentations.
-
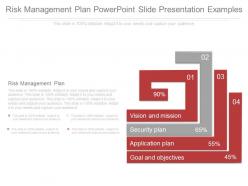 Risk management plan powerpoint slide presentation examples
Presenting risk management plan powerpoint slide presentation examples. This is a risk management plan powerpoint slide presentation examples. This is a four stage process. The stages in this process are vision and mission, security plan, application plan, goal and objectives.
-
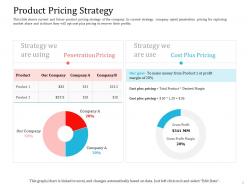 Product pricing strategy ppt powerpoint presentation icon slide
This slide shows current and future product pricing strategy of the company. In current strategy company opted penetration pricing for capturing market share and in future they will opt cost plus pricing to recover their profits. Presenting this set of slides with name Product Pricing Strategy Ppt Powerpoint Presentation Icon Slide. The topics discussed in these slides are Penetration Pricing, Cost Plus Pricing. This is a completely editable PowerPoint presentation and is available for immediate download. Download now and impress your audience.
-
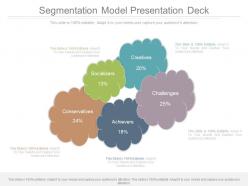 Segmentation model presentation deck
Presenting segmentation model presentation deck. This is a segmentation model presentation deck. This is a five stage process. The stages in this process are creatives, socializers, conservatives, challenges, achievers.
-
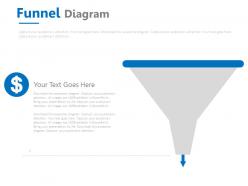 Funnel diagram with dollar symbol powerpoint slides
Presenting funnel diagram with dollar symbol powerpoint slides. This Power Point template slide has been crafted with graphic of funnel diagram and dollar symbol. This PPT slide contains the concept of financial analysis and process flow. Use this PPT slide for business and finance related presentations.
-
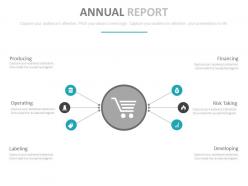 Annual report with financial analysis powerpoint slides
Presenting annual report with financial analysis powerpoint slides. This Power Point template diagram has been crafted with graphic of annual report diagram. This PPT diagram contains the concept of financial analysis. Use this PPT diagram for business and finance related presentations.
-
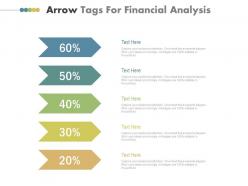 Five tags arrow tags for financial analysis powerpoint slides
Presenting five tags arrow tags for financial analysis powerpoint slides. This Power Point template diagram has been crafted with graphic of five arrow tags diagram. This PPT diagram contains the concept of financial analysis. Use this PPT diagram for business and finance related presentations.
-
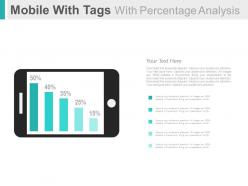 Mobile with tags with percentage analysis powerpoint slides
Presenting mobile with tags with percentage analysis powerpoint slides. This Power Point template diagram has been crafted with graphic of mobile with tags and percentage diagram. This PPT diagram contains the concept of banking solutions analysis. Use this PPT diagram for business and finance related presentations.
-
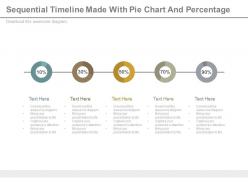 Sequential timeline made with pie chart and percentage powerpoint slides
Presenting sequential timeline made with pie chart and percentage powerpoint slides. This Power Point template slide has been crafted with graphic of sequential timeline and pie chart This PPT slide contains the concept of financial data analysis and planning. Use this PPT slide for business and finance related presentations.
-
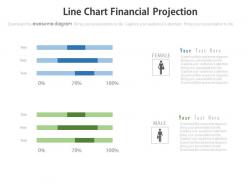 Two line charts financial projection powerpoint slides
Presenting two line charts financial projection powerpoint slides. This Power Point template slide has been crafted with graphic of two line chart. This PPT slide contains the concept of financial projection. Use this PPT slide for business and finance related presentations.
-
 Original save money for future sample layout powerpoint slide
Presenting original save money for future sample layout powerpoint slide. This is a save money for future sample layout powerpoint slide. This is a three stage process. The stages in this process are deposit.
-
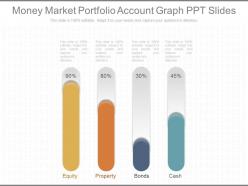 Different money market portfolio account graph ppt slides
Presenting different money market portfolio account graph ppt slides. This is a money market portfolio account graph ppt slides. This is a four stage process. The stages in this process are equity, property, bonds, cash.
-
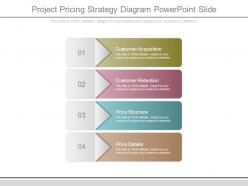 Project pricing strategy diagram powerpoint slide
Presenting project pricing strategy diagram powerpoint slide. This is a project pricing strategy diagram powerpoint slide. This is a four stage process. The stages in this process are customer acquisition, customer retention, price structure, price details.
-
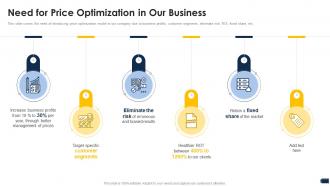 Companys pricing strategies need price optimization
This slide covers the need of introducing price optimization model in our company due to business profits, customer segments, eliminate risk, ROI, fixed share, etc. Increase audience engagement and knowledge by dispensing information using Companys Pricing Strategies Need Price Optimization. This template helps you present information on six stages. You can also present information on Eliminate, Business, Share using this PPT design. This layout is completely editable so personaize it now to meet your audiences expectations.
-
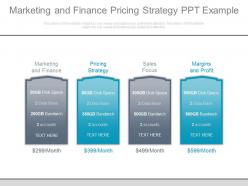 Marketing and finance pricing strategy ppt example
Scalable graphics and the icons. The icons attune well with the Google slides or Microsoft PowerPoint template. Access to edit the icons, colours or the style of the slides. No compromise with the icon quality when opened on a wide screen. Edit or use your brand’s name as a watermark. Allowed to save in the JPG or PDF format. A must have for the entrepreneurs, marketing professionals and the business presenters.The stages in this process are marketing and finance, pricing strategy, sales focus, margins and profit.
-
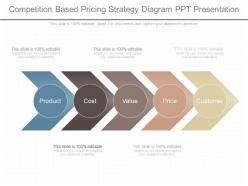 See competition based pricing strategy diagram ppt presentation
Presenting see competition based pricing strategy diagram ppt presentation. This is a competition based pricing strategy diagram ppt presentation. This is a five stage process. The stages in this process are product, cost, value, price, customer.
-
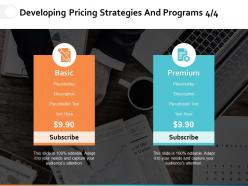 Developing pricing strategies and programs ppt powerpoint presentation file guidelines
Presenting this set of slides with name - Developing Pricing Strategies And Programs Ppt Powerpoint Presentation File Guidelines. This is a two stage process. The stages in this process are Business, Management, Marketing, Strategy, Planning.
-
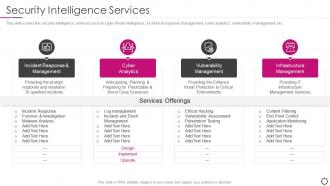 Security information and event management security intelligence services
This slide covers the security intelligence services such as cyber threat intelligence, incident and response management, cyber analytics, vulnerability management, etc. Introducing Security Information And Event Management Security Intelligence Services to increase your presentation threshold. Encompassed with four stages, this template is a great option to educate and entice your audience. Dispence information on Response, Management, Cyber, Analytics, using this template. Grab it now to reap its full benefits.
-
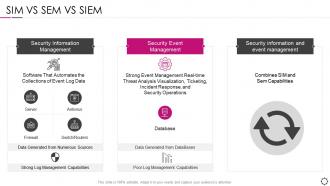 Security information and event management sim vs sem vs siem
Increase audience engagement and knowledge by dispensing information using Security Information And Event Management SIM Vs SEM Vs SIEM. This template helps you present information on three stages. You can also present information on Information, Management, Security using this PPT design. This layout is completely editable so personaize it now to meet your audiences expectations.
-
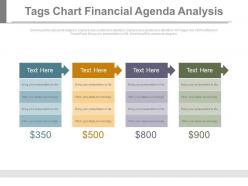 Four tags chart for financial agenda analysis powerpoint slides
Presenting four tags chart for financial agenda analysis powerpoint slides. This Power Point template slide has been crafted with graphic of four tags chart. This PPT slide contains the concept of financial agenda analysis. Use this PPT slide for business and finance related presentations.
-
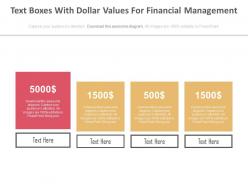 Four text boxes with dollar values for financial management powerpoint slides
Presenting four text boxes with dollar values for financial management powerpoint slides. This Power Point template slide has been crafted with graphic of four text boxes and dollar diagram. This PPT slide contains the concept of financial management. Use this PPT slide for business and finance related presentations.
-
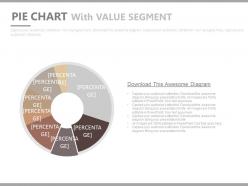 Pie chart with seven staged value segment powerpoint slides
Presenting pie chart with seven staged value segment powerpoint slides. This is a pie chart with seven staged value segment powerpoint slides. This is a one stage process. The stages in this process are financials.
-
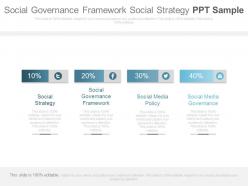 Social governance framework social strategy ppt sample
Presenting social governance framework social strategy ppt sample. This is a social governance framework social strategy ppt sample. This is a four stage process. The stages in this process are strategy, finance, marketing, business.
-
 Four colored arrows in envelop for communication strategy powerpoint slides
Presenting four colored arrows in envelop for communication strategy powerpoint slides. This Power Point template slide has been crafted with graphic of four colored arrows in envelop. This PPT slide contains the concept of business communication strategy. Use this PPT slide for business and finance related presentations.
-
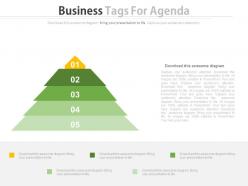 Five staged business tags for agenda powerpoint slides
Presenting five staged business tags for agenda powerpoint slides. This Power Point template diagram has been crafted with graphic of five staged business tags diagram. This PPT diagram contains the concept of business agenda analysis. Use this PPT diagram for business and finance related presentations.
-
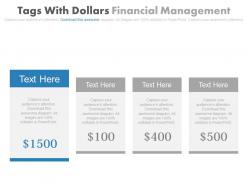 Four staged tags with dollars financial management powerpoint slides
Presenting four staged tags with dollars financial management powerpoint slides. This Power Point template diagram has been crafted with graphic of four staged tags and dollar diagram. This PPT diagram contains the concept of financial management representation. Use this PPT diagram for business and finance related presentations.
-
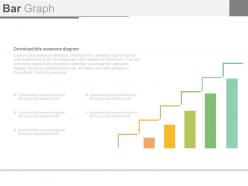 Colored bar graph for growth of business powerpoint slides
Presenting colored bar graph for growth of business powerpoint slides. This Power Point template diagram slide has been crafted with graphic of colored bar graph diagram. This PPT diagram contains the concept of business growth representation. Use this PPT diagram for business and finance related presentations.
-
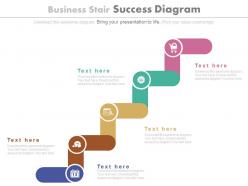 Five staged business stair success diagram powerpoint slides
Presenting five staged business stair success diagram powerpoint slides. This Power Point template diagram slide has been crafted with graphic of five staged business stair diagram. This PPT diagram contains the concept of business success representation. Use this PPT diagram for business and marketing related presentations.
-
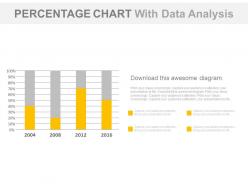 Percentage chart with data analysis powerpoint slides
Presenting percentage chart with data analysis powerpoint slides. This Power Point template slide has been crafted with graphic of percentage chart. This PPT slide contains the concept of data analysis. Use this PPT slide for business and finance related presentations.
-
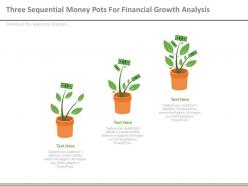 Three sequential money pots for financial growth analysis powerpoint slides
Presenting three sequential money pots for financial growth analysis powerpoint slides. This Power Point template slide has been crafted with graphic of three sequential money pots. This PPT slide contains the concept of financial growth analysis. Use this PPT slide for business and finance related presentations.
-
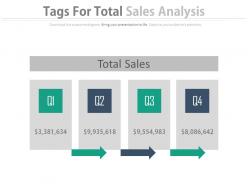 Four tags for total sales analysis powerpoint slides
Presenting four tags for total sales analysis powerpoint slides. This Power Point template diagram with graphic of four tags and icons. This PPT diagram contains the concept of total sales analysis. Use this PPT diagram for business and finance related presentations.
-
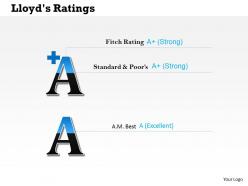 0414 financial result ratings diagram
We are proud to present our 0414 financial result ratings diagram. Our financial result ratings diagram Powerpoint Templates will provide weight to your words. They will bring out the depth of your thought process. Words like arrows fly straight and true. Use our financial result ratings diagram Powerpoint Templates to make them hit bullseye everytime.
-
 Bar graph with percentage values and team powerpoint slides
Presenting bar graph with percentage values and team powerpoint slides. This is a bar graph with percentage values and team powerpoint slides. This is a six stage process. The stages in this process are financials.
-
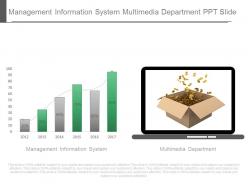 Management information system multimedia department ppt slide
Presenting management information system multimedia department ppt slide. This is a management information system multimedia department ppt slide. This is a two stage process. The stages in this process are management, finance, technology.
-
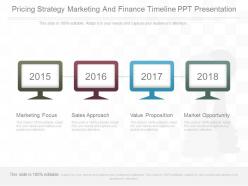 Pricing strategy marketing and finance timeline ppt presentation
High quality resolution PowerPoint designs. Presentations slides are well-matched with Google slides. PPT diagram can be displayed in standard and widescreen view. Entirely amendable PowerPoint slides as can be edited easily. Instant download and sharing. Option to convert the slide into JPG and PDF format. Useful for marketing and finance industry.The stages in this process are marketing focus, sales approach, value proposition, market opportunity.
-
 Cost estimate in project management
Presenting this set of slides with name - Cost Estimate In Project Management. This is a three stage process. The stages in this process are Cost Estimate, Price Estimate, Value Estimate.
-
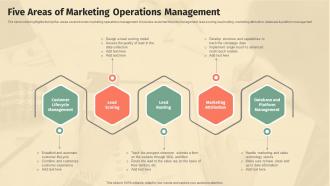 Five Areas Of Marketing Operations Management
The below slide highlights the top five areas covered under marketing operations management. It includes customer lifecycle management, lead scoring, lead routing, marketing attribution, database and platform management. Introducing our premium set of slides with Five Areas Of Marketing Operations Management. Ellicudate the five stages and present information using this PPT slide. This is a completely adaptable PowerPoint template design that can be used to interpret topics like Customer Lifecycle Management, Lead Scoring, Lead Routing, Marketing Attribution. So download instantly and tailor it with your information.
-
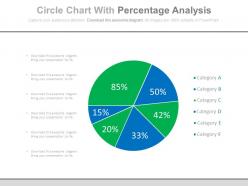 Circle chart with percentage analysis powerpoint slides
Presenting circle chart with percentage analysis powerpoint slides. This Power Point template diagram has been crafted with graphic of business template with circle chart and percentage diagram. This PPT diagram contains the concept of financial data analysis. Use this PPT diagram for business and finance related presentations.
-
 Four boxes with icons for social communication powerpoint slides
Presenting four boxes with icons for social communication powerpoint slides. This Power Point template diagram slide has been crafted with graphic of four boxes and icons diagram. This PPT diagram contains the concept of social communication representation. Use this PPT diagram for business and marketing related presentations.
-
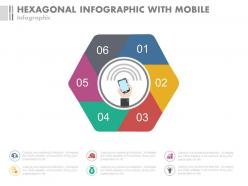 Six staged hexagonal infographics with mobile communication powerpoint slides
Presenting six staged hexagonal infographics with mobile communication powerpoint slides. This Power Point template diagram slide has been crafted with graphic of six staged hexagonal info graphics diagram. This PPT diagram contains the concept of mobile communication. Use this PPT diagram for business and finance related presentations.
-
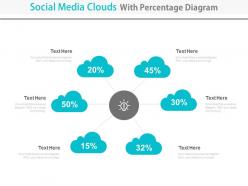 Social media clouds with percentage diagram powerpoint slides
Presenting social media clouds with percentage diagram powerpoint slides. This Power Point template diagram slide has been crafted with graphic of social media cloud and percentage diagram. This PPT diagram contains the concept of cloud computing representation. Use this PPT diagram for business and technology related presentations.


