Pricing Strategies PowerPoint Templates, Presentation Slides & PPT Templates
- Sub Categories
-
- 30 60 90 Day Plan
- About Us Company Details
- Action Plan
- Agenda
- Annual Report
- Audit Reports
- Balance Scorecard
- Brand Equity
- Business Case Study
- Business Communication Skills
- Business Plan Development
- Business Problem Solving
- Business Review
- Capital Budgeting
- Career Planning
- Change Management
- Color Palettes
- Communication Process
- Company Location
- Company Vision
- Compare
- Competitive Analysis
- Corporate Governance
- Cost Reduction Strategies
- Custom Business Slides
- Customer Service
- Dashboard
- Data Management
- Decision Making
- Digital Marketing Strategy
- Digital Transformation
- Disaster Management
- Diversity
- Equity Investment
- Financial Analysis
- Financial Services
- Financials
- Growth Hacking Strategy
- Human Resource Management
- Innovation Management
- Interview Process
- Knowledge Management
- Leadership
- Lean Manufacturing
- Legal Law Order
- Management
- Market Segmentation
- Marketing
- Media and Communication
- Meeting Planner
- Mergers and Acquisitions
- Metaverse
- Newspapers
- Operations and Logistics
- Organizational Structure
- Our Goals
- Performance Management
- Pitch Decks
- Pricing Strategies
- Process Management
- Product Development
- Product Launch Ideas
- Product Portfolio
- Project Management
- Purchasing Process
- Quality Assurance
- Quotes and Testimonials
- Real Estate
- Risk Management
- Sales Performance Plan
- Sales Review
- SEO
- Service Offering
- Six Sigma
- Social Media and Network
- Software Development
- Solution Architecture
- Stock Portfolio
- Strategic Management
- Strategic Planning
- Supply Chain Management
- Swimlanes
- System Architecture
- Team Introduction
- Testing and Validation
- Thanks-FAQ
- Time Management
- Timelines Roadmaps
- Value Chain Analysis
- Value Stream Mapping
- Workplace Ethic
-
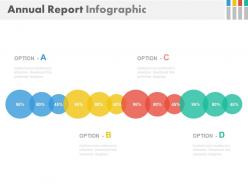 Linear chart for annual report infographics powerpoint slides
Presenting linear chart for annual report infographics powerpoint slides. This Power Point template diagram slide has been crafted with graphic of linear chart. This PPT diagram slide contains the concept of annual report representation. Use this PPT slide for finance and business related presentations.
-
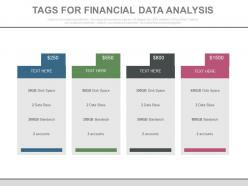 Four tags for financial data analysis powerpoint slides
Presenting four tags for financial data analysis powerpoint slides. This Power Point template slide has been crafted with graphic of four tags. This PPT slide contains the concept of financial data analysis. Use this PPT slide for business and finance related presentations.
-
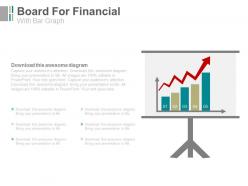 Board for financial analysis with bar graph powerpoint slides
Presenting board for financial analysis with bar graph powerpoint slides. This Power Point template slide has been crafted with graphic of bar graph and board. This PPT slide contains the concept of financial analysis. Use this PPT slide for business and finance related presentations.
-
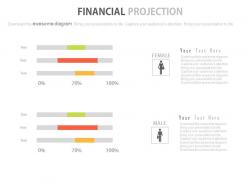 Financial projection line charts powerpoint slides
Presenting financial projection line charts powerpoint slides. This Power Point template slide has been crafted with graphic of projection line chart and icons. This PPT slide contains the concept of financial projection for future and analysis. Use this PPT slide for business and finance related presentations.
-
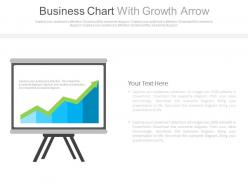 Business chart with growth arrow for finance powerpoint slides
Presenting business chart with growth arrow for finance powerpoint slides. This Power Point template slide has been crafted with graphic of business chart and growth arrow. This PPT slide contains the concept of financial data analysis and growth representation. Use this PPT slide for business and finance related presentations.
-
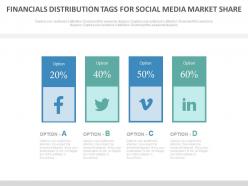 Financial distribution tags for social media market share powerpoint slides
Presenting financial distribution tags for social media market share powerpoint slides. This Power Point template slide has been crafted with graphic of tags . This PPT slide contains the concept of financial distribution for social media market share. Use this PPT slide for business and finance related presentations.
-
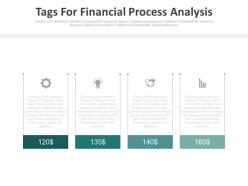 Four tags for financial process analysis powerpoint slides
Presenting four tags for financial process analysis powerpoint slides. This Power Point template slide has been crafted with graphic of four tags. This PPT slide contains the concept of financial process flow analysis. Use this PPT slide for business and finance related presentations.
-
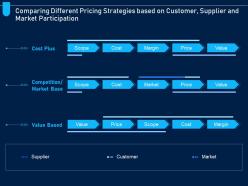 Comparing different pricing strategies based customer analyzing price optimization company ppt grid
Present the topic in a bit more detail with this Comparing Different Pricing Strategies Based Customer Analyzing Price Optimization Company Ppt Grid. Use it as a tool for discussion and navigation on Comparing Different Pricing Strategies Based On Customer, Supplier And Market Participation. This template is free to edit as deemed fit for your organization. Therefore download it now.
-
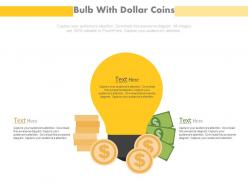 Bulb with dollar coins and notes financial investment powerpoint slides
Presenting bulb with dollar coins and notes financial investment powerpoint slides. This Power Point template slide has been crafted with graphic of bulb and dollar coins. This PPT slide contains the concept of financial investment. Use this PPT slide for business and finance related presentations.
-
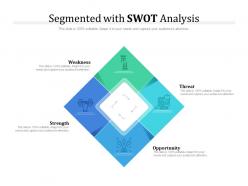 Segmented with swot analysis
Presenting this set of slides with name Segmented With SWOT Analysis. This is a four stage process. The stages in this process are Weakness, Strength, Threat, Opportunity. This is a completely editable PowerPoint presentation and is available for immediate download. Download now and impress your audience.
-
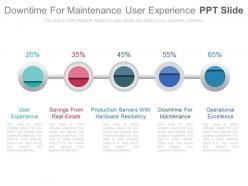 Downtime for maintenance user experience ppt slide
Presenting downtime for maintenance user experience ppt slide. This is a downtime for maintenance user experience ppt slide. This is a five stage process. The stages in this process are management, finance.
-
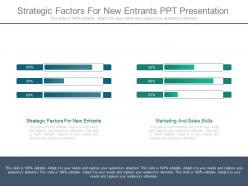 Strategic factors for new entrants ppt presentation
Presenting strategic factors for new entrants ppt presentation. This is a strategic factors for new entrants ppt presentation. This is a two stage process. The stages in this process are strategic factors for new entrants, marketing and sales skills.
-
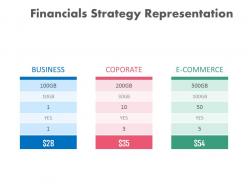 Three tags for financial strategy representation powerpoint slides
Presenting three tags for financial strategy representation powerpoint slides. This Power Point template diagram slide has been crafted with graphic of three tags diagram. This PPT diagram slide contains the concept of financial strategy representation. Use this PPT slide for finance and business related presentations.
-
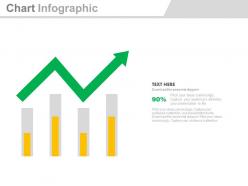 Bar graph with growth arrow for analysis powerpoint slides
Presenting bar graph with growth arrow for analysis powerpoint slides. This Power Point template slide has been crafted with graphic of bar graph and arrow. This PPT slide contains the concept of business growth analysis. Use this PPT slide for business and marketing related presentations.
-
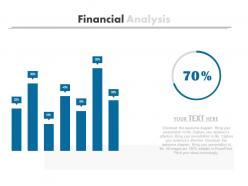 Percentage cycle with bar graph for financial analysis powerpoint slides
Presenting percentage cycle with bar graph for financial analysis powerpoint slides. This Power Point template slide has been crafted with graphic of percentage cycle and bar graph. This PPT slide contains the concept of financial analysis. Use this PPT slide for business and finance related presentations.
-
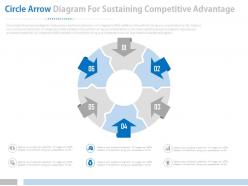 Six staged circle arrow diagram for sustaining competitive advantage powerpoint slides
Presenting six staged circle arrow diagram for sustaining competitive advantage powerpoint slides. This Power Point template slide has been crafted with graphic of six staged circle arrow diagram. This PPT slide contains the concept of sustaining competitive advantage. Use this PPT slide for business and finance related presentations.
-
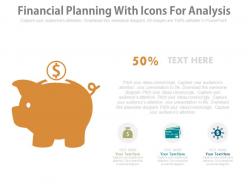 Financial planning with icons for analysis powerpoint slides
Presenting financial planning with icons for analysis powerpoint slides. This Power Point template diagram with graphic of finance icons. This PPT diagram contains the concept of financial planning and analysis. Use this PPT diagram for business and finance related presentations.
-
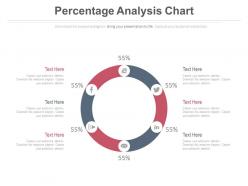 Six staged percentage analysis chart powerpoint slides
Presenting six staged percentage analysis chart powerpoint slides. This Power Point template diagram with graphic of six staged percentage chart. This PPT diagram contains the concept of financial analysis. Use this PPT diagram for business and finance related presentations.
-
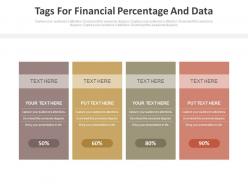 Four tags for financial percentage and data powerpoint slides
Presenting four tags for financial percentage and data powerpoint slides. This Power Point template slide has been crafted with graphic of four tags. This PPT slide contains the concept of financial data and percentage analysis. Use this PPT slide for business and finance related presentations.
-
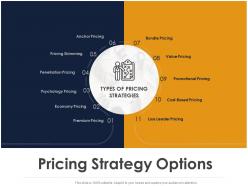 Pricing strategy options ppt powerpoint presentation model design inspiration
Presenting this set of slides with name Pricing Strategy Options Ppt Powerpoint Presentation Model Design Inspiration. This is a eleven stage process. The stages in this process are Anchor Pricing, Pricing Skimming, Penetration Pricing, Psychology Pricing, Economy Pricing. This is a completely editable PowerPoint presentation and is available for immediate download. Download now and impress your audience.
-
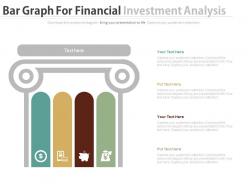 Four staged bar graph for financial investment analysis powerpoint slides
Presenting four staged bar graph for financial investment analysis powerpoint slides. This Power Point template diagram has been crafted with graphic of four staged bar graph diagram. This PPT diagram contains the concept of financial investment analysis. Use this PPT diagram for business and finance related presentations.
-
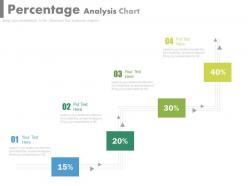 Four staged percentage analysis chart powerpoint slides
Presenting four staged percentage analysis chart powerpoint slides. This Power Point template diagram has been crafted with graphic of four staged percentage chart diagram. This PPT diagram contains the concept of business data analysis representation. Use this PPT diagram for business and finance related presentations.
-
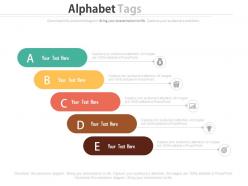 Alphabet tags for financial management analysis powerpoint slides
Presenting alphabet tags for financial management analysis powerpoint slides. This Power Point template diagram slide has been crafted with graphic of alphabet tags. This PPT diagram contains the concept of financial management analysis. Use this PPT diagram for business and finance related presentations.
-
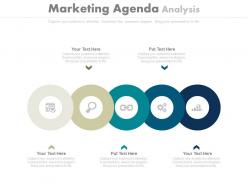 Five staged marketing agenda analysis diagram powerpoint slides
Presenting five staged marketing agenda analysis diagram powerpoint slides. This Power Point template diagram slide has been crafted with graphic of five staged agenda diagram. This PPT diagram contains the concept of marketing agenda analysis representation. Use this PPT diagram for business and marketing related presentations.
-
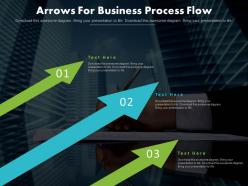 Three arrows for business process flow diagram powerpoint slides
Presenting three arrows for business process flow diagram powerpoint slides. This Power Point template diagram slide has been crafted with graphic of three arrows diagram. This PPT diagram contains the concept of business process flow representation. Use this PPT diagram for business and finance related presentations.
-
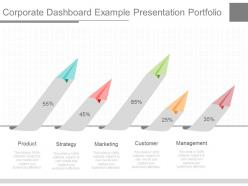 Pptx corporate dashboard example presentation portfolio
Presenting pptx corporate dashboard example presentation portfolio. This is a corporate dashboard example presentation portfolio. This is a five stage process. The stages in this process are product, strategy, marketing, customer, management.
-
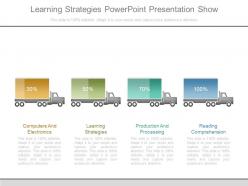 Learning strategies powerpoint presentation show
Presenting learning strategies powerpoint presentation show. This is a learning strategies powerpoint presentation show. This is a four stage process. The stages in this process are computers and electronics, learning strategies, production and processing, reading comprehension.
-
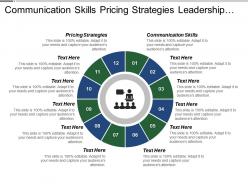 Communication skills pricing strategies leadership management analysis market
Presenting this set of slides with name - Communication Skills Pricing Strategies Leadership Management Analysis Market. This is an editable twelve stages graphic that deals with topics like Communication Skills, Pricing Strategies, Leadership Management, Analysis Market to help convey your message better graphically. This product is a premium product available for immediate download, and is 100 percent editable in Powerpoint. Download this now and use it in your presentations to impress your audience.
-
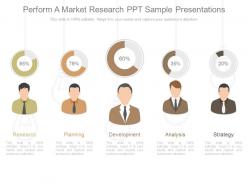 Download perform a market research ppt sample presentations
Presenting download perform a market research ppt sample presentations. This is a perform a market research ppt sample presentations. This is a five stage process. The stages in this process are research, planning, development, analysis, strategy.
-
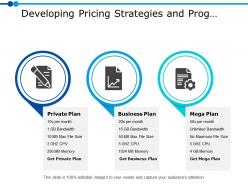 Developing pricing strategies and programs 3 4 ppt powerpoint presentation gallery infographics
Presenting this set of slides with name - Developing Pricing Strategies And Programs 3 4 Ppt Powerpoint Presentation Gallery Infographics. This is a three stage process. The stages in this process are Business, Management, Strategy, Analysis, Icons.
-
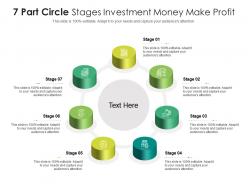 7 part circle stages investment money make profit infographic template
This is our 7 Part Circle Stages Investment Money Make Profit Infographic Template designed in PowerPoint, however, you can also access it in Google Slides. It comes in two aspect ratios standard and widescreen, with fully editable visual content.
-
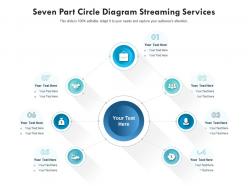 Seven part circle diagram streaming services infographic template
This is our Seven Part Circle Diagram Streaming Services Infographic Template designed in PowerPoint, however, you can also access it in Google Slides. It comes in two aspect ratios standard and widescreen, with fully editable visual content.
-
 Three tags for financial value analysis powerpoint slides
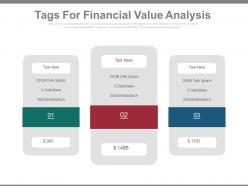
Presenting three tags for financial value analysis powerpoint slides. This Power Point template slide has been crafted with graphic of three tags. This PPT slide contains the concept of financial value analysis. Use this PPT slide for business and finance related presentations.
-
 Functional strategies operating strategies ppt sample
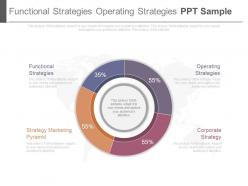
Presenting functional strategies operating strategies ppt sample. This is a functional strategies operating strategies ppt sample. This is a four stage process. The stages in this process are geographical, finance.
-
 Pricing And Revenue Optimization Comparing Different Pricing Strategies Based Customer
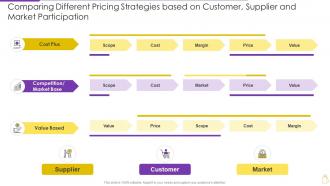
Present the topic in a bit more detail with this Pricing And Revenue Optimization Comparing Different Pricing Strategies Based Customer. Use it as a tool for discussion and navigation on Competition, Customer, Supplier. This template is free to edit as deemed fit for your organization. Therefore download it now.
-
 Product Pricing Strategies In B2b And B2c Businesses Optimize Promotion Pricing
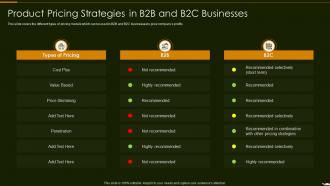
This slide covers the different types of pricing models which can be used in B2B and B2C businesses to grow companys profits Introducing Product Pricing Strategies In B2b And B2c Businesses Optimize Promotion Pricing to increase your presentation threshold. Encompassed with three stages, this template is a great option to educate and entice your audience. Dispence information on Product Pricing Strategies In B2B And B2C Businesses, using this template. Grab it now to reap its full benefits.
-
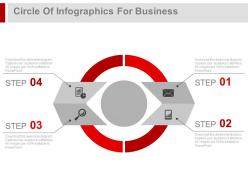 Circle of infographics for business and marketing powerpoint slides
Presenting circle of infographics for business and marketing powerpoint slides. This Power Point template slide has been crafted with graphic of circle info graphics .This PPT slide contains the concept of business and marketing strategy. Use this PPT slide for business and finance related presentations.
-
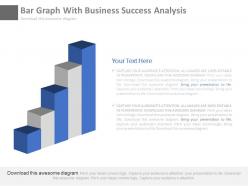 Bar graph with business success analysis powerpoint slides
Presenting bar graph with business success analysis powerpoint slides. This Power Point template diagram has been crafted with graphic of bar graph diagram. This PPT diagram contains the concept of business success analysis. Use this PPT diagram for business and finance related presentations.
-
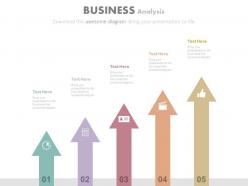 Five vertical arrows with icons for business analysis powerpoint slides
Presenting five vertical arrows with icons for business analysis powerpoint slides. This Power Point template diagram has been crafted with graphic of five vertical arrow and icons diagram. This PPT diagram contains the concept of business analysis. Use this PPT diagram for business and finance related presentations.
-
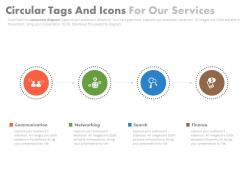 Four staged circular tags and icons for our services powerpoint slides
Presenting four staged circular tags and icons for our services powerpoint slides. This Power Point template diagram has been crafted with graphic of four staged circular tags and icons diagram. This PPT diagram contains the concept of business services representation. Use this PPT diagram for business and finance related presentations.
-
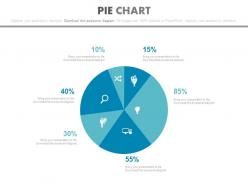 Pie chart with financial value calculation powerpoint slides
Presenting pie chart with financial value calculation powerpoint slides. This Power Point template diagram has been crafted with graphic of pie chart diagram. This PPT diagram contains the concept of financial value calculation representation. Use this PPT diagram for business and finance related presentations.
-
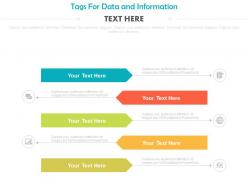 Five colored tags for data and information powerpoint slides
Presenting five colored tags for data and information powerpoint slides. This Power Point template diagram slide has been crafted with graphic of five colored tags and icons diagram. This PPT diagram contains the concept of data and information representation. Use this PPT diagram for business and data related presentations.
-
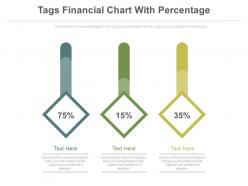 Three tags financial chart with percentage powerpoint slides
Presenting three tags financial chart with percentage powerpoint slides. This Power Point template diagram slide has been crafted with graphic of three tags and chart diagram. This PPT diagram contains the concept of financial data analysis representation. Use this PPT diagram for business and finance related presentations.
-
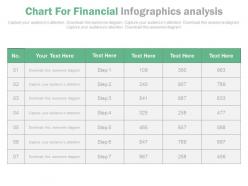 Chart for financial infographics analysis powerpoint slides
Presenting chart for financial infographics analysis powerpoint slides. This Power Point template slide has been crafted with graphic of chart and icons. This PPT slide contains the concept of financial analysis. Use this PPT slide for business and finance related presentations.
-
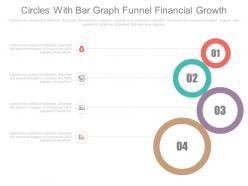 Four circles bar graph financial growth analysis powerpoint slides
Presenting four circles bar graph financial growth analysis powerpoint slides. This Power Point template diagram with graphic of four circles and bar graph. This PPT diagram contains the concept of financial growth analysis. Use this PPT diagram for business and finance related presentations.
-
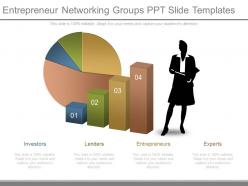 Entrepreneur networking groups ppt slide templates
Presenting entrepreneur networking groups ppt slide templates. This is a entrepreneur networking groups ppt slide templates. This is a four stage process. The stages in this process are investors, lenders, entrepreneurs, experts.
-
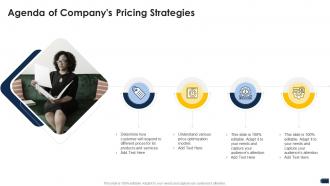 Agenda of companys pricing strategies ppt outline
Introducing Agenda Of Companys Pricing Strategies Ppt Outline to increase your presentation threshold. Encompassed with four stages, this template is a great option to educate and entice your audience. Dispence information on Customer, Determine, Optimization, using this template. Grab it now to reap its full benefits.
-
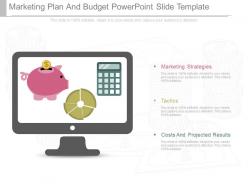 Use marketing plan and budget powerpoint slide template
Presenting use marketing plan and budget powerpoint slide template. This is a marketing plan and budget powerpoint slide template. This is a three stage process. The stages in this process are marketing strategies, tactics, costs and projected results.
-
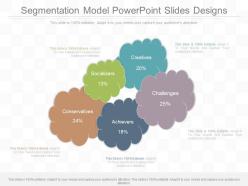 Apt segmentation model powerpoint slides designs
Presenting apt segmentation model powerpoint slides designs. This is a segmentation model powerpoint slides designs. This is a five stage process. The stages in this process are socializers, creatives, challenges, achievers, conservatives.
-
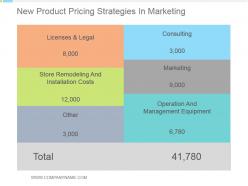 New product pricing strategies in marketing powerpoint slides
Presenting new product pricing strategies in marketing powerpoint slides. This is a new product pricing strategies in marketing powerpoint slides. This is a six stage process. The stages in this process are licenses and legal, store remodeling and installation costs, other, consulting, marketing, operation and management equipment.
-
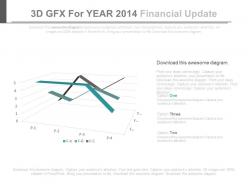 3d gfx for year 2014 financial updates powerpoint slides
Presenting 3d gfx for year 2014 financial updates powerpoint slides. This is a 3d gfx for year 2014 financial updates powerpoint slides. This is a three stage process. The stages in this process are financials.
-
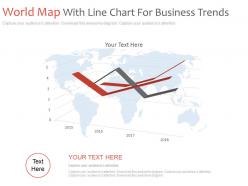 World map with line chart for business trends powerpoint slides
Presenting world map with line chart for business trends powerpoint slides. This is a world map with line chart for business trends powerpoint slides. This is a one stage process. The stages in this process are financials.
-
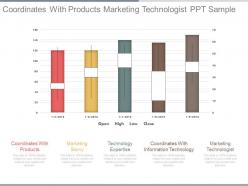 Coordinates with products marketing technologist ppt sample
Presenting coordinates with products marketing technologist ppt sample. This is a coordinates with products marketing technologist ppt sample. This is a five stage process. The stages in this process are timeline, strategy.
-
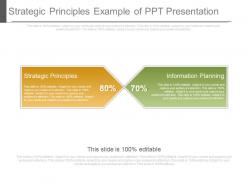 Strategic principles example of ppt presentation
Presenting strategic principles example of ppt presentation. This is a strategic principles example of ppt presentation. This is a two stage process. The stages in this process are finance, business, management.
-
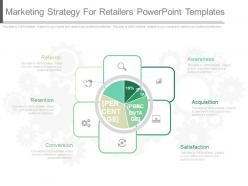 Marketing strategy for retailers powerpoint templates
User friendly fine quality PPT templates. Easy customization of colour, size, text and orientation of each icon and graphic. Effortless inclusion or exclusion of data as per demand. Personalisation by addition of company name, trademark or logo. Fit in widescreen. Compatible with varied info graphic software. Advantageous for business planners, business managers, marketing and financial executives, strategists, teachers, students. The stages in this process are referral, awareness, retention, conversion, satisfaction, acquisition.
-
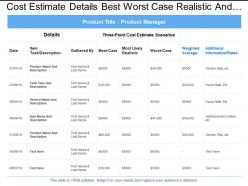 Cost estimate details best worst case realistic and weighted average
Presenting this set of slides with name - Cost Estimate Details Best Worst Case Realistic And Weighted Average. This is a seven stage process. The stages in this process are Cost Estimate, Price Estimate, Value Estimate.
-
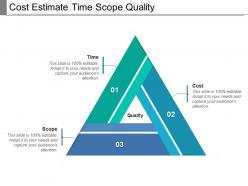 Cost estimate time scope quality
Presenting this set of slides with name - Cost Estimate Time Scope Quality. This is a three stage process. The stages in this process are Cost Estimate, Price Estimate, Value Estimate.
-
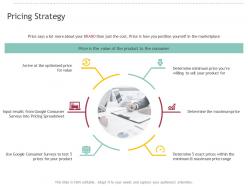 Pricing strategy r548 ppt powerpoint background image
Presenting this set of slides with name Pricing Strategy R548 Ppt Powerpoint Background Image. This is a one stage process. The stages in this process are Pricing Strategy. This is a completely editable PowerPoint presentation and is available for immediate download. Download now and impress your audience.
-
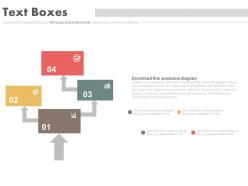 Four staged text boxes flow chart analysis powerpoint slides
Presenting four staged text boxes flow chart analysis powerpoint slides. This Power Point template diagram has been crafted with graphic of four staged text boxes and flow chart diagram. This PPT diagram contains the concept of business process flow representation. Use this PPT diagram for business and finance related presentations.
-
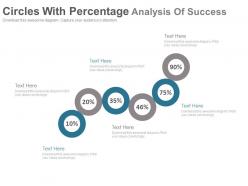 Six circles with percentage analysis of success powerpoint slides
Presenting six circles with percentage analysis of success powerpoint slides. This Power Point template diagram has been crafted with graphic of six circles and percentage diagram. This PPT diagram contains the concept of success analysis representation. Use this PPT diagram for business and finance related presentations.


