




 0 Comment
 Customer Reviews

Think of a consulting business as the brain of a business operation. Consulting businesses accrue data, analyze patterns, and recommend the next step. What happens when neuro-whatever experiences cognitive dissonance? Welcome to the spectacle of consulting irony: businesses that routinely advise and consult on strategy for companies frequently miscalculate their performance effectively. That's where consulting business dashboards make a grand entry. These are designed with the intent to organize, clarify, and provide a snapshot of your zip-code of data.
However, in spite of the immediate value, most consulting firms struggle with implementing consulting business dashboards efficiently. Whether the dashboard features are overly complex, the dashboard layout too clunky, or an abundance of data too overwhelming. And sometimes teams don't know where to even start, or worse, start and complete nothing. The result? Missed KPIs, bad decision making, and reliance on gut feeling over data.
Refer to our blog on Top 10 Business Dashboard Templates to expand business, opening new outlets or just analyzing where your next big revenue stream lies.
SlideTeam’s Consulting Business Dashboard Templates are specifically designed for consulting businesses who want clarity but not complexity. Whether it's keeping track of operational metrics , its business intelligence or it's just business analytics, these templates will help you stay in your lane.
What do you get? You get fully editable slides that are brimming with visuals. It's packed with operational metrics, dashboard software, business analytics, strategic planning, reporting tools , planning and more. It is user-friendly, content - friendly and available to download in PNG and JPG formats.
Get an insight to our blog on Top 10 business development dashboard to ensure that a company becomes and remains successful in the long term.
Template 1: Pet Care Consultation Business Dashboard PPT Slides
This PPT Theme covers a consulting dashboard that enables them to monitor operating procedures. It covers KPIs indicators, such as customer profiles, whether the customer has been counseled, and follow-up appointment information. Additionally, it records clinic data, team stats, and website traction, so that no aspect of business is left. It helps to make informed decisions by consolidating information in one place. Download it now.

Template 2: New Business Model Consulting Dashboards Showing Consultancy Company Performance
This PPT Theme includes budget preparation, sales progress, and company goals. It also gives you insights into the company profits category-wise and regional-wise, using which you can analyze the performance metrics of the company across segments. The dashboard provides a snapshot of year-to-date versus budget and prior year data that to depict clear growth and gaps. Get it now.

Template 3: New Business Model Consulting Company Dashboards Key Metrics of Performance Assessment
This presentation slide provides consulting metrics and indicators like availability, on-time delivery, service trends. It tracks internal orders and returns volume to showcase workflow efficiency and client satisfaction. It covers performance and customer complaints enables consultants to determine the areas requiring urgent attention. This dashboard comes in handy when you review your month over the month or even churn out high-level strategy sessions.

Template 4: Customer Consultancy Service Performance Dashboard PPT
This PPT Theme tracks how well a consultancy business performance services a customer. It includes metrics, such as total revenue, support costs, and customer satisfaction metrics. Service efficiency and resource management comes with metrics like cost per support and average time to resolve an issue. It is useful during the client review, performance evaluation, or an internal audit where there is clarity. Get it now.

Template 5: Revenue Dashboard of Online Consultation Service
This presentation template to get the most out of current vs past revenue making it an ideal dashboard when trying to track growth trends. It covers key metrics, such as average revenue and Customer Acquisition Cost (CAC), providing insights into profitability and marketing efficiency. The data works for real-time analytics monitoring and for monthly financial reviews, strategy planning, or investor presentations. Download it now.

Template 6: Consultative Leadership Dashboard to Monitor Employee Performance
This PowerPoint Theme covers leadership tracking for transparency and employee performance management and growth insight. It includes metrics, such as progress of leaders undergoing training, most powerful exceptional leaders, skills measurement, etc. Using these visuals, leadership teams measure the impact of training initiatives and spot high-potential employees across departments. It also empowers consultative leadership by promoting transparency. Download it now.

Template 7: Management Consulting Firm KPI Dashboard PowerPoint
This PPT Template covers KPI tracking and shines a spotlight on financial performance, client satisfaction, and project success. It comes with team productivity, marketing efforts and sales outcomes to check how they are aligned with the strategic goals. It is excellent for leadership teams to view KPIs in real-time, and see what needs attention. Be it board meetings or quarterly reviews, it illustrates how you can put your firm’s performance at the front. Get it now.

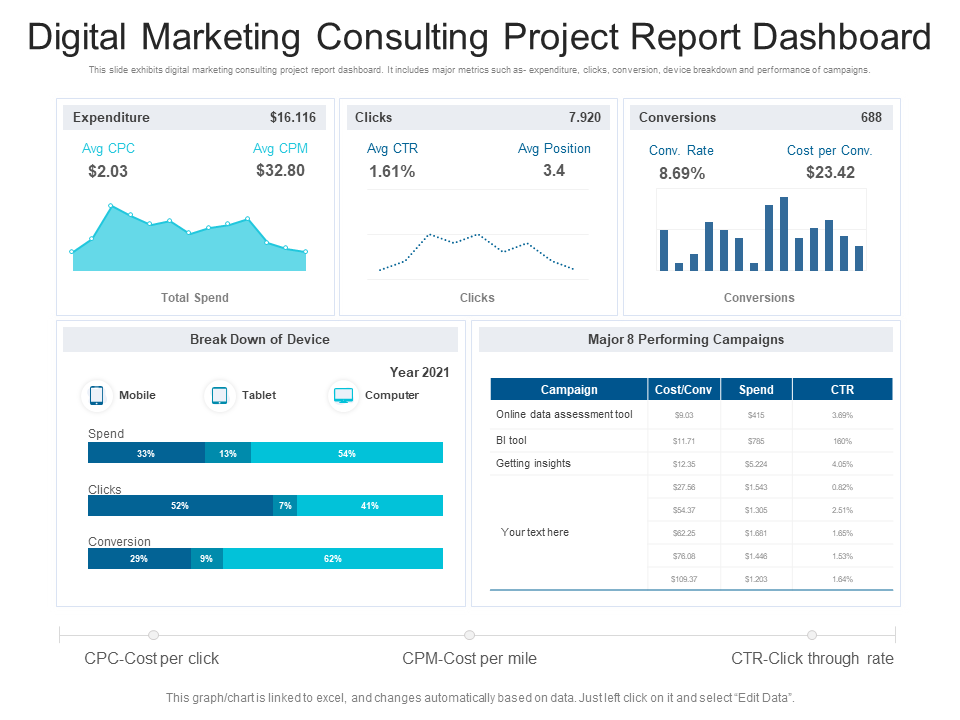
Template 8: Digital Marketing Consulting Project Report Dashboard Snapshot PPT
This PPT Theme features metrics, such as expenditure, clicks, and conversions, allowing marketing teams to get a good insight into the ROI. It also contains a device breakdown which assists in understanding which device audiences engage on the most, be it mobile, tablet or desktop. This visual reporting helps with popular ad placement and budget allocation. It assists in measuring what strategies are effective. Download it now.
Template 9: Consulting Project Status Dashboard with Workspaces PPT
This PowerPoint Theme helps managers and consultants to gain visibility regarding projects that are running. It gives live view updates across workspaces to surface the status of projects, indicating exactly which projects are on track, at risk or going slow. This analytics dashboard helps teams identify bottlenecks faster and bring priority tasks to the forefront for immediate action. Get it now to be efficient.

Template 10: Change Management Consulting Performance Dashboard Understanding Fundamental Concepts
This PPT Theme presents high-level KPIs such as current value, target value, trend and status. These metrics give consulting leaders consulting insights into whether change initiatives are unfolding as intended or whether they need to be recalibrated. It allows users to assess the effectiveness of change management strategies and zero in on the gaps well in advance by comparing actual performance with established targets. Download it now.

Visualize, Strategize, Optimize With Us!
With the rapid pace of consulting today, to stay competitive, we need to make better decisions, sooner. This is where consulting business dashboard templates become invaluable. Whether you are managing client portfolios, tracking project deliverables, data-driven decisions, monitoring KPIs, or analyzing client reporting, a good dashboard structure helps you gain clarity and control so you can lead with confidence.
Our consulting business dashboard templates help streamline operations, increase transparency, and keep your team on track with what matters most. You can apply these templates to everything from dynamic Gantt charts and financial overview boards to KPI heatmaps, so it makes your data come alive—that you put things in practice rather than just collecting the information.
But the real edge? Efficiency. Get your Templates from SlideTeam to enhance your business intelligence.
Look out our blog on Top 10 Business Analytics Dashboard Templates to track inventory, optimize supply chains, and predict customer behavior in real-time.
FAQs on Consulting Business Dashboards
1. What is the purpose of a consulting business dashboard?
A consulting business dashboard is a visual tool that consolidates and displays enterprise-level KPI and business metrics for monitoring and analysis in one place and in real-time. The goal of delivering these internal dashboards is to aid consulting firms in getting swiffer responses related to project status updates, client performance, financial health, and operational efficiency. You are able to make data-driven decisions and consultants and management remain aligned with business goals because the dashboard gives you a clear overview.
2. Which core metrics should be included to track business performance?
To track the comprehensive business performance of consulting firm, dashboard should include following core metrics:
Billable vs. Non-billable Hours
Utilization Rate
Project Profitability
Revenue per Consultant
Client Acquisition and Retention Rates
Average Project Duration
Cash Flow and Outstanding Invoices
Pipeline Value and Conversion Rate
These are metrics that can be used to measure both the stability of finances and the effectiveness of the operations.
3. How can project status and timelines be visualized effectively?
Tools such as: can be used to visualize project status and timelines in an effective manner.
Gantt Charts: Excellent for visually displaying project stages and tasks over a timeline.
Kanban boards: For displaying progress on tasks (e.g.( To Do, In Progress, Done)
Progress Bars / Percent Completion Indicators: Give a glimpse into how long until something is achieved.
Status Tags with Color Code (On Track, At Risk, Delayed): To quickly understand the project health.
Milestone trackers: Highlight critical milestones and upcoming due dates as well.
These data visualizations can be blended to create clarity for stakeholders.