





 0 Comment
 Customer Reviews

The alarm goes off at 2:47 AM. Someone's phone buzzing. Then another.
Plant operations don't pause for PowerPoint. When pressure drops or temperature spikes, you're not hunting through slide decks for the right sensor diagram. But afterward—when the shift ends, when management asks questions, when you're writing up what happened—that's when you need to explain how the control systems actually work.
Process automation presentations live in this weird gap. Between people who know exactly what pressure transmitters and temperature sensors do and people who've never seen one. Between operators who can read a P&ID in their sleep and executives who need the basics. Between the thing working and explaining why it worked.
Most instrumentation engineering knowledge stays in people's heads. Or buried in technical manuals that assume you already know what you're looking for. The guy who's been running the distillation column for fifteen years doesn't need slides about SCADA systems or data acquisition. But when he retires? When you're training someone new? When corporate asks how you're tracking safety parameters through your monitoring systems?
Suddenly you're building presentations from scratch. Trying to turn years of hands-on experience into something that makes sense on screen. Figuring out which details matter and which ones just confuse people who don't live on the plant floor every day.
That's where SlideTeam's process control instrumentation templates come in. They're built for this exact problem—when you know your systems but need to explain them to someone else. Pre-designed slides that cover the fundamentals without dumbing them down.
Here are the templates that work when technical knowledge needs to travel beyond the control room.
Template 1: Process Control Instrumentation Technology PPT
You need process automation and control systems instrumentation strategy that works, not vendor promises because "revolutionary" usually means "untested". This pre-designed PPT template provides actionable SWOT analysis, gap assessment, stakeholder mapping, KPI dashboards, competitor evaluation, and scenario-planning slides for strategic technology decisions. Project managers, operations consultants, and engineering teams can customize these prebuilt PowerPoint slides for strategic planning sessions on industrial automation, performance reviews, and client presentations. Download now.
[product_image id=1776756]
Template 2: Gap Analysis Slide PPT
This powerful template transforms complex process automation assessments into clear, actionable improvement strategies. The structured current-state analysis instantly highlights critical deficiencies in sensor integration, data consistency, and response protocols. The desired state framework creates compelling visual contrast that drives stakeholders to take urgent action. Every element leverages fully editable PowerPoint shapes with comprehensive customization flexibility. The numbered action plan methodology ensures systematic execution of gap bridging that eliminates guesswork. Perfect for creating impactful Operations Reviews, industrial automation presentations, and Strategic Planning sessions that demand measurable outcomes. Transform your real-time monitoring presentations today. Download this dynamic template now and unlock systematic operational excellence.

Download this PowerPoint Template
Template 3: Root Cause Analysis Using Fishbone/Ishikawa Diagram
This comprehensive fishbone diagram empowers you to dissect complex process automation challenges with surgical precision across five critical failure points. The structured Ishikawa framework transforms chaotic troubleshooting into systematic root cause identification, targeting data acquisition gaps, training deficiencies, integration bottlenecks, equipment failures, and control systems mishaps. Every visual element leverages fully editable PowerPoint shapes, enabling seamless customization to match your specific operational context. With professional diagnostic clarity built in, you can facilitate focused problem solving sessions that drive actionable solutions immediately. Transform your quality management presentations today. Download this powerful template now and unlock systematic process improvement capabilities.

Download this PowerPoint Template
Template 4: Competitor Benchmarking Template
This powerful template transforms complex competitive intelligence into crystal clear strategic advantage. The comprehensive six metric comparison framework delivers instant clarity on where you stand against key competitors across market share, technology leadership, and operational excellence in process automation and industrial automation. Visual highlighting captures critical positioning insights that drive informed decision making. Each element uses fully editable PowerPoint shapes, enabling seamless customization to reflect your specific factory automation industry and competitive landscape. Perfect for creating impactful Market Analysis presentations, Strategic Planning reviews, and Executive Briefings that showcase competitive positioning with authority. Transform your competitive analysis presentations today. Download this strategic template now and unlock deeper market intelligence insights.

Download this PowerPoint Template
Template 5: Stakeholder Mapping
This powerful stakeholder mapping template transforms complex relationship management into clear visual strategy. The comprehensive power interest matrix instantly categorizes eight critical stakeholder types across four strategic quadrants, enabling precise engagement prioritization for process automation and industrial automation projects. Smart summary counts for manufacturers, suppliers, end users, and consultants streamline stakeholder analysis at every project phase. Built with fully editable PowerPoint shapes, you gain complete customization control to reflect your specific organizational landscape and control systems requirements. Perfect for creating strategic stakeholder presentations, project kickoff meetings, and comprehensive relationship management frameworks that drive informed decision making. Transform your stakeholder engagement strategy today. Download this dynamic template now and unlock systematic relationship management success.

Download this PowerPoint Template
Template 6: Market Sizing Using TAM-SAM-SOM Model
Strategic planners need this pre-built TAM SAM SOM PowerPoint slide for market opportunity analysis. This PPT template visualizes $1B global process automation and industrial automation markets through actionable concentric circles, TAM ($1B), SAM ($500M North America), SOM ($200M obtainable). Consultants and product managers use this customizable preset for investor presentations and strategic planning sessions covering monitoring systems opportunities because executives actually understand circles better than complex charts. Download this proven market sizing framework now.

Download this PowerPoint Template
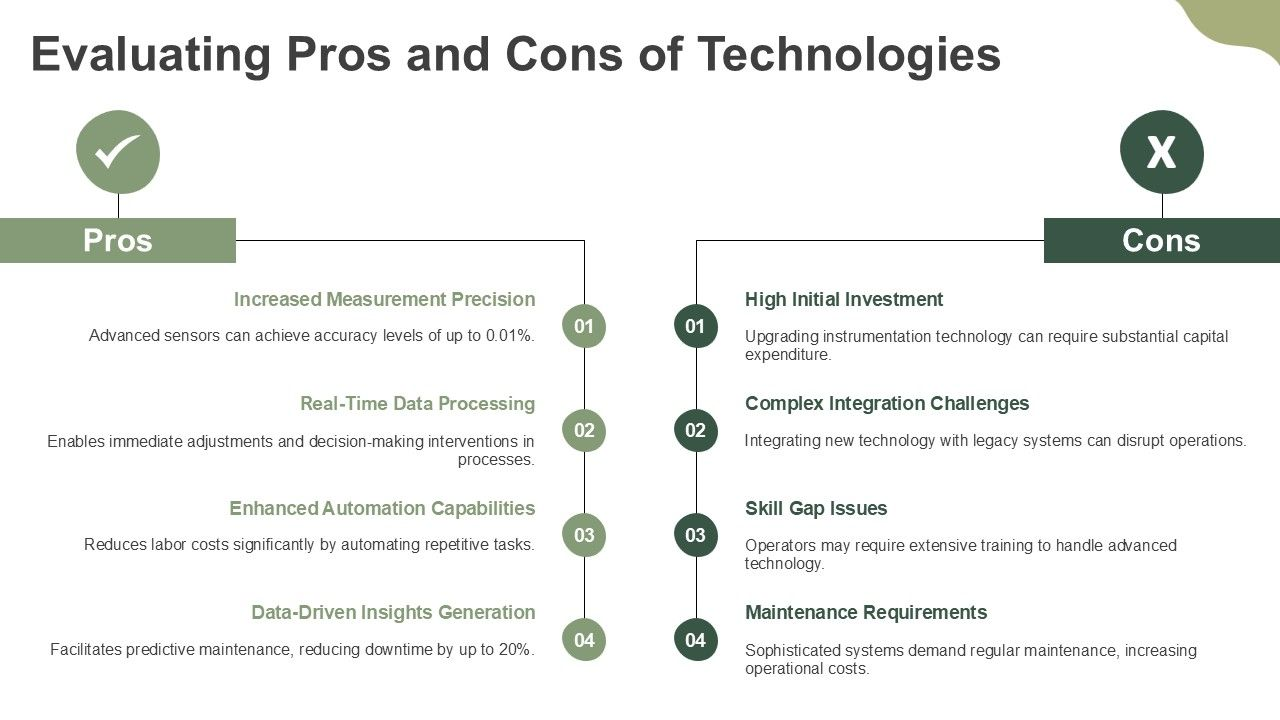
Template 7: Pros and Cons Evaluation
This powerful evaluation framework delivers instant clarity on critical technology adoption decisions through systematic advantage disadvantage analysis. The structured comparison format transforms complex cost benefit assessments into compelling visual arguments that stakeholders grasp immediately. Strategic categorization of measurement precision, process automation benefits, and real-time monitoring capabilities against investment risks streamlines decision-making processes. Every element uses fully editable PowerPoint shapes, ensuring seamless customization to match your specific industrial automation scenarios and organizational priorities. Create persuasive Technology Assessment presentations, Strategic Planning reviews, and Investment Decision frameworks that drive informed choices. Transform your technology evaluation presentations today. Download this dynamic template now and unlock confident decision-making power.
Download this PowerPoint Template
Template 8: Cost-Benefit Analysis
This powerful template merges comprehensive cost analysis with compelling visual storytelling through its balanced scale design. The structured framework weighs critical implementation factors against operational gains, delivering instant clarity on complex process automation and control systems decisions. Every element leverages fully editable PowerPoint shapes, ensuring seamless customization to match your specific analysis parameters. The intuitive visual metaphor transforms dense financial data into persuasive insights that resonate immediately with stakeholders. Perfect for creating impactful business case presentations, industrial automation investment proposals, and strategic decision-making frameworks that drive approval. Transform your financial analysis presentations today. Download this dynamic template now and unlock your persuasive business case potential.

Download this PowerPoint Template
Template 9: KPI Dashboard Template
You need this pre-built KPI Dashboard PowerPoint slide for operational reporting that actually works. The customizable template consolidates resource utilization bar charts, process distribution analysis, performance gauges tracking uptime and response metrics, and real-time monitoring into one actionable view. Operations managers and consultants can present complex operational data from process automation systems without drowning stakeholders in spreadsheet hell because we've all suffered through those endless data dumps. The pre-designed slide includes trend indicators and summary cards that let you tell the real story behind your industrial automation metrics. Download now for presentations that drive decisions.

Download this PowerPoint Template
Template 10: Risk Assessment Matrix PPT
This comprehensive template maps critical process automation risks across a strategic 4x4 assessment matrix that delivers instant visual clarity on threat prioritization. The intuitive impact versus likelihood framework streamlines complex risk evaluation from minor calibration techniques issues to severe regulatory consequences. Color coded severity indicators provide immediate visual hierarchy, enabling swift decision making across green, yellow, orange, and red risk categories. The structured grid format captures everything from rare control systems hiccups to likely compliance threats with professional precision. Perfect for building robust Risk Management presentations, regulatory compliance reports, and strategic threat assessments that command stakeholder confidence. Transform your risk evaluation presentations today. Download this essential template now and unlock systematic risk control that protects your operations.

Download this PowerPoint Template
Transform Process Control Mastery with SlideTeam
SlideTeam's PowerPoint templates are the industry's best solution for process automation and control systems presentations. These content-ready slides streamline complex technical concepts with professional clarity, saving hours of design work while ensuring your instrumentation systems are communicated effectively. Our custom-made templates feature structured layouts specifically designed for technical specifications and control processes. Deploy these PowerPoint slides to secure stakeholder buy-in and drive your automation projects to success.
FAQs on Process Control Instrumentation Technology
What are the key components of process control instrumentation technology?
Process control instrumentation has three core components. First, sensors in monitoring systems measure variables like temperature, pressure, and flow rates in real time. Second, controllers receive sensor data and calculate required adjustments using preset parameters. Third, actuators execute the controller's commands by adjusting valves, pumps, or other equipment. These control systems work together to maintain desired process conditions automatically through process automation without human intervention.
How does automation impact the efficiency of process control systems?
Automation reduces human error in process control by replacing manual tasks with sensors and controllers. Real-time monitoring speeds up response times from hours to seconds when process conditions change. Production throughput increases by 15-30% as systems run continuously without breaks. Fewer operators are needed per shift, cutting labor costs while maintaining consistent product quality through precise control loops.
What role does sensor technology play in process control instrumentation?
Sensors measure key process variables like temperature, pressure, and flow rate in real-time. They convert physical measurements into electrical signals that control systems can read through data acquisition. Modern digital sensors provide faster response times and better accuracy than older analog versions. Without reliable sensor data, process automation and monitoring systems cannot maintain product quality or safe operating conditions.
How can data analytics enhance decision-making in process control?
Data analytics turns raw sensor data into actionable insights for operators. Real-time monitoring detects process deviations before they become problems, enabling faster corrections. Predictive models forecast equipment failures and optimize maintenance schedules. Process data analysis identifies patterns that improve process efficiency and reduce waste. Analytics dashboards present complex information in simple visual formats, helping operators make quick, informed decisions during critical situations.
What are the latest trends in process control instrumentation technology?
Digital sensors now replace analog ones in most plants. Cloud-based control systems enable remote monitoring from any location. AI algorithms predict equipment failures before they occur. Wireless networks eliminate costly cable installations. These changes reduce maintenance costs and improve safety through process automation. Plant operators can now access real-time monitoring data on mobile devices. Predictive maintenance prevents unexpected shutdowns.
How do regulatory standards influence process control instrumentation design?
Regulatory standards set mandatory safety and performance requirements that manufacturers must follow. Standards like ISA, IEC, and ANSI define specifications for sensor accuracy, response times, and fail-safe operations in process automation. Companies must design instruments to meet these benchmarks before market release. Standards also require specific testing protocols and documentation, which directly shapes how control systems and monitoring systems are built and validated.
What are the challenges in integrating IoT with process control systems?
IoT integration faces three main challenges in industrial process control systems. First, cybersecurity risks increase when connecting industrial networks to internet-based devices. Second, legacy control systems often lack compatibility with modern industrial IoT protocols and data formats. Third, real-time performance suffers due to network latency and bandwidth limitations affecting data acquisition. Companies must upgrade security protocols, install gateway devices for protocol translation, and implement edge computing to process data locally before cloud transmission.
How do calibration methods affect the accuracy of process control instruments?
Calibration directly determines instrument accuracy by comparing readings to known standards. Use multi-point calibration techniques across the full operating range, not single-point checks. Perform calibration at actual process conditions when possible - temperature and pressure matter. Regular calibration intervals prevent drift - monthly for critical loops, quarterly for standard applications. In instrumentation engineering, document all calibration data to track instrument performance trends over time for process optimization.
What are the benefits of using real-time monitoring in process control?
Real-time monitoring prevents equipment failures by detecting problems before they escalate. It cuts downtime by 20-30% through immediate alerts when parameters drift outside normal ranges. Production quality improves because process automation allows operators to adjust processes instantly when deviations occur. Energy costs drop as systems automatically optimize based on current conditions rather than preset schedules.
How does cybersecurity impact process control instrumentation technology?
Cyber attacks can shut down entire manufacturing plants by targeting SCADA systems and control systems. Install network firewalls between your control systems and corporate networks. Update software patches regularly on all instruments and controllers, including those with PLC programming. Train operators to recognize phishing attempts and suspicious network activity. Use multi-factor authentication for system access. These cybersecurity steps prevent hackers from disrupting production or stealing sensitive process data.


