





 0 Comment
 Customer Reviews

Surveys by International Data Corporation (IDC) put it bluntly. You can, in fact, put a price tag on the damage that botched processes do to organizations every year:
$1.3 million.
That number stings. But with growth comes cost. A cost you can minimize and convert into revenue streams.
SlideTeam’s content-ready Six Sigma gap analysis PowerPoint presentation template shows you exactly how to do it.
Packed with 41 fully editable PowerPoint sample slides with an eye-catching theme, this slide deck contains structural frameworks that uncover hidden operational opportunities.
Used in a team discussion or executive meeting, this creative bundle will leave your audience impressed and inspired.
Even better: SlideTeam’s Lean Six Sigma black belts and expert visual storytellers have crafted this deck. So you will not only save hours in preparation and design but also deliver an unforgettable message.
Let’s explore the template and Six Sigma!
For additional resources on bridging performance gaps, explore our Top 10 Gap Analysis Templates with Samples and Examples.
Template 1: Six Sigma Gap Analysis Introduction
The PowerPoint template bundle begins with this introductory slide that describes your approach to process improvement with succinct points. Use this slide to identify and minimize inefficiencies within processes to enhance productivity and reduce waste through systematic data-driven analysis, fostering a culture of excellence. With input from your stakeholders, you can drive customer satisfaction by enhancing product quality and service delivery to meet expectations through timely feedback and quality management initiatives. Replete with fully editable graphics and placeholders, this PPT sample is a must-have for quality assurance teams and process improvement specialists to analyze and operate with minimum lag. You can replace the stock image with yours to ensure the message stays on-brand. Click below and add this bundle to your toolkit now!

Template 2: Importance of Six Sigma in Business
How can Lean Six Sigma be beneficial for your organization? Use this descriptive PPT slide in the bundle to explain it all and get executive buy-in for your project. Pinpoint the steps you can take to eliminate waste and reduce costs through efficient processes; enhance customer experience by meeting quality requirements consistently; and streamline processes to increase productivity and operational efficiency. Six Sigma black belts and performance managers can drive impressive cost reduction, customer satisfaction, process improvement, and data-driven decision making with this structured PPT design. You can also infuse this PowerPoint sample with performance metrics and data analysis to curate a well-informed business strategy. Go ahead and add this to your library of proven frameworks.

Template 3: Understanding Process Improvement Framework
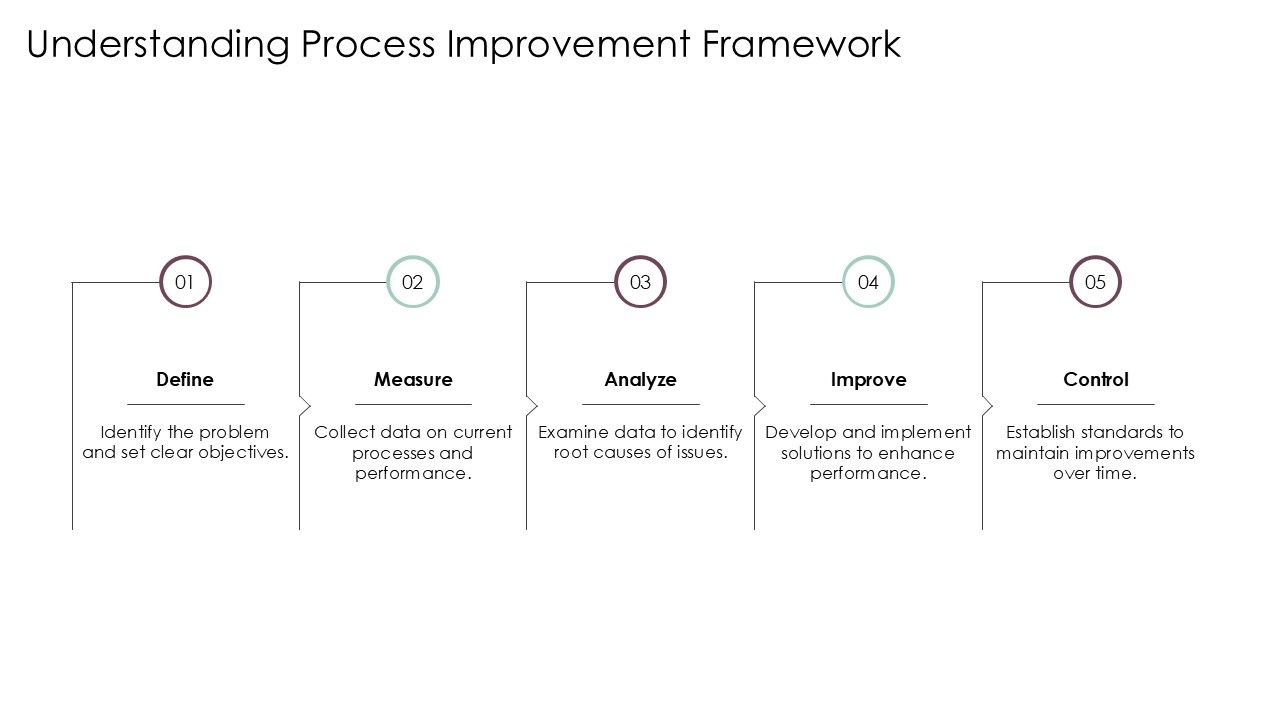
To set solid groundwork for your root cause analysis, you must put in place a workflow that scales with your organization. Find out where opportunities for continuous improvement are within your company with this descriptive PPT slide. Using this editable PPT design, you can identify the problem, set clear objectives, collect data on current processes and performance, and examine data to identify root causes of issues. Once you’ve outlined the foundation, it’s time to develop and implement solutions to enhance performance while establishing standards to maintain improvements over time. Quality engineers and operational excellence leaders deploy this handy PPT sample to define, measure, analyze, improve, and control organizational change parameters. So grab this PowerPoint bundle now and put your company on a winning track.
Template 4: Identifying Current Performance Levels
Analysts take a holistic view of the current state of the system to unlock operational excellence. To understand your organization’s current performance levels, deploy this concise yet impactful PowerPoint template design. Packaged into the bundle with a thematic outline, this PPT sample describes how to utilize statistical tools to assess process performance and pinpoint current defect rates, enabling targeted improvements through informed decision making in Six Sigma projects. You can also create detailed process maps to visualize workflows and identify bottlenecks, facilitating a clearer understanding of process variations and opportunities for enhancement. Manufacturing managers and process analysts can expedite defect reduction by conducting accurate data analysis and process mapping using this fully editable PPT design. Get it now!

Template 5: Defining Ideal Performance Standards
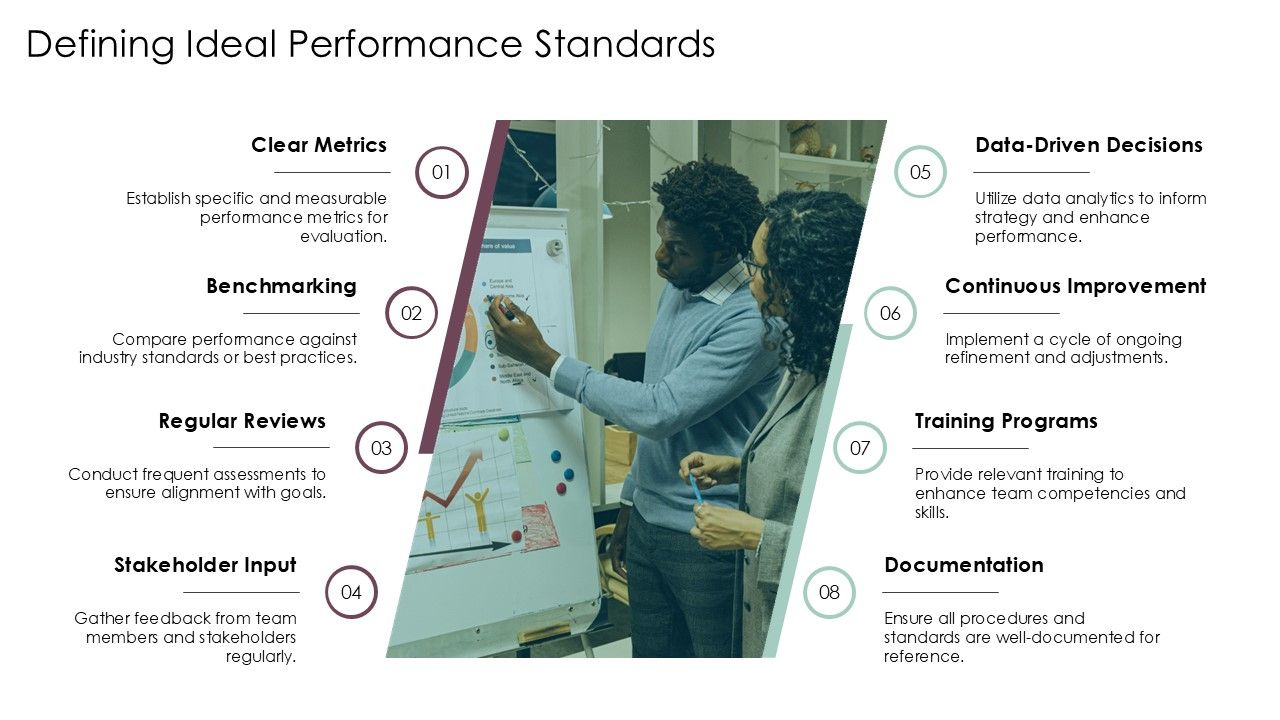
A key component of Six Sigma methodologies is to define the ideal benchmarks of performance that your organization needs to meet to reach the optimal state. Collate these benchmarks and more using this PPT sample that helps you establish specific and measurable performance metrics for evaluation. You can also compare performance against industry standards or best practices and conduct frequent assessments to ensure alignment with goals. The fully editable PowerPoint sample is a versatile tool to gather feedback from team members and stakeholders regularly, utilize data analytics to inform strategy, and enhance statistical process control. Lean coordinators and quality control supervisors can implement a cycle of ongoing refinement and adjustments using the information provided in this content-ready slide. Click below and make this PPT sample yours.
Template 6: Gap Analysis: Concept and Definition
This PPT slide presents the concept and definition of gap analysis that will help your team power up quality assurance programs. Use this flexible PowerPoint design to pinpoint specific discrepancies between current performance and desired outcomes to determine areas that require immediate improvement, enhancing overall project efficiency. You can also describe how to utilize gap analysis to streamline processes, which reduces waste and boosts productivity by focusing efforts on high-impact areas that yield significant benefits. This PPT slide example establishes clear, measurable objectives based on the identified gaps, fostering a focused approach to Six Sigma projects and ensuring alignment with organizational goals. Project managers and process engineers can identify gaps, improve processes, and set objectives powered by effective value stream mapping with this PPT slide. Get it now!

Template 7: Key Components of Gap Analysis
Extending the previous slide, this PowerPoint presentation slide gives you the basis to evaluate existing processes to identify inefficiencies and areas requiring improvement for better quality. Deploy this PPT design to streamline process mapping and define specific performance metrics that align with Six Sigma goals for improved process outcomes. You can also develop a structured plan to bridge the gap, incorporating resources, timelines, and responsible teams by providing relevant training to enhance team competencies and skills. Ensure all procedures and standards for data analysis are well-documented for reference with this PPT sample. Business analysts and improvement consultants can collate the current state, desired state, action plan, training programs, and documentation with this comprehensive gap analysis preset.

Template 8: Tools and Techniques for Gap Analysis
Looking for frameworks to bolster your quality control measures? This PPT slide offers a wide range of ready-to-use tools for the same. Use the SWOT tool to evaluate strengths, weaknesses, opportunities, and threats thoroughly. Go for the Pareto chart to identify the most significant gaps using the Pareto principle. Incorporate root cause analysis to determine the underlying causes of discrepancies effectively. Conduct process mapping to visualize current and desired processes to find gaps. Thereafter, use benchmarking to compare performance against best practices in the industry. The fishbone diagram will come in handy to analyze potential causes of issues in a structured format. Production supervisors and quality directors can deploy this PPT slide to simplify process assessments and report on findings in a digestible visual.

Template 9: Data Collection Methods for Analysis
This next PowerPoint slide design in the bundle offers effective techniques designed for Six Sigma data collection. You can use online surveys to gather customer feedback effectively, conduct structured interviews for in-depth qualitative insights, and implement observational studies to monitor real-time processes. Customize and plug in this PowerPoint slide to analyze existing documents to identify gaps and areas for improvement; engage focus groups to capture diverse customer perspectives rapidly; and perform benchmarking against industry standards. Operations managers and Six Sigma green belts can incorporate these surveys to bring together a mix of interviews, observations, document review, and focus groups to standardize analytical models and share their findings with key stakeholders.

Template 10: Identifying Root Causes of Gaps
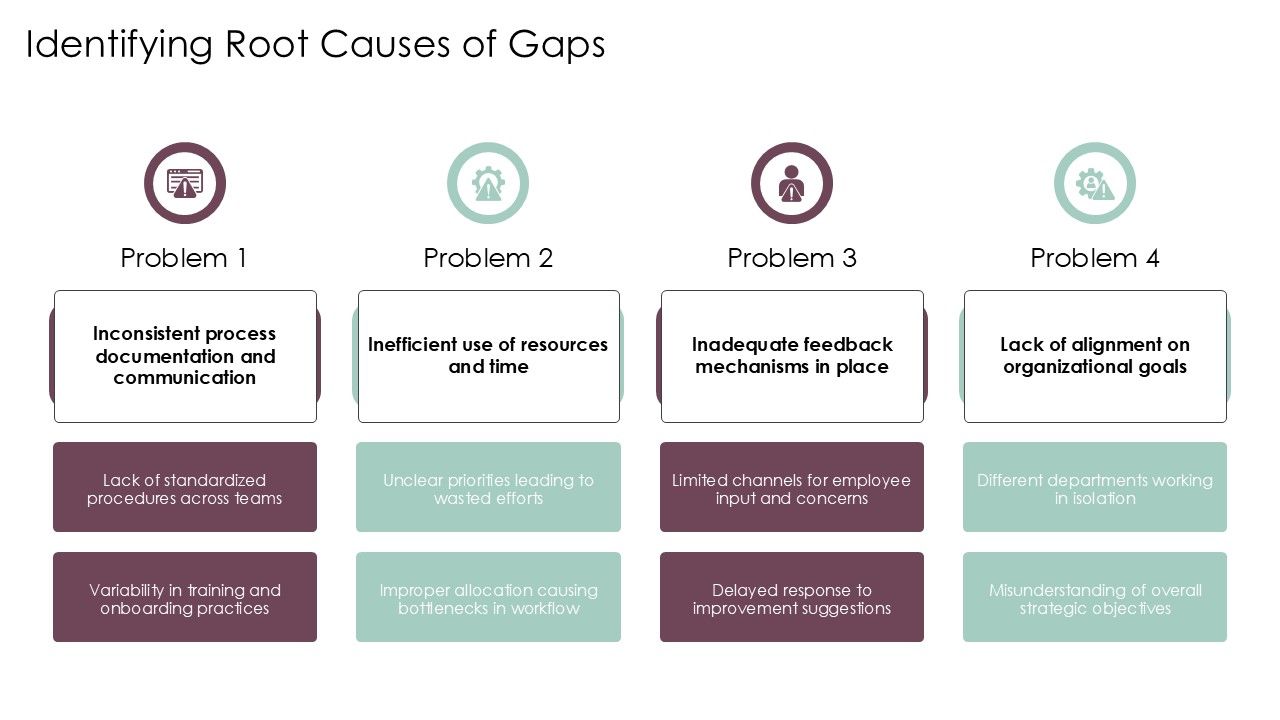
With these slides, you’ll have a deep understanding of every factor resulting in performance snags within your organization. List all these problems in this color-coded PowerPoint slide within the deck. The pointers can include inconsistent process documentation and communication; lack of standardized procedures across teams; and variability in training and onboarding practices. The PPT slide also has placeholders to pinpoint inefficient use of resources and time; unclear priorities leading to wasted efforts; and improper allocation resulting in bottlenecks in workflows. You can also demonstrate the contribution of inadequate feedback mechanisms; limited channels for employee input and concerns; and delayed response to improvement suggestions. Process owners and improvement specialists can highlight lack of alignment on organizational goals and misunderstanding of overall strategic objectives with this customizable sample.
To Conclude
Offering proven frameworks to set your organization up for success, this Six Sigma gap analysis PowerPoint presentation deck is your ultimate companion for process evaluation and adaptation. Feel free to modify it to your liking and infuse it with your branding to create a powerful business process reengineering project that drives performance improvements as you scale.
PS: To establish efficient processes that drive high quality outcomes, try our Top 10 Six Sigma Quality Improvement Plan Templates with Samples and Examples.
PPS: Nip process failures in the bud with our collection of Top 10 Gap Assessment Templates with Examples and Samples.
FAQs on Six Sigma Gap Analysis
1. What performance gaps are identified between current and desired Six Sigma metrics?
When evaluating current and desired Six Sigma metrics, you can unearth performance gaps including defect rates exceeding target sigma levels, cycle time variations, customer satisfaction scores below benchmarks, and process capability indices falling short of Six Sigma standards.
2. How is baseline performance data collected and validated?
Six Sigma analysts obtain and validate baseline performance data with practical approaches including interviews, surveys, quizzes, organizational process mapping, and statistical sampling. With these techniques, one can derive accurate, reliable, and actionable insights by collating data from multiple sources.
3. What are the root causes contributing to these performance gaps?
Performance gaps occur because of inadequate process controls, insufficient training, equipment limitations, unclear procedures, erroneous workflows, human errors, and lack of standardized operations.


