





 0 Comment
 Customer Reviews

The deck's due in two hours. The content exists—somewhere in a Jupyter notebook, a half-finished report, and three Slack threads nobody can find.
That's the real problem with data science machine learning presentations. It's not the math. Most people who work in this space know the concepts well enough. The gap is between knowing how gradient descent works and making a room full of stakeholders actually care about it. Between understanding supervised learning and explaining it to someone who hasn't touched a dataset in their career.
And the pressure compounds. Machine learning engineers and data scientists are expected to present up, down, and sideways—to technical peers, to executives, to clients who think "model" means a fashion shoot. One audience wants the architecture. Another wants the ROI. Most presentations try to do both and end up doing neither.
There's a specific kind of paralysis that hits when you open a blank slide. You've got the neural networks diagram. You've got the feature engineering breakdown. You know what the predictive analytics output means. But structuring it into something that lands—that tells a story without burying the insight—that's where the time goes. Hours of it.
The formatting decisions alone are exhausting. Where does the regression analysis go? How do you visualize unsupervised learning clusters without confusing everyone? What does a quarterly ML roadmap even look like on a single slide?
So pre-designed templates exist for exactly this reason. Not because data scientists can't design. Because they shouldn't have to—not at midnight before a client pitch, not when the model's still running, not when the actual work is the science, not the slide layout.
SlideTeam's data science machine learning templates are built around this specific gap. Content-ready frameworks that handle the structure so you can focus on the substance. Whether you're presenting machine learning algorithms to a boardroom or mapping a six-month data science roadmap for your team, the layouts are already there.
Here's what's in the collection.
Template 1: Machine Learning Algorithms for Data Science Projects PPT Summary
Captivating presentations start with layouts that match the depth of your content. This deck merges visual impact with structured storytelling for machine learning algorithm overviews. Color-coded sections deliver instant clarity across complex data science projects. You can anchor each slide to a specific algorithm, driving audience comprehension without overwhelming detail. The pre-built framework lets you present supervised and unsupervised learning side by side with confidence. Use this deck to turn raw model logic into persuasive, boardroom-ready narratives. Transform your machine learning algorithm presentations today. Download this dynamic template now and unlock your data science communication potential.
[product_image id=1651083]
Template 2: Machine Learning Algorithms for Effective Data Science Solutions PPT Summary
Presenting machine learning solutions to a non-technical audience demands structure and visual clarity. This deck elevates your ability to communicate effective data science solutions with precision and polish. Each slide translates complex algorithm logic into audience-friendly visuals that capture attention immediately. The layout anchors your narrative around outcomes—making your models' business value impossible to ignore. Flexible section headers let you adapt the flow for client pitches or internal reviews alike. Use this deck to bridge the gap between ML model complexity and executive understanding. Transform your data science solution presentations today. Download this dynamic template now and unlock your persuasive edge.
[product_image id=1635630]
Template 3: Machine Learning in Science PPT Sample
Science communication rarely gets the visual treatment it deserves. This PPT template is built for researchers and analysts who need to present machine learning findings with clarity and credibility. It suits walkthroughs of deep learning techniques, experimental ML pipelines, or AI and machine learning research summaries. The structured layout helps audiences follow the logic without getting lost in technical density. The template is 100% editable and customizable.
[product_image id=1413801]
Template 4: Machine Learning Algorithms in Data Science Explained PPT Guidelines
Explaining machine learning algorithms to mixed audiences is one of the harder communication tasks in data science. This deck captures that challenge directly, delivering a guideline-driven structure that moves from concept to application. Visual hierarchy drives comprehension—each slide builds understanding progressively, reducing cognitive load for your audience. The layout supports breakdowns of supervised learning, unsupervised learning, and everything in between with equal clarity. Flexible section architecture lets you tailor depth for technical or executive audiences without rebuilding from scratch. Use this deck to make complex algorithm explanations feel intuitive and credible. Transform your ML algorithm presentations today. Download this dynamic template now and unlock your teaching potential.
[product_image id=1720542]
Template 5: Data Science and Machine Learning PPT Graphics
Connecting data science concepts to real business decisions is harder than it looks. This PPT preset is designed for analysts and ML engineers who present to stakeholders who need context, not just charts. It works well for data visualization reviews, big data analytics summaries, or cross-functional ML project briefings. Explore more curated data science machine learning templates with samples and examples to find the right fit for your specific use case. The template is 100% editable and customizable.
[product_image id=1512750]
Template 6: Machine Learning Fundamentals for Data Science Projects PPT Outline
Strong fundamentals presentations build credibility before you ever show a result. This PPT template is built for data science training sessions, onboarding decks, and machine learning course introductions. It lays out core ML concepts—from feature engineering basics to model evaluation—in a logical, digestible flow. Practitioners running data science bootcamp modules or internal upskilling programs will find the structure immediately usable. The template is 100% editable and customizable.
[product_image id=1668924]
Template 7: Machine Learning Algorithms for Data Science Projects
Project-focused ML presentations need structure that mirrors how the work actually happens. This deck is built for machine learning engineers and data scientists presenting end-to-end project workflows. It accommodates algorithm selection rationale, model performance comparisons, and next-step recommendations in a single coherent flow. Use it for sprint reviews, project kickoffs, or data science career portfolio showcases where clarity of thinking matters as much as results. The template is 100% editable and customizable.
[product_image id=1654195]
Template 8: Sparsity Data Science Machine Learning Optimization PPT Example
Sparsity and optimization are concepts that lose audiences fast without the right visual anchors. This deck makes machine learning optimization tangible—translating abstract mathematical principles into clear, slide-friendly visuals. Minimalist design keeps attention on the model logic, not the formatting. Each layout supports detailed technical walkthroughs, from L1 regularization breakdowns to full sparsity analysis frameworks. The structured progression ensures your audience follows the argument without losing the thread. Use this deck to present complex ML optimization work with authority and precision. Transform your optimization presentations today. Download this dynamic template now and unlock your technical storytelling potential.
[product_image id=1229768]
Template 9: Top Machine Learning Algorithms for Data Science Projects PPT Information
Ranking and comparing machine learning algorithms is a frequent deliverable in data science projects. This PPT template gives practitioners a structured format to present top-performing algorithms with supporting evidence and context. It suits technical reviews, ML model selection briefings, and data science project status updates equally well. The layout makes algorithm performance data visually accessible without sacrificing analytical depth. The template is 100% editable and customizable.
[product_image id=1645453]
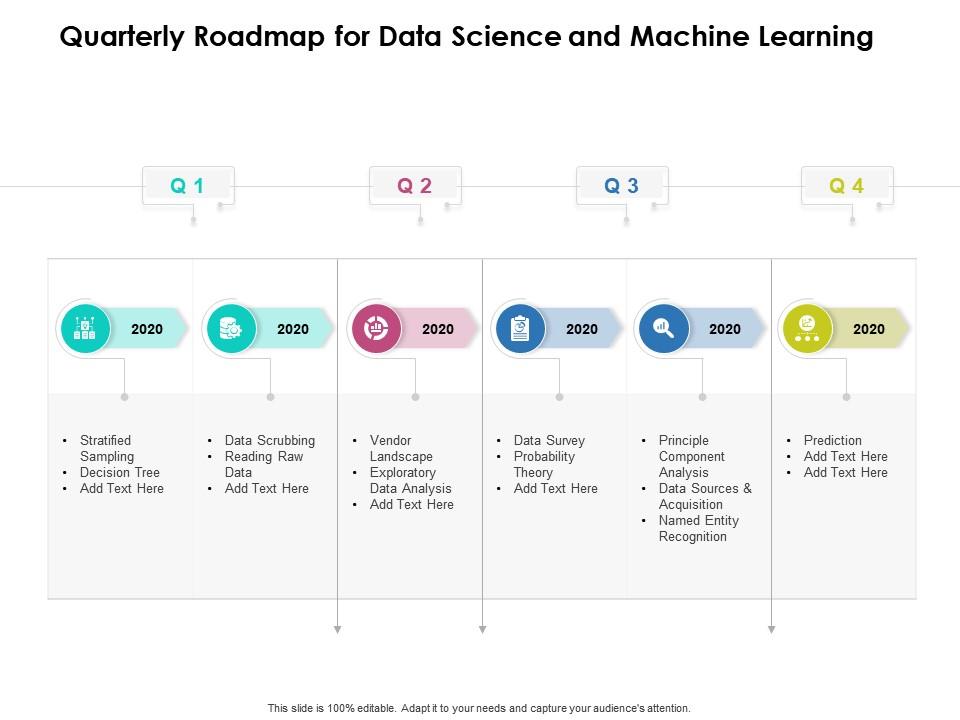
Template 10: Quarterly Roadmap for Data Science and Machine Learning
Quarterly planning for ML work rarely fits neatly on a single slide—until now. This PowerPoint slide gives data science leads and ML project managers a clean, time-structured roadmap format. It covers sprint milestones, model development phases, and deployment checkpoints across a full quarter. Use it for stakeholder alignment sessions or team planning reviews where timeline visibility drives better decisions. The template is 100% editable and customizable.
Download this PowerPoint Template
Template 11: Data Science Technology and Machine Learning Icon
Visual shorthand matters in data science presentations—especially when slides need to travel across teams. This PPT preset offers a focused icon set built around data science technology and machine learning concepts. It works best as a supporting layer inside larger decks, adding visual consistency to technical slides. Teams building out ML frameworks documentation or data science tools overviews will find these icons immediately useful. The template is 100% editable and customizable.
Download this PowerPoint Template
Template 12: Machine Learning Data Science Professional PPT Graphics
Professional-grade data science presentations need polish that matches the rigour of the analysis. This deck delivers exactly that—combining a clean aesthetic with structured slide architecture for technical and strategic use. Graphic-rich layouts communicate model outputs and statistical analysis results with immediate visual impact. The versatile design supports everything from ML model reviews to data science career development presentations. Each section is built to hold complex information without cluttering the visual field. Use this deck to present your data science work with the professionalism it deserves. Transform your ML presentations today. Download this dynamic template now and unlock your professional edge.
[product_image id=1686511]
Template 13: Machine Learning Algorithms Used in Recommendation Systems PPT Example
Recommendation systems are some of the most commercially impactful ML applications—and the hardest to explain clearly. This deck captures that complexity and makes it presentable for technical and business audiences alike. Structured layouts walk through algorithm selection, model architecture, and performance outcomes with logical visual progression. The design supports case study presentations, system design reviews, and client-facing ML capability showcases with equal effectiveness. Each slide is built to make natural language processing and collaborative filtering logic feel approachable. Transform your recommendation system presentations today. Download this dynamic template now and unlock your ML storytelling capability.
[product_image id=1632498]
Template 14: Machine Learning Applications in Financial Data Science PPT Summary
Financial data science is a high-stakes domain where presentation credibility is non-negotiable. This PPT template is built for data scientists and analysts presenting ML applications to finance teams, risk committees, or investment stakeholders. It suits predictive analytics use cases—credit scoring, fraud detection, portfolio optimization—where both accuracy and explainability matter. The layout supports clean side-by-side model comparisons and outcome visualizations that finance audiences expect. The template is 100% editable and customizable.
[product_image id=1632499]
Template 15: Regression Analysis in Machine Learning and Data Science PPT Presentation
Regression analysis sits at the intersection of statistics and practical machine learning—and it's notoriously hard to present well. This PowerPoint slide is built for practitioners who need to walk stakeholders through model assumptions, outputs, and interpretations without losing them. It suits statistical analysis reviews, ML model validation sessions, and data science training workshops focused on regression techniques. The structured layout keeps the audience oriented as complexity increases across slides. The template is 100% editable and customizable.
[product_image id=1698177]
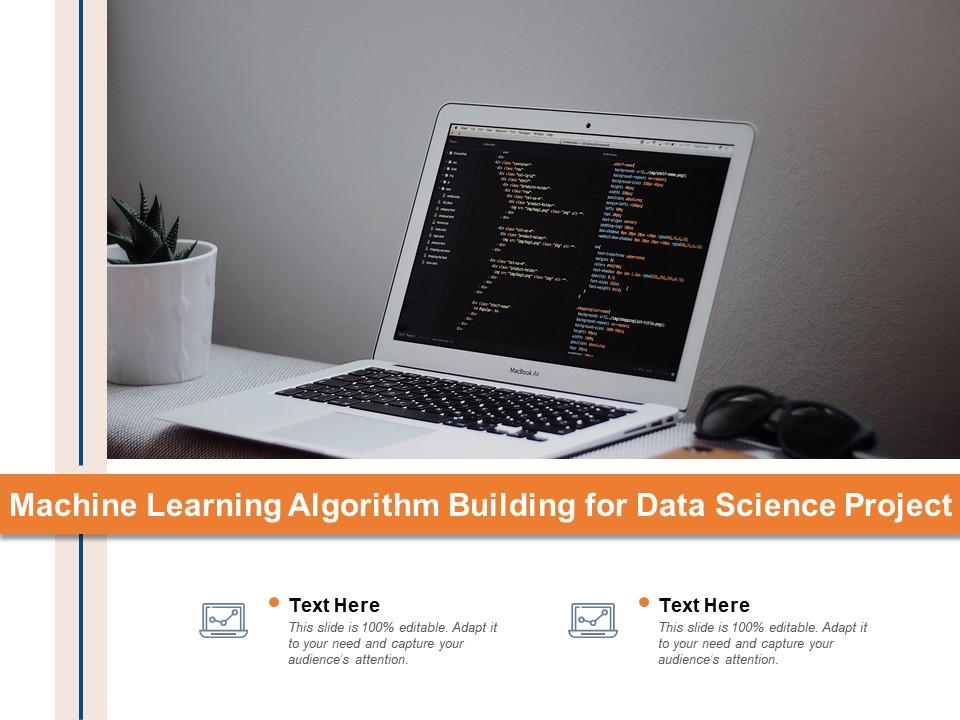
Template 16: Machine Learning Algorithm Building for Data Science Project
Building a machine learning algorithm from scratch is a two-stage process—and every stage needs documentation. This deck captures that workflow visually, giving data science teams a structured format for presenting algorithm development progress. Each slide supports both the conceptual framing and the technical implementation detail that project stakeholders need. The clean layout makes it straightforward to present algorithm building milestones to technical reviewers or executive sponsors. Use this deck to communicate your ML development process with structure and clarity. Transform your algorithm-building presentations today. Download this dynamic template now and unlock your project communication potential.
Download this PowerPoint Template
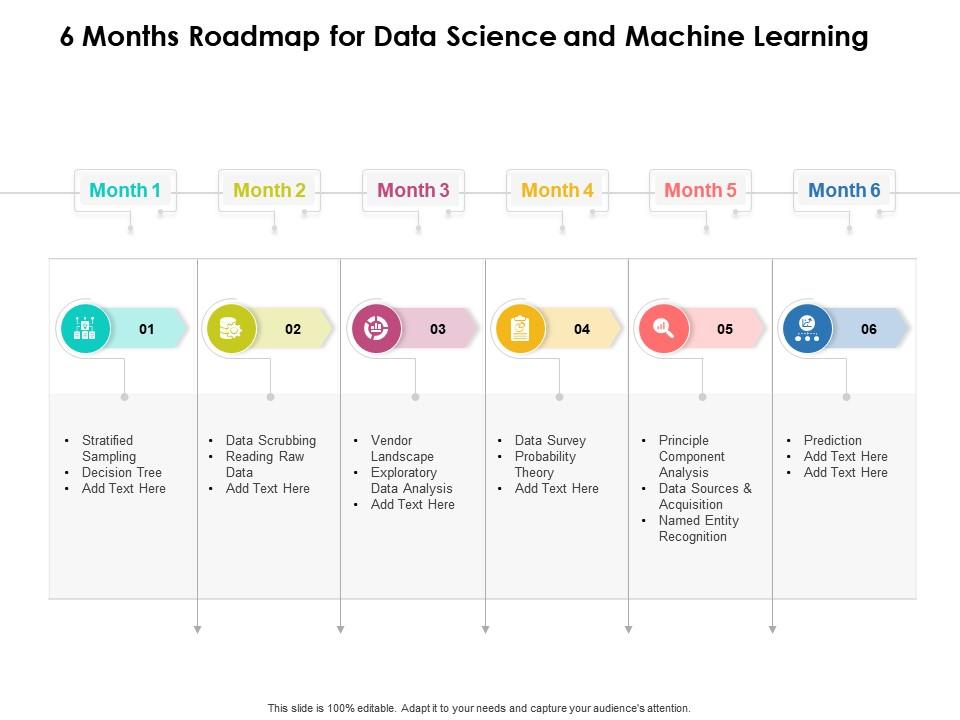
Template 17: 6 Months Roadmap for Data Science and Machine Learning
A six-month view is where ML projects get real—where planning meets delivery and timelines get tested. This PPT preset is built for data science leads who need to show a credible, phased roadmap across a meaningful time horizon. It suits project kickoff presentations, mid-year reviews, and data science program planning sessions where month-by-month visibility matters. The clean timeline structure makes dependencies and milestones easy to read at a glance. The template is 100% editable and customizable.
Download this PowerPoint Template
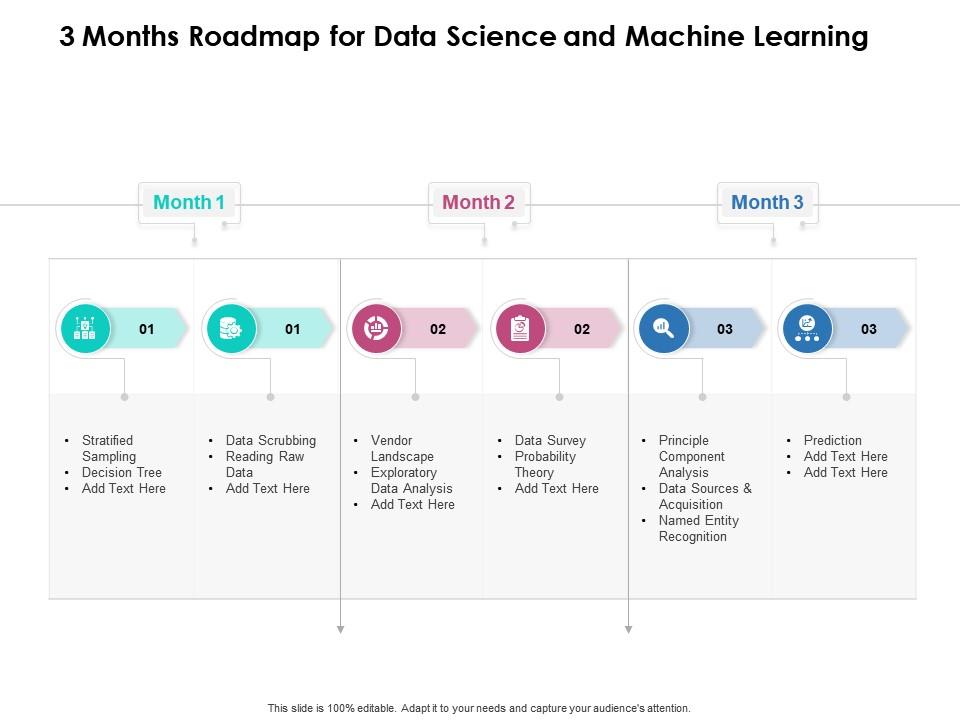
Template 18: 3 Months Roadmap for Data Science and Machine Learning
Three months is enough time to show real progress on an ML initiative—if the plan is clear from the start. This slide gives project managers and data science leads a tight, quarter-focused roadmap format. It works well for sprint planning presentations, data science project onboarding, and stakeholder check-ins where a concise timeline drives the conversation. The structured layout keeps priorities visible without overwhelming the audience with detail. The template is 100% editable and customizable.
Download this PowerPoint Template
Elevate Every Data Science Presentation with SlideTeam
SlideTeam's PowerPoint templates are the best in the industry for data science machine learning presentations. These content-ready slides save hours of formatting work while delivering the professional structure your machine learning models and predictive analytics findings deserve. Use these ready-made PowerPoint slides to present everything from regression analysis to quarterly ML roadmaps with clarity and authority. Deploy these pre-designed frameworks today and make every data science presentation land exactly as intended.
FAQs on Data Science Machine Learning
How does gradient descent optimization differ between batch, stochastic, and mini-batch approaches in neural network training?
Batch gradient descent uses the full dataset per update—stable but slow on large data. Stochastic gradient descent updates weights after each single sample—fast but noisy. Mini-batch splits the data into small chunks, balancing speed and stability. For most neural network training, mini-batch is the practical default. Batch size is a hyperparameter you tune based on memory and convergence behavior.
What are the key statistical assumptions that must be validated before applying linear regression to a real-world dataset?
Before applying linear regression, check four things. First, confirm the relationship between variables is actually linear. Second, test that residuals are normally distributed. Third, verify there is no multicollinearity among your predictors. Fourth, check for homoscedasticity—residual variance should be constant across all values. Violating these assumptions doesn't always break the model, but it makes your predictions and coefficients unreliable.
How do you determine the optimal number of clusters in unsupervised learning when ground truth labels are unavailable?
Use the elbow method on within-cluster sum of squares—look for where adding clusters stops reducing variance meaningfully. The silhouette score gives a cleaner signal: it measures how well each point fits its own cluster versus others. For density-based methods like DBSCAN, cluster count emerges from the data itself. There is no single right answer; pick the method that matches your algorithm and business context.
What distinguishes L1 regularization from L2 regularization in terms of feature selection and model sparsity?
L1 regularization adds the absolute value of coefficients as a penalty. This drives some coefficients exactly to zero, effectively performing feature selection. L2 adds the squared value, shrinking all coefficients but rarely eliminating any. Use L1 when you suspect only a few features matter. Use L2 when most features contribute and you want to reduce their magnitude without discarding them.
How does the bias-variance tradeoff influence the choice between a simple interpretable model and a complex black-box model?
High bias means the model is too simple and underfits the data. High variance means it fits training data too well and fails on new data. A simple model is easier to explain and audit but may miss real patterns. A complex model captures more but is harder to trust and debug. The right choice depends on your data volume, interpretability requirements, and how much prediction error is acceptable.
What techniques can effectively handle class imbalance in binary classification problems beyond simple oversampling?
Beyond oversampling, try cost-sensitive learning—assign higher misclassification penalties to the minority class. SMOTE generates synthetic minority samples rather than duplicating existing ones. Threshold adjustment on predicted probabilities often helps more than resampling. Precision-recall curves are more informative than accuracy for imbalanced problems. Ensemble methods like balanced random forests also handle skew well at the algorithm level.
How does the curse of dimensionality affect distance-based algorithms like K-Nearest Neighbors in high-dimensional feature spaces?
As dimensions increase, all data points become roughly equidistant from each other. This breaks distance-based algorithms like K-Nearest Neighbors because nearness loses meaning. The model can no longer reliably identify true neighbours. The fix is dimensionality reduction—PCA or feature selection—before applying distance-based methods. As a rule, reduce dimensions aggressively when feature count exceeds sample count by a large margin.
What are the practical differences between bagging and boosting ensemble methods in terms of error reduction strategies?
Bagging builds multiple models in parallel on random data subsets and averages their outputs—this reduces variance. Boosting trains models sequentially, each correcting the errors of the previous one—this reduces bias. Random Forest is the classic bagging example; Gradient Boosting is the boosting equivalent. Use bagging when your model overfits. Use boosting when it underfits. Both improve on a single model, but through opposite mechanisms.


