

 0 Comment
 Customer Reviews

The task list is done. Nobody's assigned anything yet.
It's sitting there—twenty items, three deadlines, one team—and somehow nobody's sure who owns what. Not because people don't want to work. Because the gap between "we need to do this" and "you specifically are doing this" is where most workload conversations quietly die.
Teams don't fall apart over bad ideas. They fall apart over bad distribution. One person drowns while another wonders what to pick up next. The project manager knows this. They've seen it. But knowing the problem and presenting it clearly are two different things.
There's a specific discomfort in running a capacity planning meeting when you don't have a clear picture. You can feel it—someone's obviously overloaded, someone else has bandwidth, and the calendar keeps moving. The team productivity conversation gets awkward fast when nobody can see the same data at the same time.
And the stakes aren't just operational. Getting task allocation wrong affects morale, not just output. The person carrying too much eventually stops raising their hand. The person without enough starts feeling invisible. Both are losses the org doesn't immediately measure but eventually pays for.
Work scheduling and work assignment don't fix themselves. Someone has to stand up in front of a team, show the distribution, and make the case for rebalancing. That's where most managers get stuck—not in knowing what to do, but in finding a clean way to show it.
That's exactly why workload distribution templates exist. Not because the problem is new—it isn't. But because structuring what you already know into something a room full of people can read in thirty seconds is genuinely hard without a starting point.
SlideTeam's pre-designed workload distribution templates handle the structure. You bring the data and the context; the slides already have the frameworks, the dashboards, and the visual layouts that make the conversation easier to have. Content-ready slides that get you past the blank-slide problem.
Here are the templates that make the biggest difference.
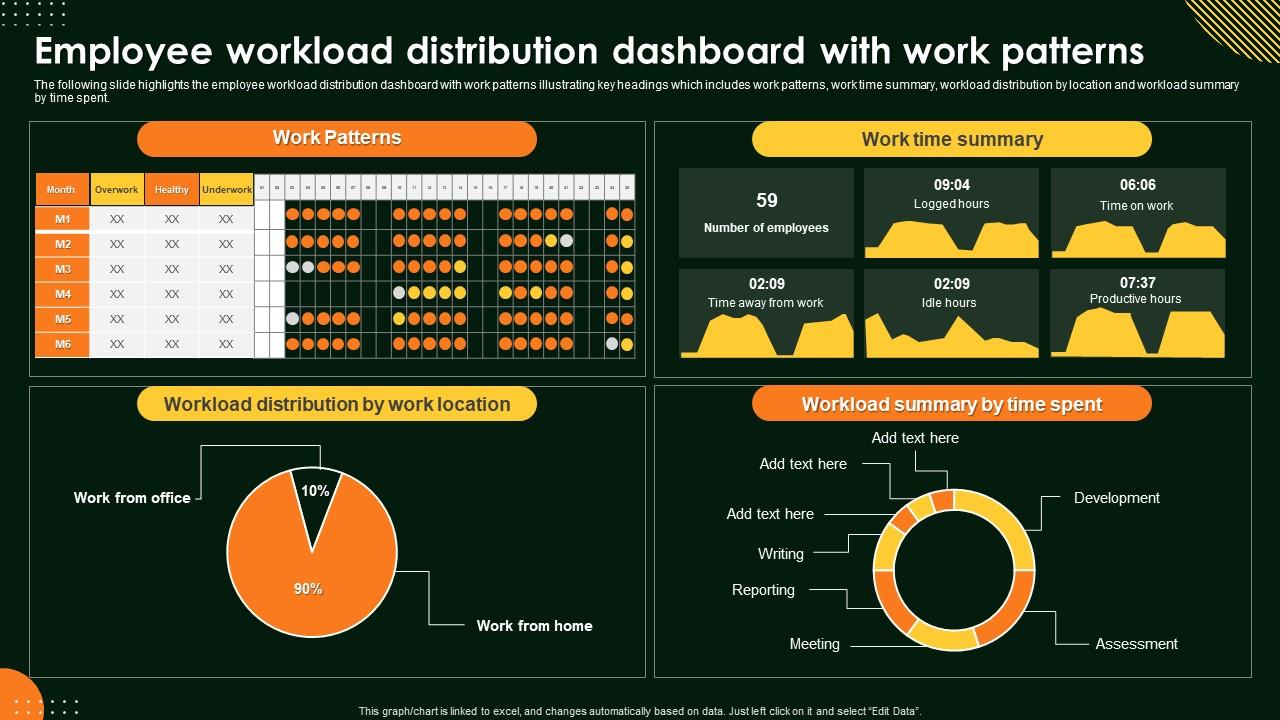
Template 1: Employee Workload Distribution Dashboard with Work Patterns
Commanding visibility into employee workload starts with one unified dashboard. This deck merges work patterns, time summaries, and location-based distribution into a single, scannable view. Location-level workload breakdowns give managers instant clarity on where pressure is concentrated. Time-spent summaries reveal how hours are actually allocated across the team. You gain the structured overview needed to rebalance assignments before problems escalate. Elevate your workload management reviews with data that speaks for itself. Download this dynamic dashboard template now and unlock real-time clarity on your team's work patterns.
Download this PowerPoint Template
Template 2: Workload Distribution Techniques Tailored to Employees PPT Example
Engaging your audience on task allocation requires more than a list—it demands visual logic. This deck transforms workload distribution techniques into compelling, structured slides your team actually follows. Each layout drives clarity on how tasks should be tailored to individual employee capacity. Strong visual hierarchies make complex distribution frameworks easy to grasp at a glance. You can align every slide to your brand and present with confidence in any setting. Transform your task management presentations with professional, audience-ready designs. Download this dynamic template now and unlock smarter workload conversations with your team.
[product_image id=1745431]
Template 3: Balancing Workload Best Practices for Work Distribution PPT Designs
Getting work balance right is harder than it looks, especially at scale. This PPT preset is built for operations leads and HR managers who need to show best practices without burying the audience in text. It covers work distribution approaches in a clean, digestible format. Use it for workforce planning sessions or team leads reviewing capacity. The template is 100% editable and customizable.
[product_image id=1505837]
Template 4: Prioritizing Tasks for Optimal Workload Distribution PPT Information
Clarity on work prioritization is what separates reactive teams from focused ones. This deck captures the logic of optimal workload distribution through structured, visually rich layouts. Each slide translates prioritization frameworks into clear, actionable visuals your audience can immediately apply. The design adapts to any project management context—sprint planning, resource reviews, or capacity briefings. You get a polished presentation that makes the case for smarter task distribution. Transform your prioritization discussions with slides built for impact. Download this template now and unlock a sharper approach to work assignment across your team.
[product_image id=1746075]
Template 5: Employee Workload Distribution Dashboard with Work Patterns PPT Sample
Dashboards only work when they're readable in seconds. This PPT template is built for managers who need to present employee workload patterns without losing the room to a wall of numbers. It covers distribution by time, location, and summary metrics in one coherent layout. Useful for weekly operations reviews or capacity planning check-ins. The template is 100% editable and customizable.
[product_image id=1471418]
Template 6: Resource Allocation and Utilization Metrics PPT Designs
Tracking resource allocation without clear metrics is just guesswork. This PPT preset gives practitioners a structured way to present utilization data across teams or projects. It suits resource managers and project leads presenting to stakeholders who need numbers, not narratives. Use it to flag underutilization or flag capacity gaps before they affect delivery. The template is 100% editable and customizable.
[product_image id=1553143]
Template 7: Workforce Optimization Techniques PPT Sample
Workforce optimization conversations need more than intent—they need a clear visual case. This deck is for operations managers presenting load balancing approaches to leadership or team leads. It frames workforce planning techniques in a format that moves discussions forward rather than stalling them. Pair it with workload distribution examples and samples for a complete presentation package. The template is 100% editable and customizable.
[product_image id=1518057]
Template 8: Workload Management Evaluating Distribution among Employees
Evaluating how workload is spread across employees requires more than a headcount chart. This slide is designed for HR leads and project managers who need to present distribution gaps clearly. Ten structured slides let you walk through team workload data without losing the audience. It suits performance review meetings or team retrospectives focused on work efficiency. The template is 100% editable and customizable.
[product_image id=395635]
Template 9: Workload Distribution Strategies for Teams PPT Demonstration
Team-level workload distribution is one of the harder things to present without sounding like you're assigning blame. This PPT preset gives project managers a neutral, structured format for that conversation. It frames work delegation across teams in a way that invites problem-solving rather than defensiveness. Good for sprint retrospectives, resource rebalancing sessions, or cross-team coordination reviews. The template is 100% editable and customizable.
[product_image id=1518058]
Template 10: Workload Distribution and Team Collaboration PPT Graphics
When workload distribution and team collaboration intersect, clarity matters most. This PPT preset is built for team leads who need to show how work is shared and where coordination gaps exist. It supports project resource allocation reviews and cross-functional planning sessions equally well. The visual layouts make it easier for any audience to see who owns what. The template is 100% editable and customizable.
[product_image id=1550282]
Template 11: Resource Allocation and Workload Distribution Summary PPT Slides
A strong summary slide can change the outcome of a resource review. This deck captures both allocation and workload distribution data in a clean, executive-ready format. Each layout translates raw resource data into visuals that drive decisions, not just discussion. The structured summary view makes it easy to present capacity gaps and utilization rates together. Use this for project wrap-ups, resource planning reviews, or team performance briefings. Transform your resource allocation presentations with slides built for leadership audiences. Download this template now and unlock a sharper way to present workload and capacity data.
[product_image id=1553144]
Template 12: Balancing Production Rate and Machine Failure PPT Mockup
Production planning gets complicated fast when machine failure disrupts output targets. This PPT slide is built for operations managers presenting the trade-off between production rate and downtime risk. It gives manufacturing and process leads a structured way to show balancing decisions to leadership. Useful for capacity planning reviews or operational risk briefings in production environments. The template is 100% editable and customizable.
[product_image id=1617656]
Template 13: Balancing Work-Life with Optimal Workload Distribution
Work-life balance conversations rarely happen without data to back them up. This deck is for HR managers and team leads making the case that workload distribution directly affects employee wellbeing. It presents the connection between how work is assigned and how sustainable that assignment actually is. A practical choice for people-ops reviews or management training sessions on work balance. The template is 100% editable and customizable.
[product_image id=1617657]
Template 14: Analyzing System Bottlenecks Using Data Flow Effectively PPT
System bottlenecks don't announce themselves—data flow analysis reveals them. This deck empowers IT leads and operations analysts to present bottleneck diagnostics with clarity and precision. Visual data flow layouts make complex system dependencies immediately readable for any audience. Each slide drives the conversation from problem identification toward actionable resolution. Use this for architecture reviews, process audits, or workflow optimization briefings. Transform your system analysis presentations with designs that cut through the noise. Download this template now and unlock a sharper way to communicate data flow bottlenecks.
[product_image id=1729496]
Template 15: Tools to Optimize Workload Distribution Efficiency PPT Demonstration
Choosing the right tools for workload distribution efficiency requires making the case visually. This deck delivers structured layouts that present tool comparisons and optimization approaches. Each slide focuses audience attention on outcomes—faster assignment, fewer bottlenecks, better work coordination. Strong visual framing makes even technical tooling decisions accessible to non-specialist stakeholders. Use this for vendor reviews, operations planning, or team tooling discussions. Transform your workflow optimization presentations with slides designed for decision-makers. Download this template now and unlock a confident way to present workload efficiency tools.
[product_image id=1663856]
Template 16: Cost Efficient Workload Distribution in Multi Cloud PPT Presentation
Multi-cloud workload distribution is a cost decision as much as a technical one. This PPT preset is for IT architects and cloud ops leads presenting cost-efficiency trade-offs to finance or leadership teams. It structures the conversation around where workloads sit and what that placement costs. A clear choice for cloud governance reviews or infrastructure planning sessions. The template is 100% editable and customizable.
[product_image id=1794640]
Template 17: Workload Automation Data Pipelines PPT Structure
Automating data pipelines removes the manual overhead that slows workload management down. This deck drives clarity on workload automation architecture for technical leads presenting to mixed audiences. Each layout translates pipeline logic into visuals that non-technical stakeholders can follow. Use it for data engineering reviews, IT roadmap presentations, or automation planning sessions. The structural framing makes pipeline decisions look straightforward on screen. Transform your automation presentations with designs built for technical and executive audiences alike. Download this template now and unlock a cleaner way to present data pipeline workflows.
[product_image id=1717895]
Template 18: Prioritizing Risks for Better Control and Mitigation Outcomes PPT Information
Risk prioritization is only useful when decision-makers can see the logic clearly. This deck empowers risk leads and project managers to present mitigation frameworks with precision and authority. Each layout moves the audience from risk identification to ranked, actionable control measures. The visual hierarchy makes it easy to distinguish high-priority risks from lower-order concerns. Use this for risk review committees, project governance meetings, or compliance briefings. Transform your risk management presentations with slides that drive confident decisions. Download this template now and unlock a sharper approach to risk prioritization and control.
[product_image id=1746074]
Template 19: Workforce Upskilling Strategies for Future Digital Economy PPT Graphics
Preparing a workforce for the digital economy requires more than a training calendar. This deck empowers L&D leads and HR directors to present upskilling strategies with structure and conviction. Each slide connects workforce planning decisions to concrete digital competency outcomes. Strong visual frameworks make it easy to show leadership where investment in skills pays off. Use this for talent strategy reviews, board-level HR presentations, or workforce development planning sessions. Transform your upskilling conversations with slides built for executive-level impact. Download this template now and unlock a compelling way to present future-ready workforce strategies.
[product_image id=1745430]
Template 20: Tools and Techniques for Effective Workload Distribution
Effective workload distribution starts with having the right tools and techniques clearly mapped. This deck delivers structured layouts that present both the methods and the tools for managing task distribution across teams. Each slide builds a complete picture—from assignment frameworks to coordination approaches—for any management audience. Use this for team leads, operations managers, or project directors presenting work efficiency improvements. The content-ready structure means you spend less time formatting and more time on the conversation. Transform your workload management presentations with slides that cover the full distribution picture. Download this template now and unlock a practical framework for smarter work assignment.
[product_image id=1522630]
Elevate Your Team's Workload Distribution with SlideTeam
SlideTeam's PowerPoint templates are the best in the industry for workload distribution presentations. These content-ready slides give you the visual structure to communicate task allocation, capacity planning, and resource distribution clearly and confidently. Use these ready-made PowerPoint slides to turn complex team workload data into decisions your leadership and operations teams can act on. Deploy these templates today to drive better work balance, smarter delegation, and measurable team productivity.
FAQs on Workload Distribution
How can presentation templates be designed to visually represent unequal workload distribution across team members?
Use a horizontal bar chart per team member, with task volume or hours on the x-axis. Color intensity or a second data series can show overload thresholds. Side-by-side comparison makes inequality visible without explanation. Keep the chart to one slide and let the visual do the work — avoid tables for this purpose.
What metrics should be included in a workload distribution dashboard slide to provide actionable insights?
Include task count per person, hours allocated versus hours available, completion rate, and overdue items. These four metrics cover volume, capacity, output, and risk. Add a team-level summary row at the top. Anything beyond this tends to obscure rather than inform — keep it to what a manager can act on in a meeting.
How does color-coding in presentation slides help managers quickly identify overloaded versus underutilized team members?
Color-coding works because it bypasses reading entirely — red signals overload, green signals availability, yellow signals caution. Managers scan rather than read in meetings. A consistent, simple three-color key applied to a team grid lets anyone in the room identify imbalances in under ten seconds, without needing to interpret numbers.
Which chart types most effectively communicate workload imbalances during executive presentations?
Stacked bar charts show total load by person with task-type breakdown. Heat maps work well for showing distribution across time periods. Treemaps are useful when team size is large. For executive audiences, keep it to one chart type per slide — mixing formats in a single view tends to confuse rather than clarify.
How can Gantt chart templates be adapted to show real-time workload shifts across project phases?
Add a second row beneath each task bar showing assigned resource, and use conditional formatting to flag overloaded periods in red. Group tasks by project phase on the y-axis. For real-time shifts, include a 'last updated' timestamp and a delta indicator showing changes from the prior version. Keep the timeline view to a single sprint or phase — longer windows lose clarity fast.
What role do swimlane diagrams play in presenting cross-functional workload distribution strategies?
Swimlane diagrams map tasks horizontally by team or function, making handoffs and gaps immediately visible. They answer the question 'who does what and when' across departments without a long explanation. For workload distribution, each lane's density tells the story — a crowded lane versus a sparse one makes the imbalance obvious at a glance.
How should workload distribution slides differ when presenting to operational teams versus C-suite stakeholders?
Operational teams need task-level detail — who owns what, by when, and with what dependencies. C-suite audiences need the summary: utilization rates, risk flags, and resource gaps by function. Two separate slide sets work better than one deck trying to serve both. Lead with the business impact for executives; lead with the action list for operations.
What visual frameworks best illustrate the relationship between skill sets and workload allocation in a team?
A skills matrix grid — with team members on one axis and required skills on the other — is the clearest starting point. Overlay task assignment volume as a cell value or color fill. This immediately shows who is assigned work matching their skills and who is not. Bubble charts can also work for larger teams, sizing each bubble by task volume per skill category.