Building an effective brand strategy to attract customers powerpoint presentation slides
Building a strong and consistent brand is now a top priority for both small and large enterprises. One of the primary focuses of organizations is developing the right brand strategy aligned with business objectives, which is where this presentation comes in handy. Our presentation will be beneficial to the businesses that want to evaluate their current performance compared to their competitors and introduce a new brand into the market. The presentation is divided into three phases. The first phase highlights the business performance, and companies can use this section to address their year over year growth, website traffic, sales performance, revenue generation, along market share details. The second phase displays the information about competitive landscape analysis, and companies can use this section to show information about their major rivals. This section includes a competitive analysis based on the companys performance, product features, and pricing strategies. The third phase consists of establishing business goals for growth and selecting a brand development strategy to achieve those goals. Companies can use the new brand development strategy section to provide information about their brands vision, mission, objectives, mantra, and tagline, as well as details about their target market, value proposition, and brand positioning. Sections follow the new brand development strategy section. Namely, product attributes and pricing strategy, as well as building new brand awareness. Companies can use these sections to address their product attributes, pricing strategy, and communication plan. The market share projections will help the company evaluate its business performance after introducing a new brand in the market. Finally, the dashboard section will assist businesses in monitoring and tracking the performance of their business as well as campaigns promising next level satisfaction with this effective brand strategy PowerPoint template.
- Google Slides is a new FREE Presentation software from Google.
- All our content is 100% compatible with Google Slides.
- Just download our designs, and upload them to Google Slides and they will work automatically.
- Amaze your audience with SlideTeam and Google Slides.
-
Want Changes to This PPT Slide? Check out our Presentation Design Services
- WideScreen Aspect ratio is becoming a very popular format. When you download this product, the downloaded ZIP will contain this product in both standard and widescreen format.
-

- Some older products that we have may only be in standard format, but they can easily be converted to widescreen.
- To do this, please open the SlideTeam product in Powerpoint, and go to
- Design ( On the top bar) -> Page Setup -> and select "On-screen Show (16:9)” in the drop down for "Slides Sized for".
- The slide or theme will change to widescreen, and all graphics will adjust automatically. You can similarly convert our content to any other desired screen aspect ratio.
Compatible With Google Slides

Get This In WideScreen
You must be logged in to download this presentation.
PowerPoint presentation slides
Deliver this complete deck to your team members and other collaborators. Encompassed with stylized slides presenting various concepts, this Building An Effective Brand Strategy To Attract Customers Powerpoint Presentation Slides is the best tool you can utilize. Personalize its content and graphics to make it unique and thought provoking. All the fifty seven slides are editable and modifiable, so feel free to adjust them to your business setting. The font, color, and other components also come in an editable format making this PPT design the best choice for your next presentation. So, download now.
People who downloaded this PowerPoint presentation also viewed the following :
Content of this Powerpoint Presentation
Slide 1: This is a cover slide for Building an Effective Brand Strategy to Attract Customers PowerPoint deck.
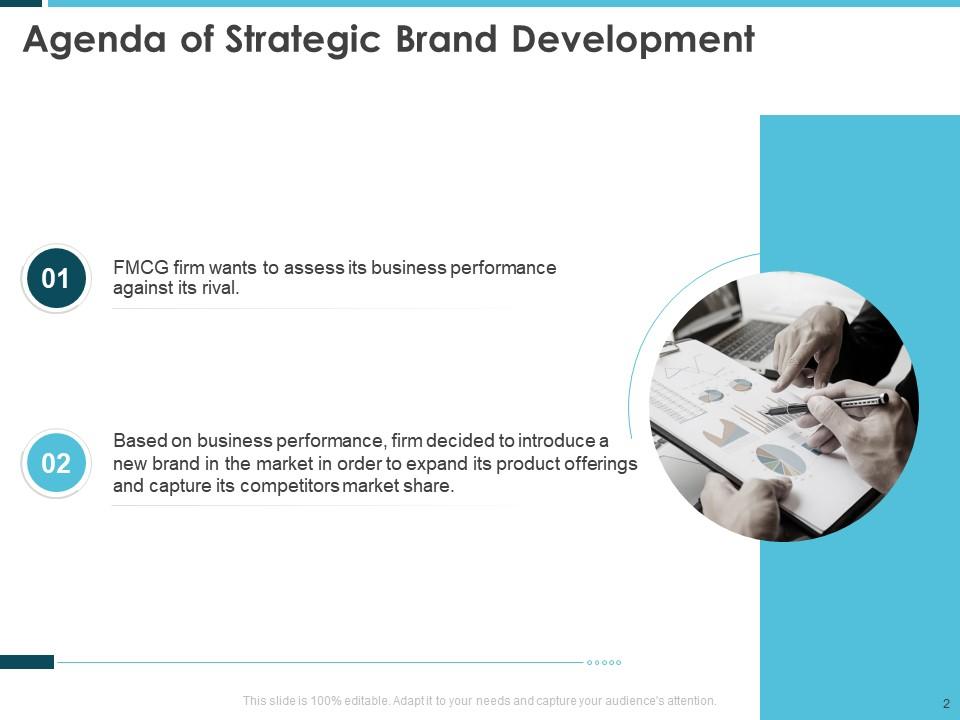
Slide 2: This is Agenda of Strategic Brand Development Slide
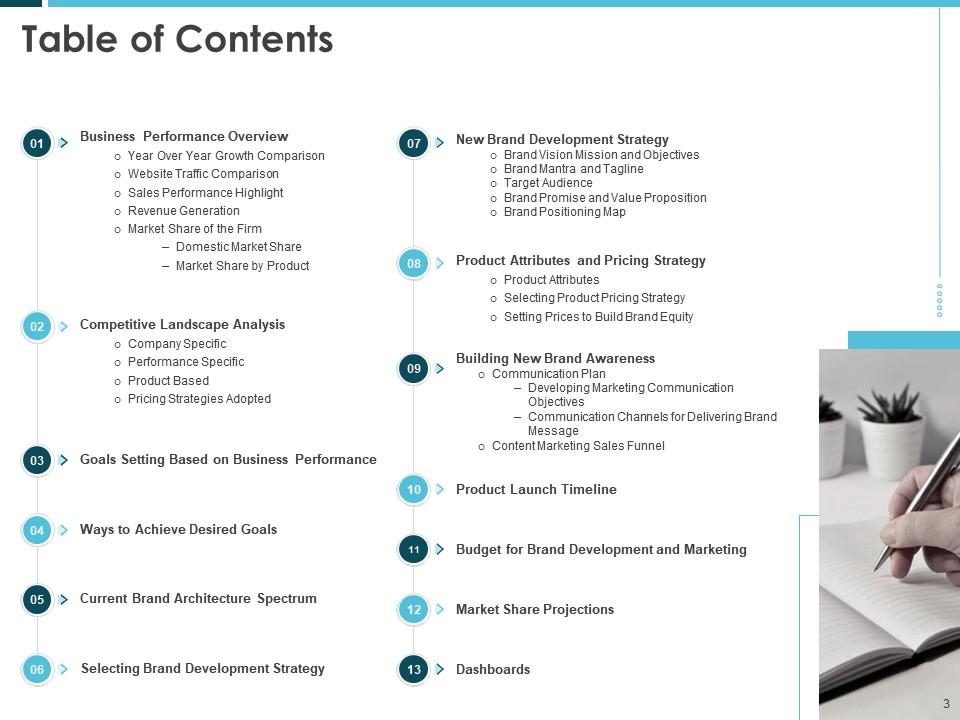
Slide 3: This is a Table of Contents slide that lists out all the elements covered in the deck.
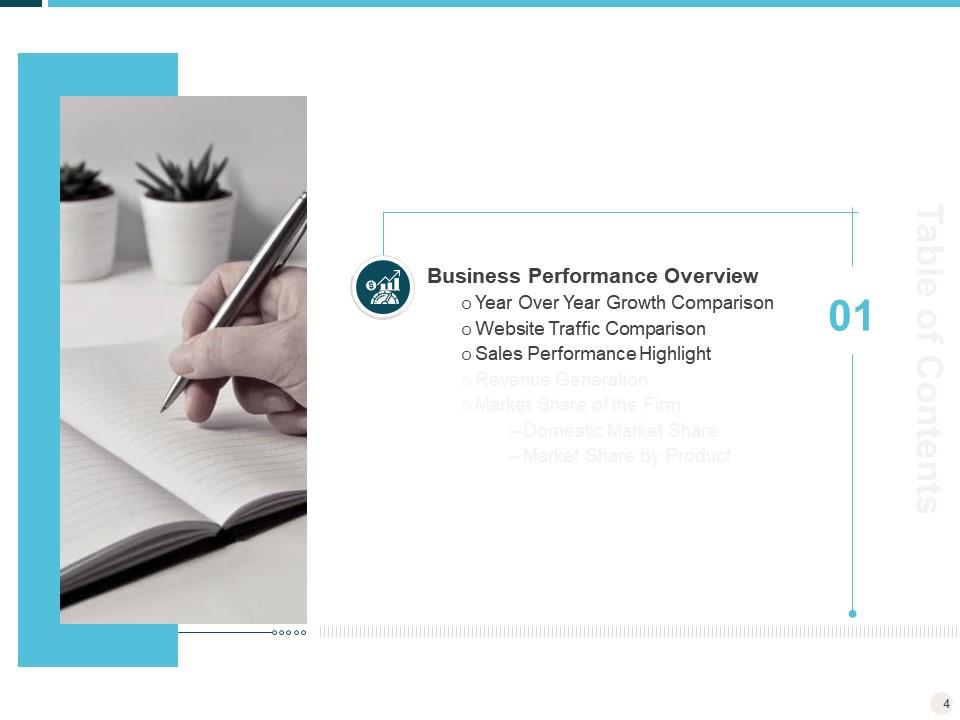
Slide 4: This slide introduces Business Performance Overview
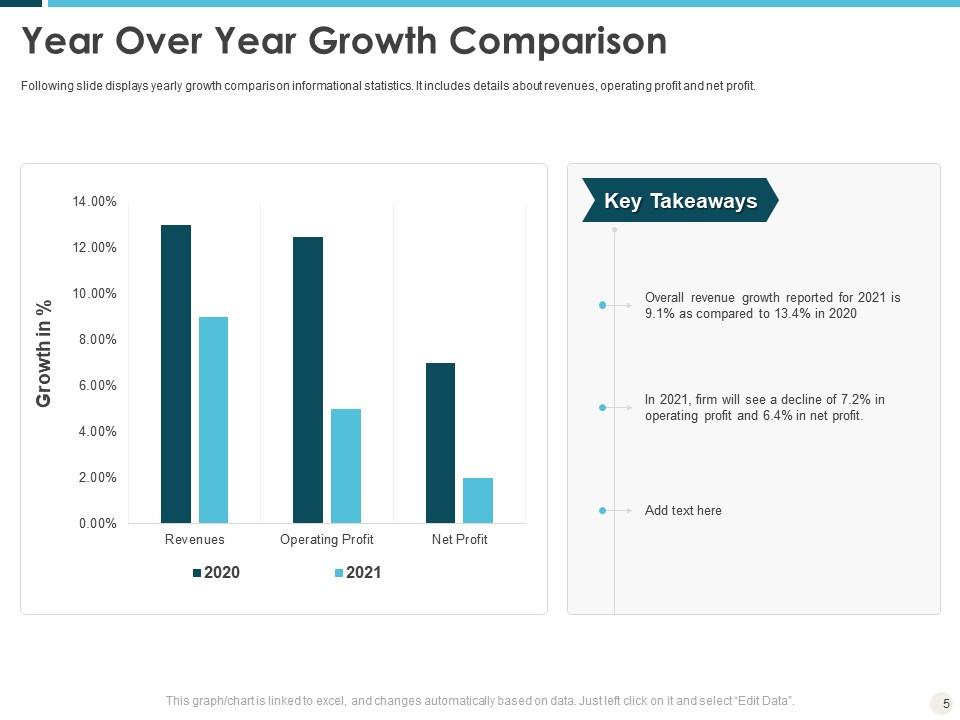
Slide 5: This slide displays yearly growth comparison informational statistics. It includes details about revenues, operating profit and net profit.
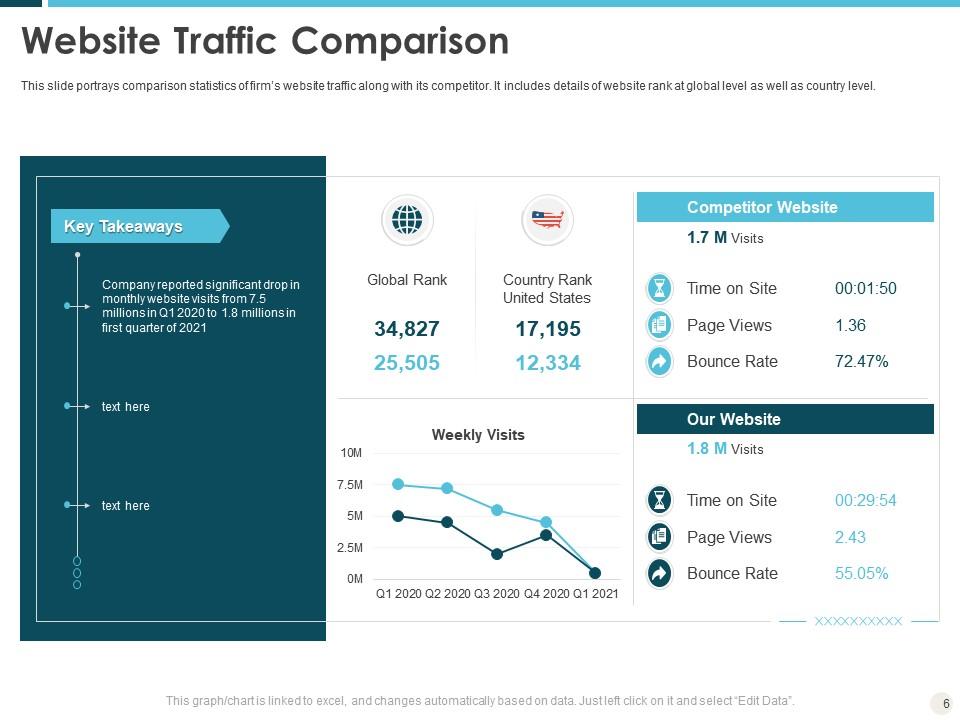
Slide 6: This slide portrays comparison statistics of firm’s website traffic along with its competitor. It includes details of website rank at global level as well as country level.
Slide 7: This slide illustrates sales performance highlight of the company in financial year 2020. It also shows the statistics of units sold across different the regions.
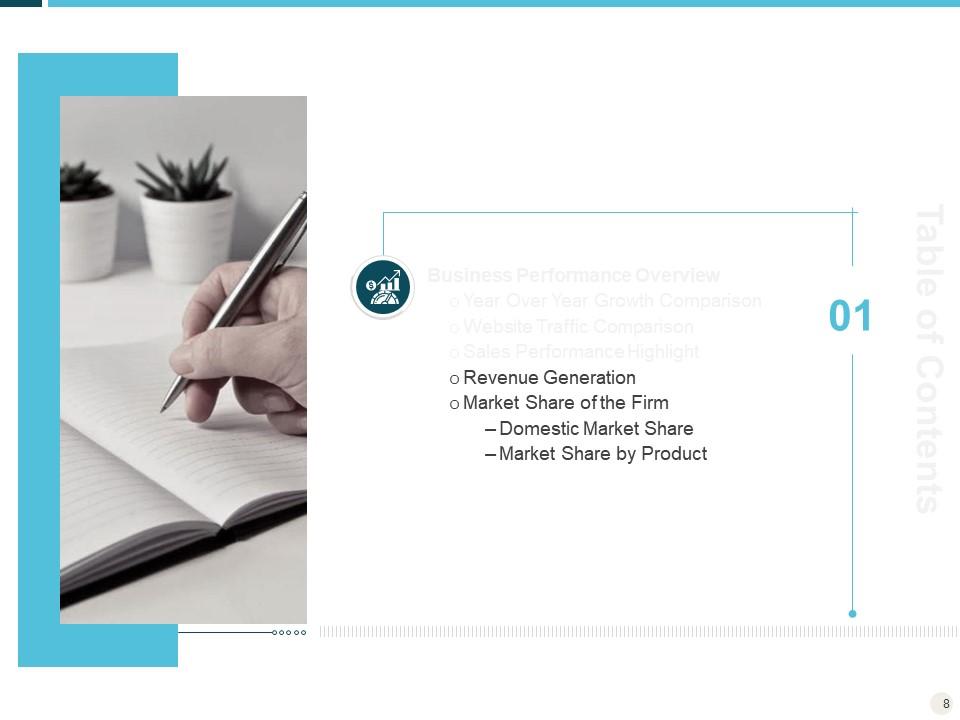
Slide 8: This slide introduces revenue generation and makret share of the firm.
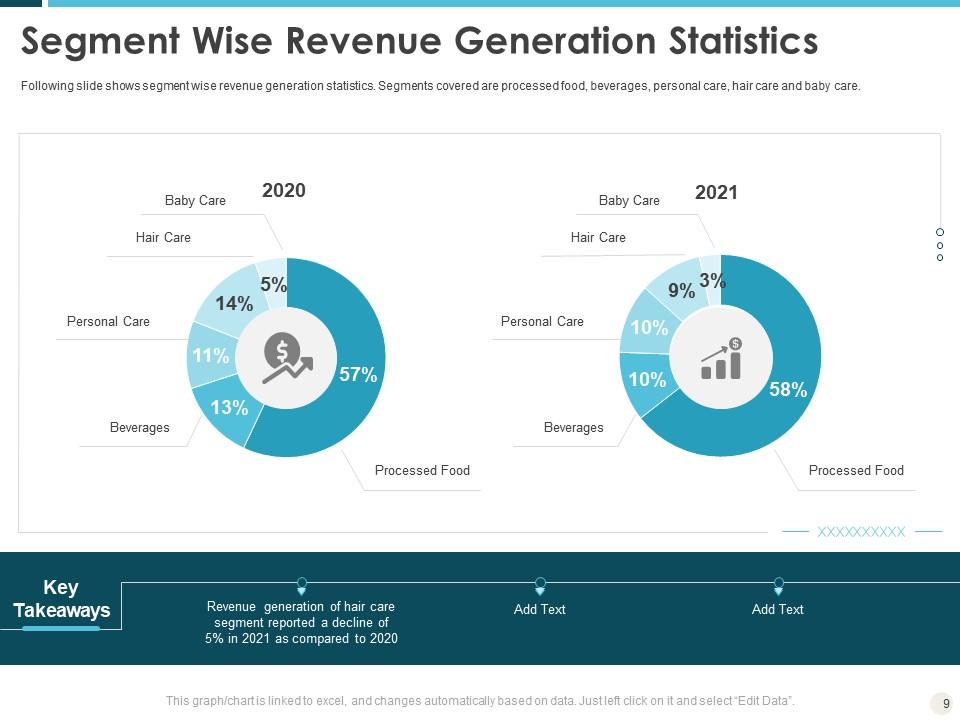
Slide 9: This slide shows segment wise revenue generation statistics. Segments covered are processed food, beverages, personal care, hair care and baby care.
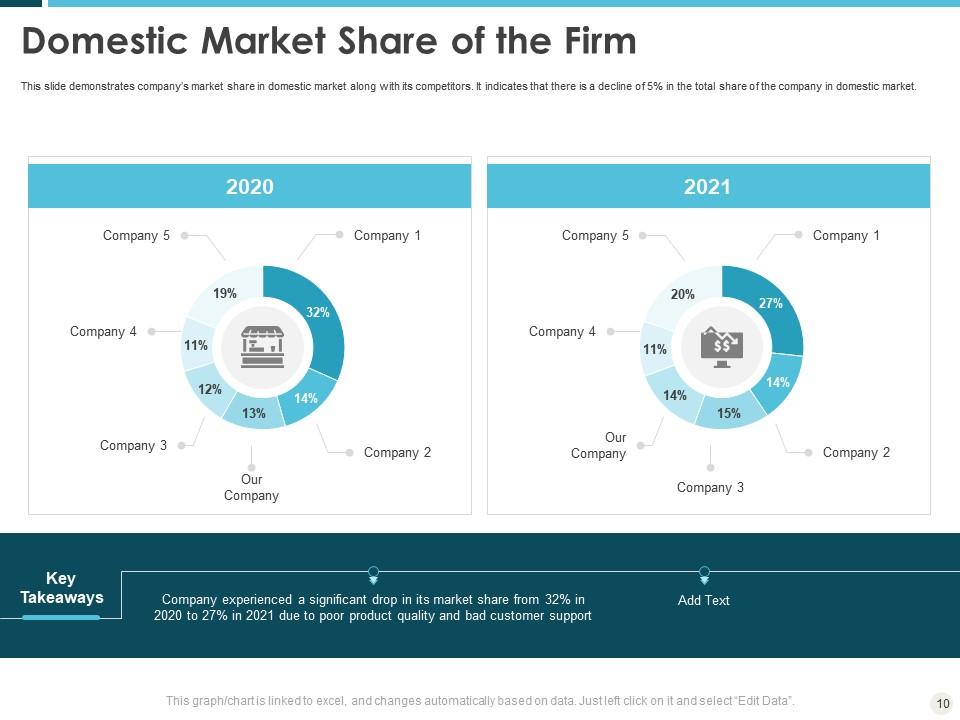
Slide 10: This slide demonstrates company’s market share in domestic market along with its competitors. It indicates that there is a decline of 5% in the total share of the company in domestic market.
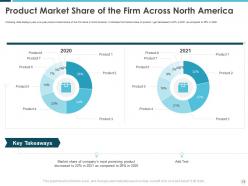
Slide 11: This slide displays year over year product market share of the firm alone in North America. It indicates that market share of product 1 get decreased to 22% in 2021 as compared to 26% in 2020.
Slide 12: This slide introduces competitive landscape analysis.
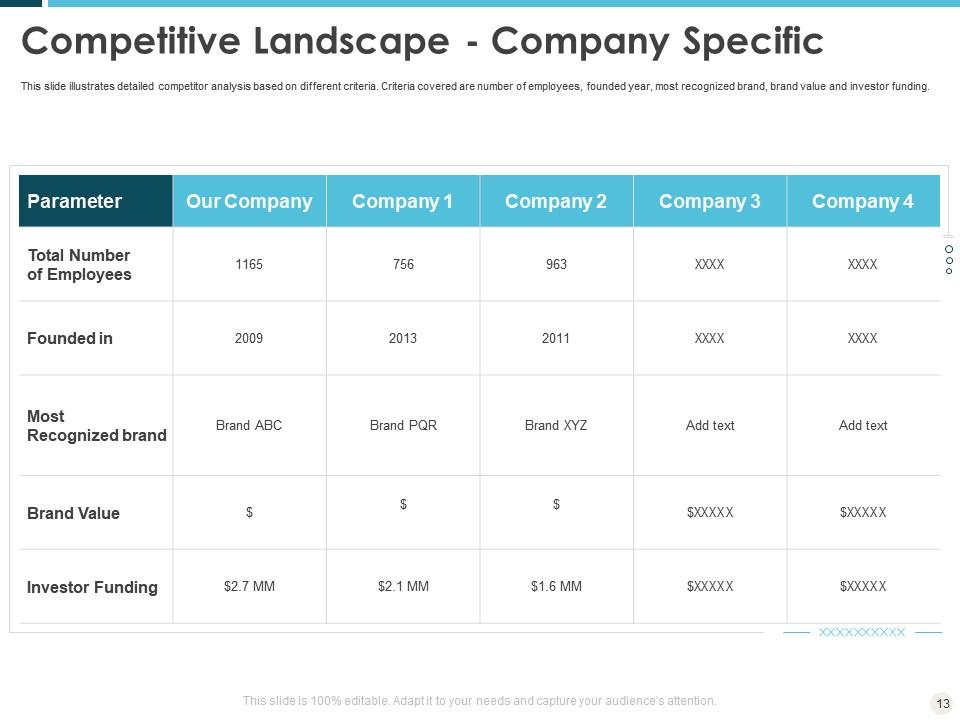
Slide 13: This slide illustrates detailed competitor analysis based on different criteria. Criteria covered are number of employees, founded year, most recognized brand, brand value and investor funding.
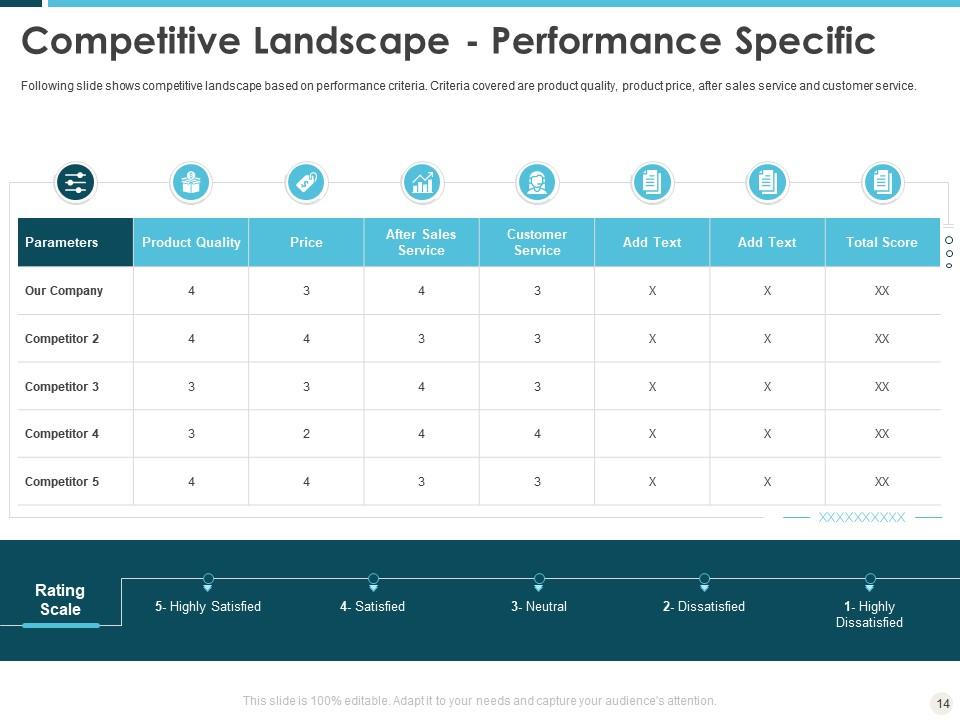
Slide 14: This slide shows competitive landscape based on performance criteria. Criteria covered are product quality, product price, after sales service and customer service.
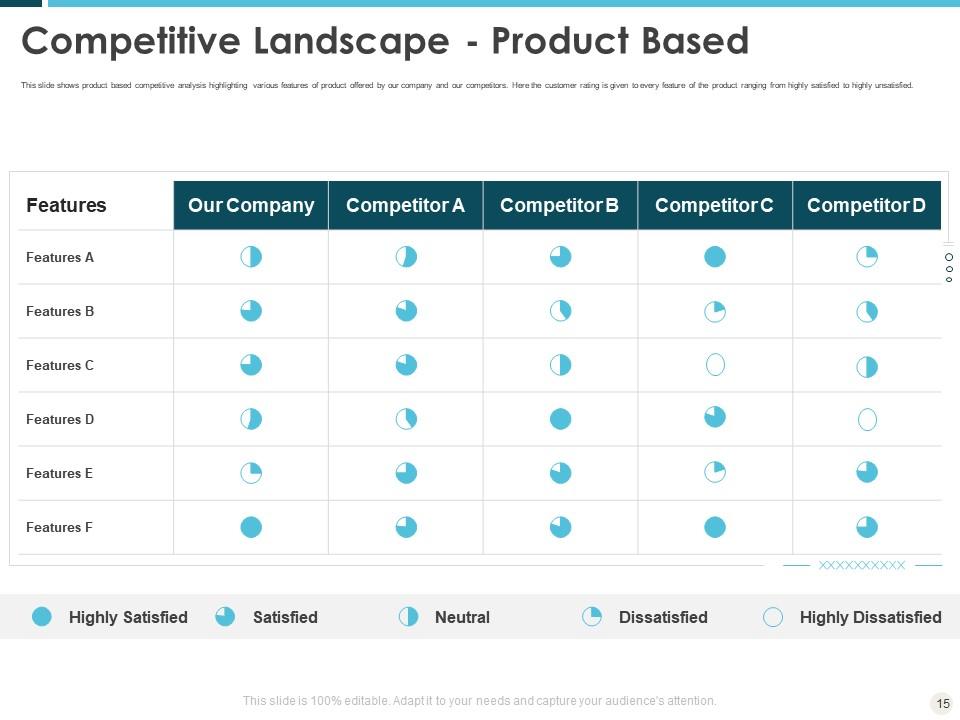
Slide 15: This slide shows product based competitive analysis highlighting various features of product offered by our company and our competitors. Here the customer rating is given to every feature of the product ranging from highly satisfied to highly unsatisfied.
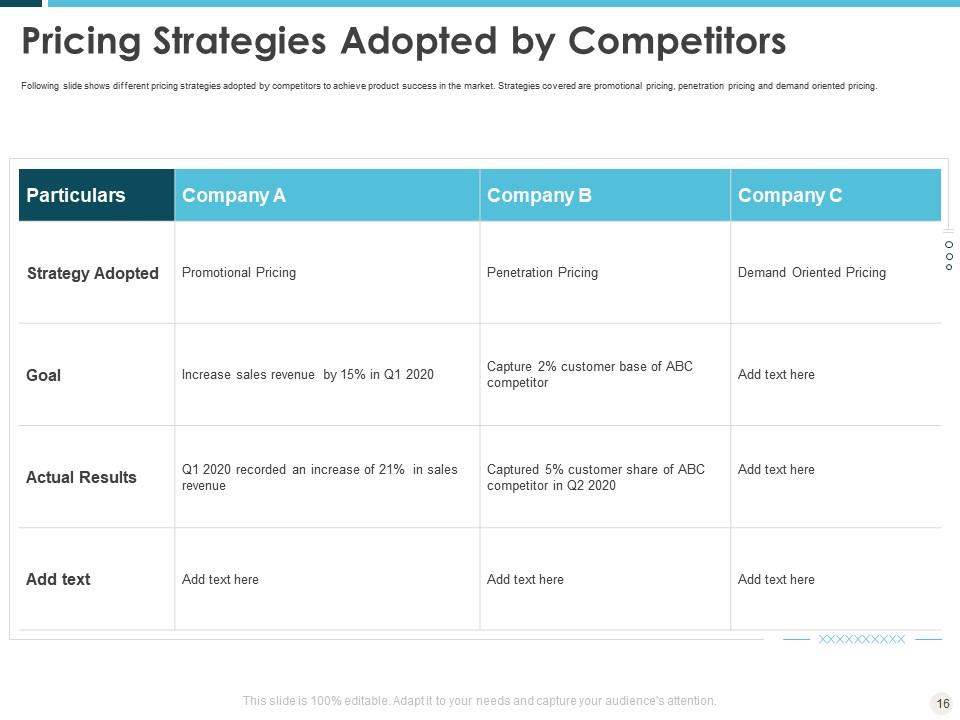
Slide 16: This slide shows different pricing strategies adopted by competitors to achieve product success in the market. Strategies covered are promotional pricing, penetration pricing and demand oriented pricing.
Slide 17: This slide introduces Goal setting based on Business Performance and the ways to achieve desired goals.
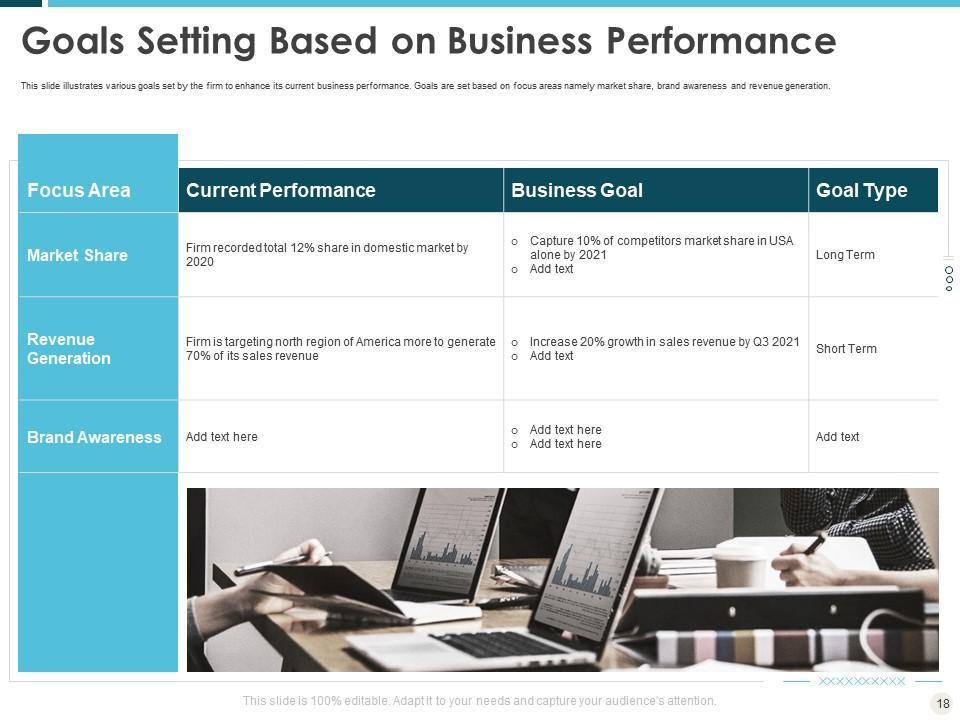
Slide 18: This slide showcases Goals Setting Based on Business Performance
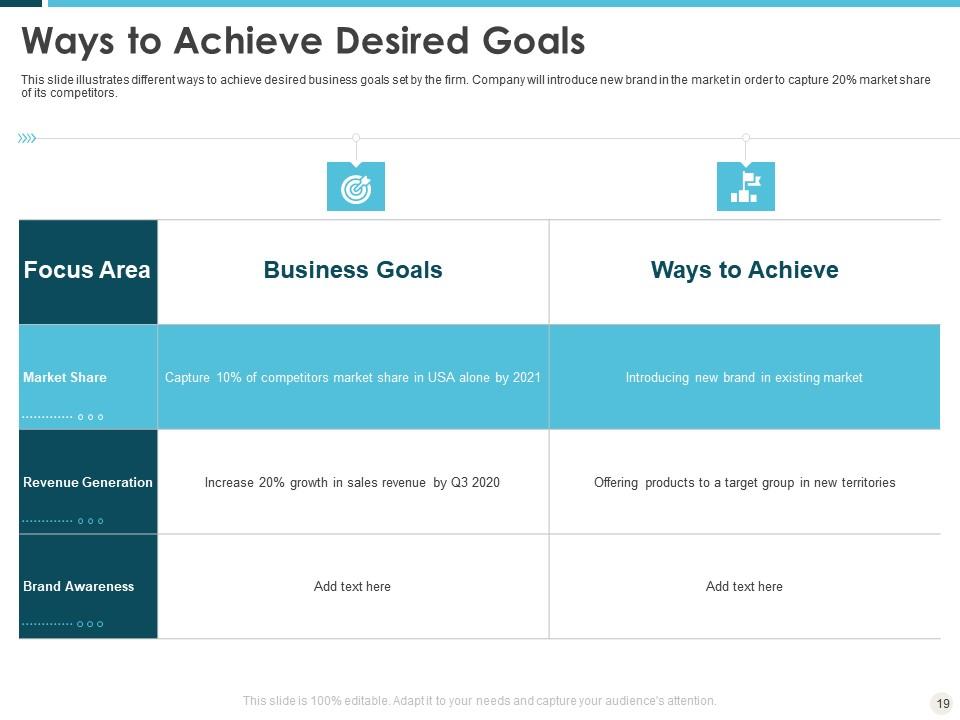
Slide 19: This slide illustrates different ways to achieve desired business goals set by the firm. Company will introduce new brand in the market in order to capture 20% market share of its competitors.
Slide 20: This slide showcases Current brand architecture spectrum and brand development strategy.
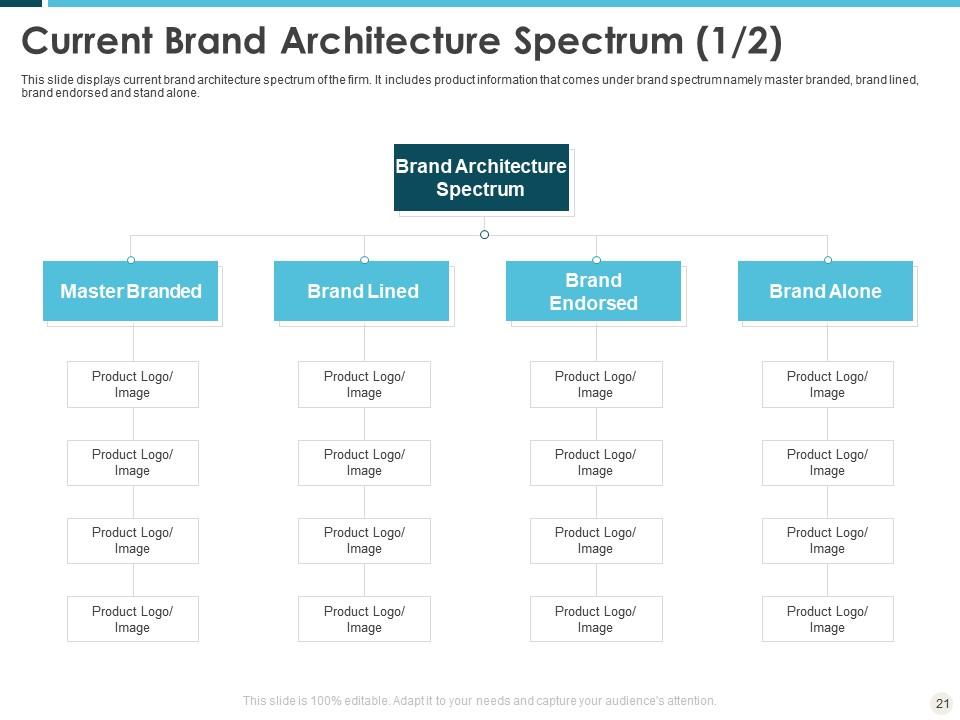
Slide 21: This slide displays current brand architecture spectrum of the firm. It includes product information that comes under brand spectrum namely master branded, brand lined, brand endorsed and stand alone.
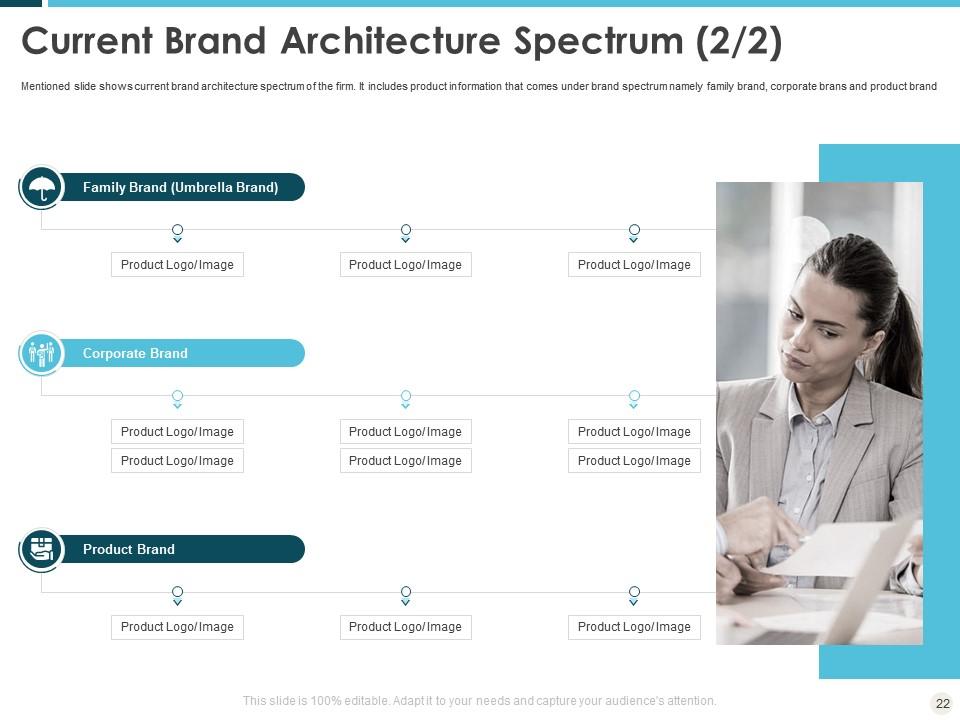
Slide 22: This slide shows current brand architecture spectrum of the firm. It includes product information that comes under brand spectrum namely family brand, corporate brans and product brand.
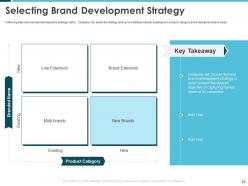
Slide 23: This slide shows brand development strategy matrix. Company can select its strategy among two attribute namely existing/new product category and existing/new brand name.
Slide 24: This slide introduces new brand development strategy
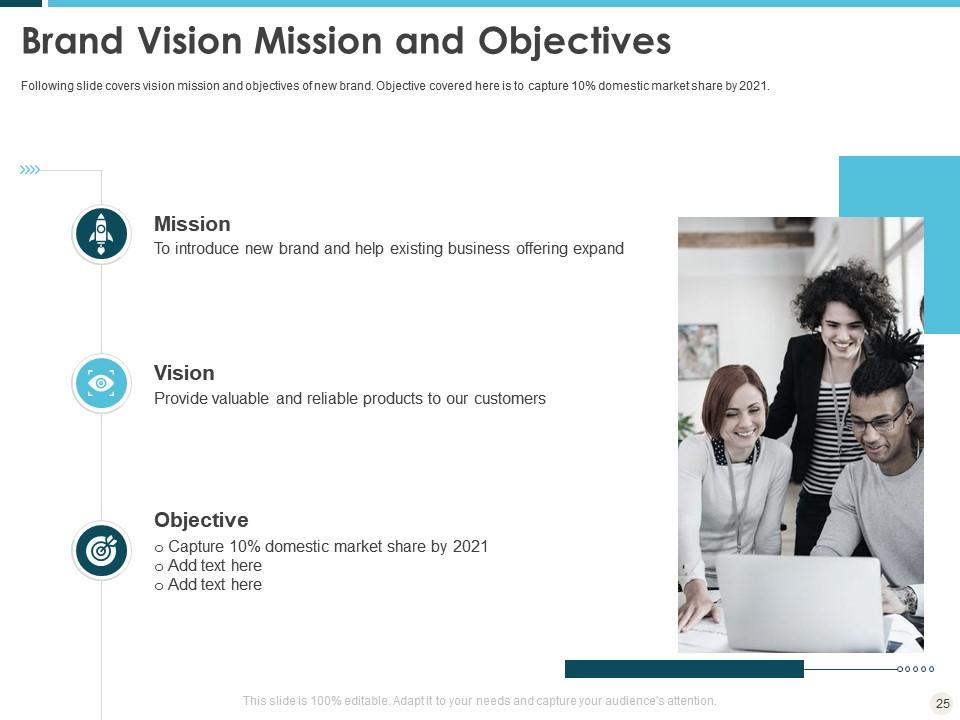
Slide 25: This slide covers vision mission and objectives of new brand. Objective covered here is to capture 10% domestic market share by 2021.
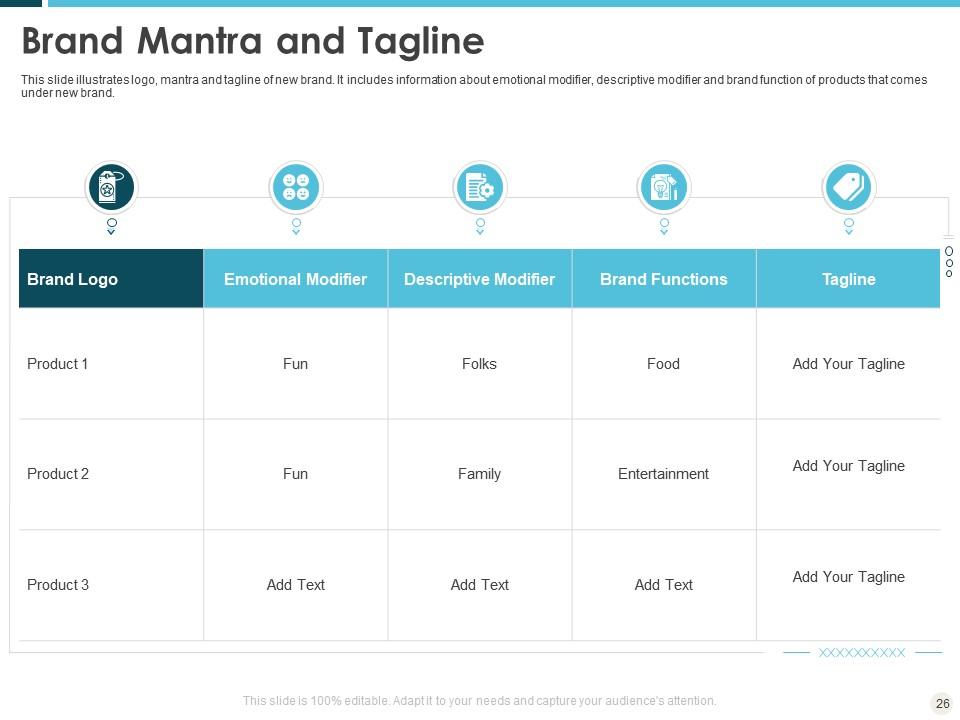
Slide 26: This slide illustrates logo, mantra and tagline of new brand. It includes information about emotional modifier, descriptive modifier and brand function of products that comes under new brand.
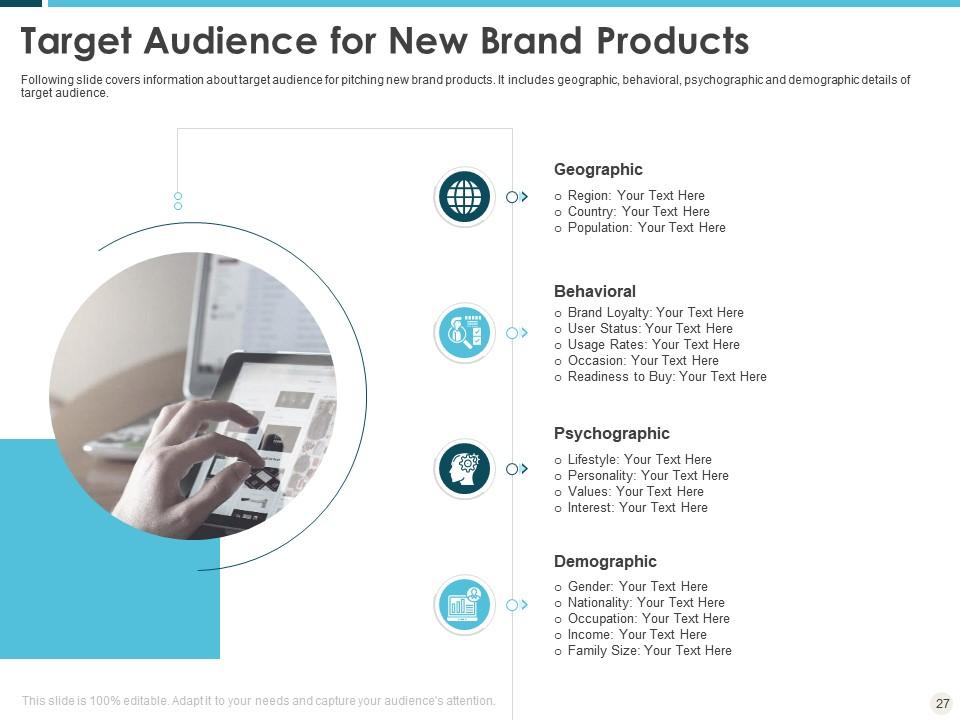
Slide 27: This slide covers information about target audience for pitching new brand products. It includes geographic, behavioral, psychographic and demographic details of target audience.
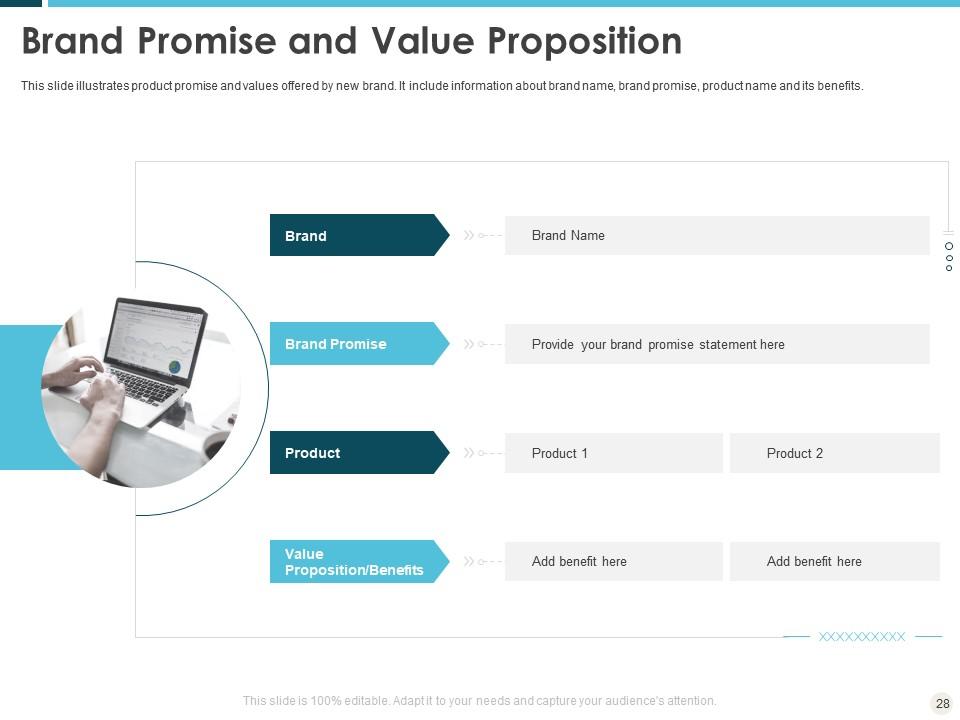
Slide 28: This slide illustrates product promise and values offered by new brand. It include information about brand name, brand promise, product name and its benefits.
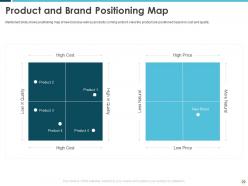
Slide 29: This slide shows positioning map of new brand as well as products coming under it. Here the product are positioned based on cost and quality.
Slide 30: This slide introduces product attributes and pricing strategy
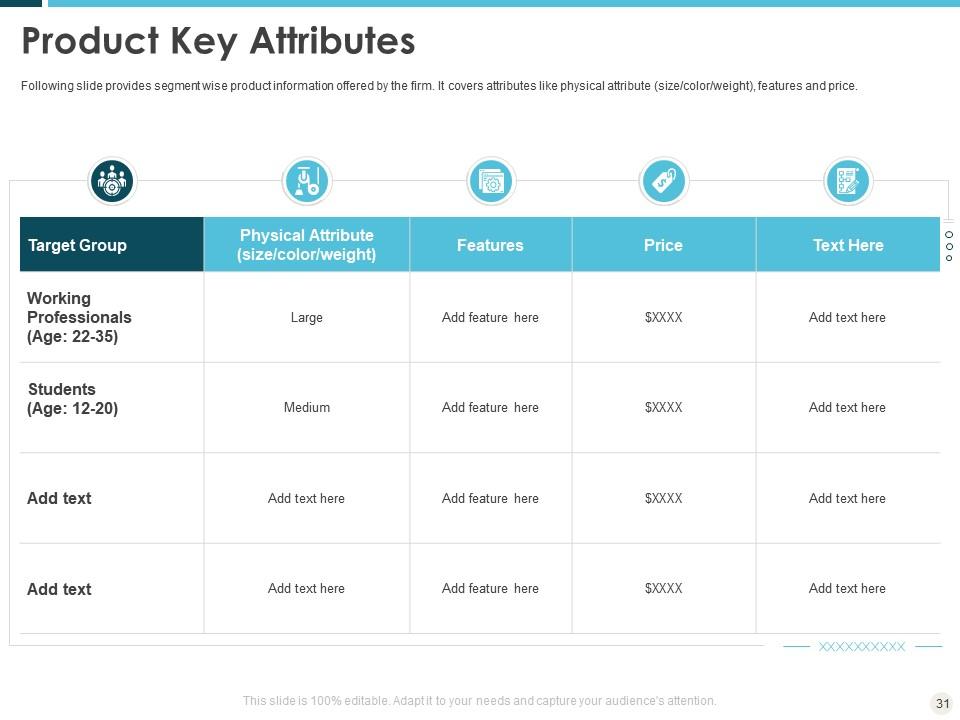
Slide 31: This slide provides segment wise product information offered by the firm. It covers attributes like physical attribute (size/color/weight), features and price.
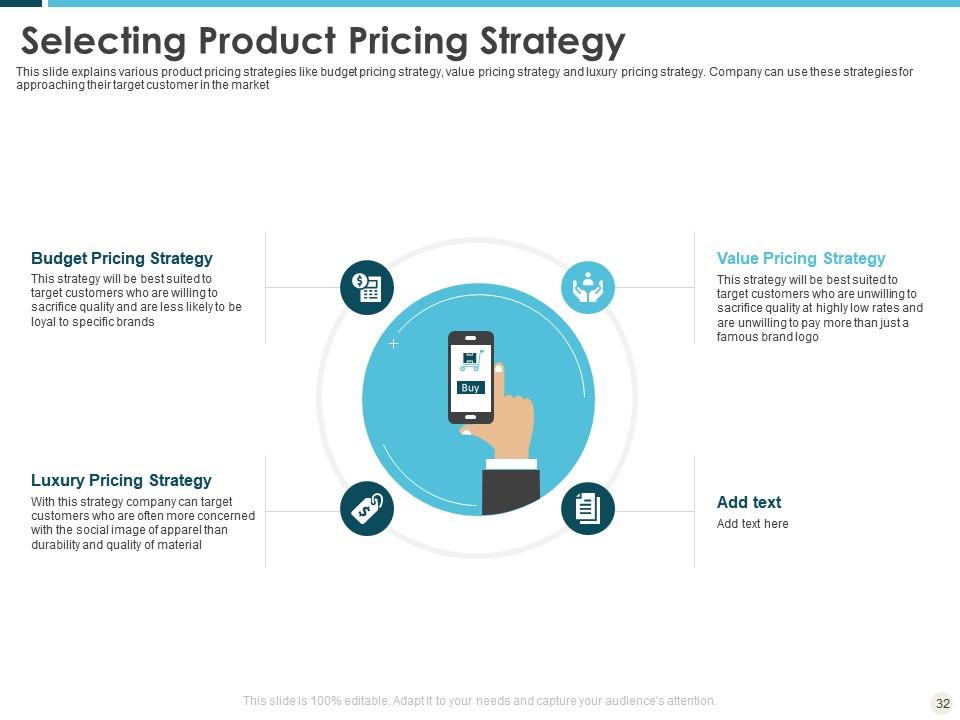
Slide 32: This slide explains various product pricing strategies like budget pricing strategy, value pricing strategy and luxury pricing strategy. Company can use these strategies for approaching their target customer in the market
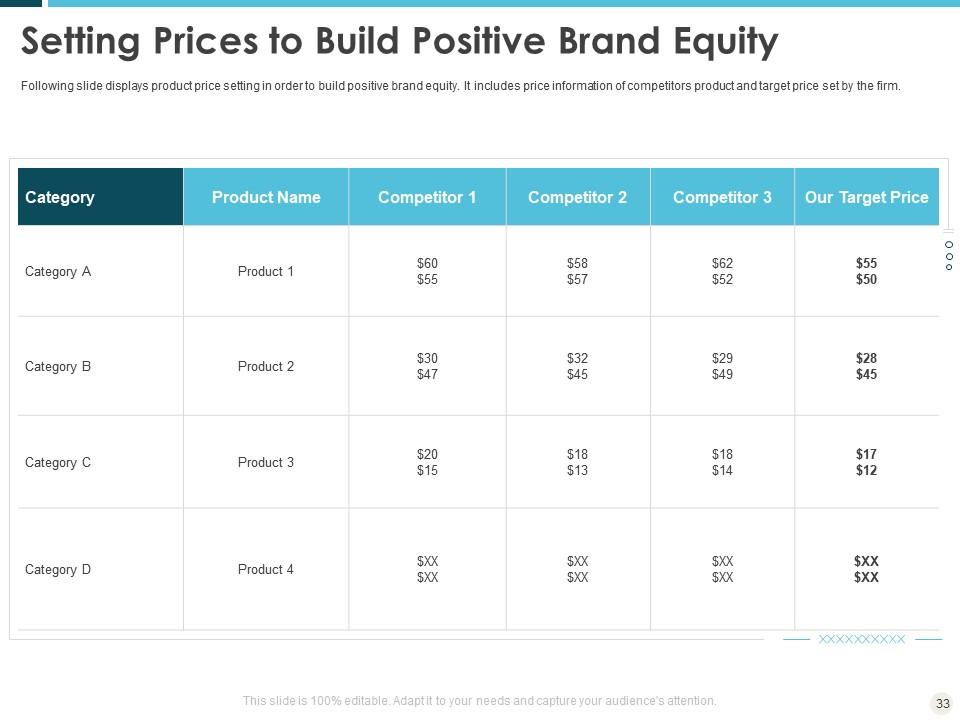
Slide 33: This slide displays product price setting in order to build positive brand equity. It includes price information of competitors product and target price set by the firm.
Slide 34: This slide introduces the ways for building new brand awareness
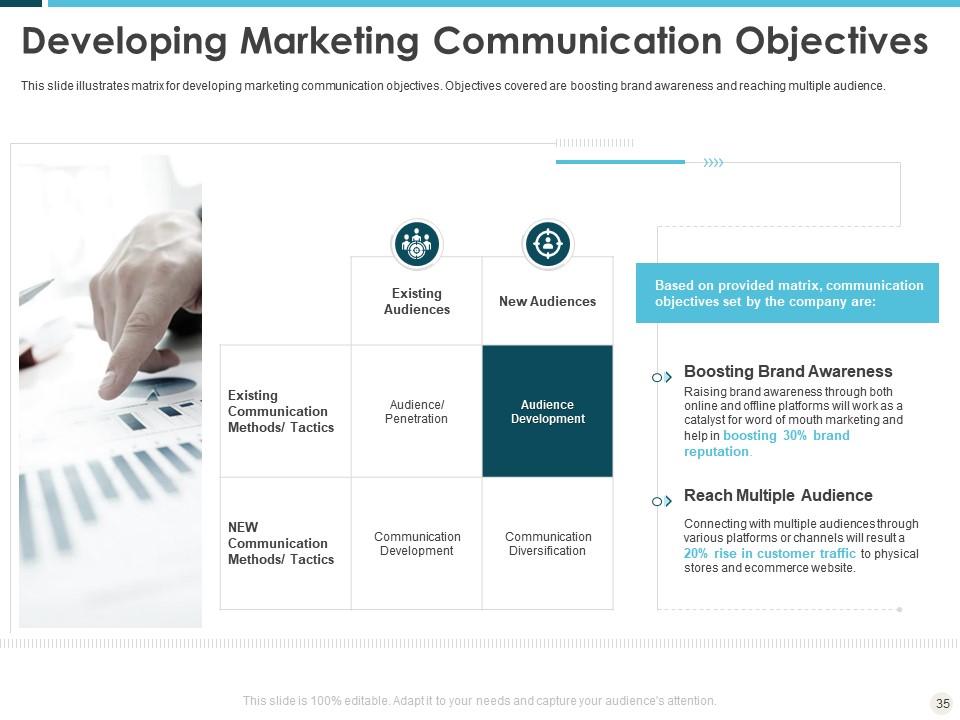
Slide 35: This slide illustrates matrix for developing marketing communication objectives. Objectives covered are boosting brand awareness and reaching multiple audience.
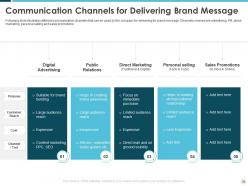
Slide 36: This slide illustrates different communication channels that can be used by the company for delivering its brand message. Channels covered are advertising, PR, direct marketing, personal selling and sales promotions.
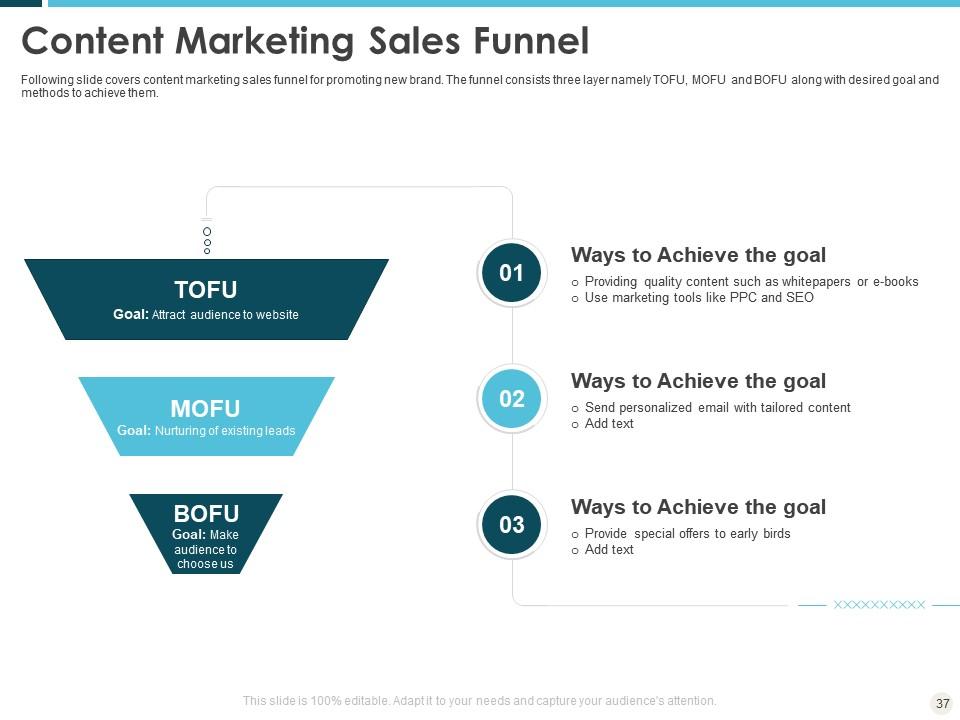
Slide 37: This slide covers content marketing sales funnel for promoting new brand. The funnel consists three layer namely TOFU, MOFU and BOFU along with desired goal and methods to achieve them.
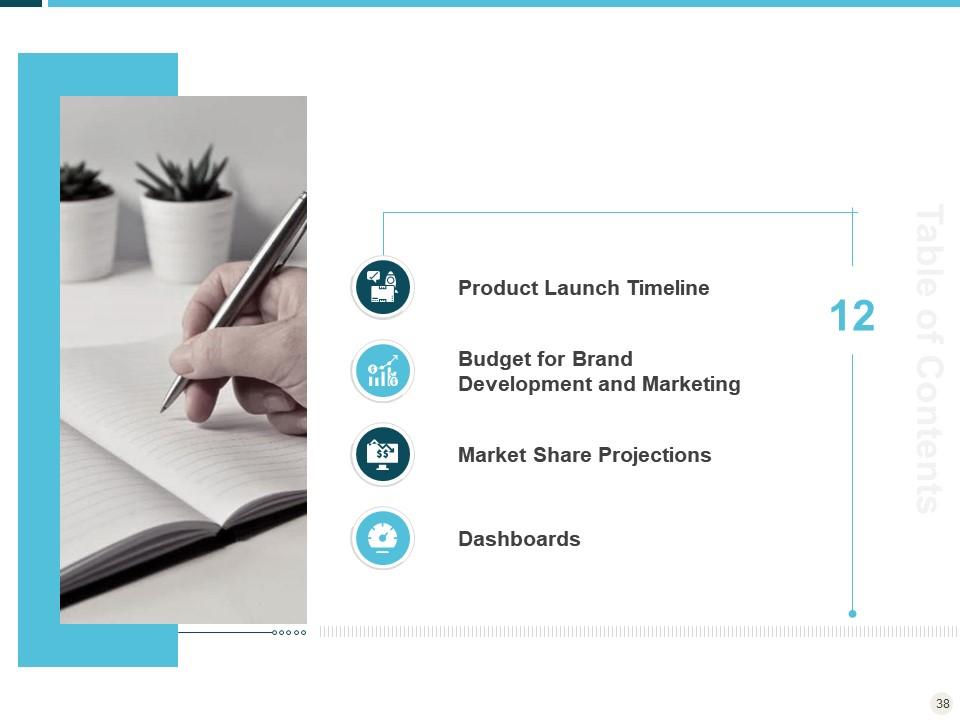
Slide 38: This slide introduces product launch timeline, a budget, market share projections, and a dashboard.
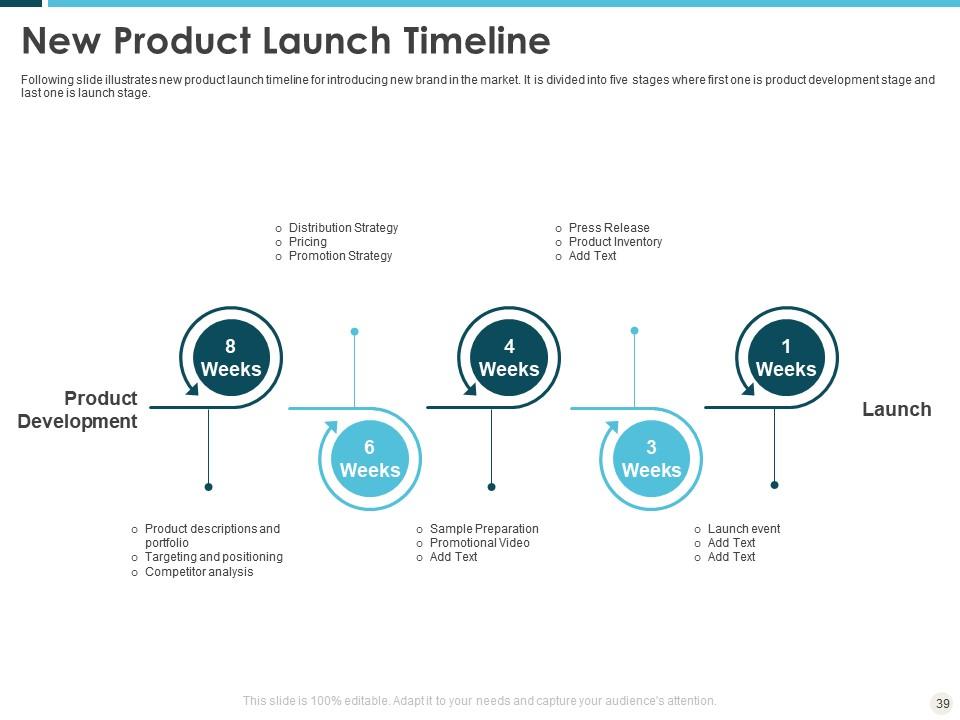
Slide 39: This slide illustrates new product launch timeline for introducing new brand in the market. It is divided into five stages where first one is product development stage and last one is launch stage.
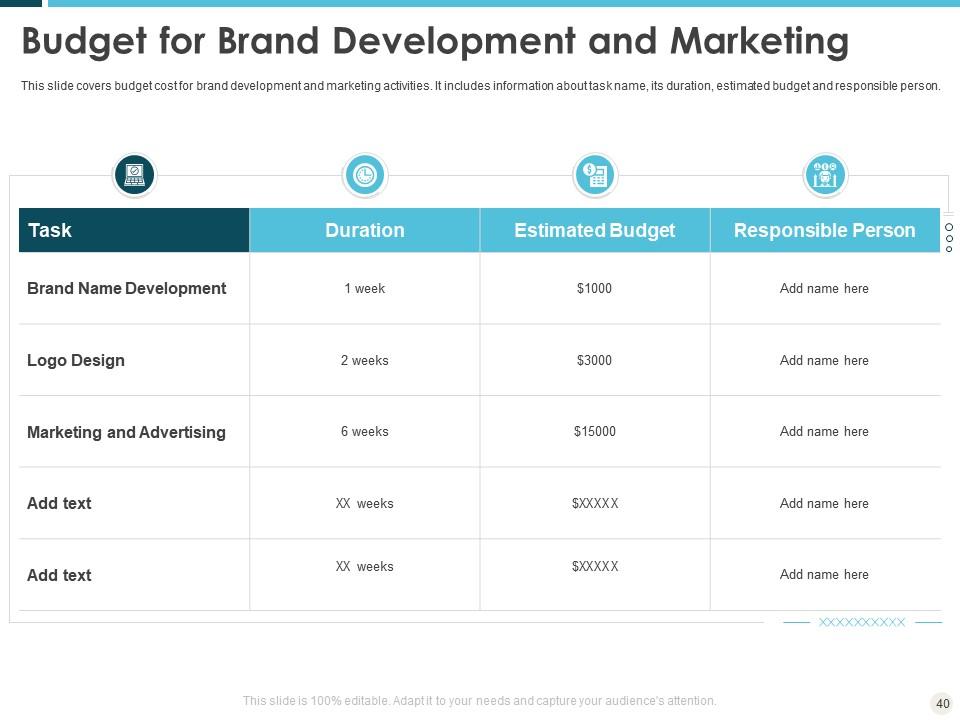
Slide 40: This slide covers budget cost for brand development and marketing activities. It includes information about task name, its duration, estimated budget and responsible person.
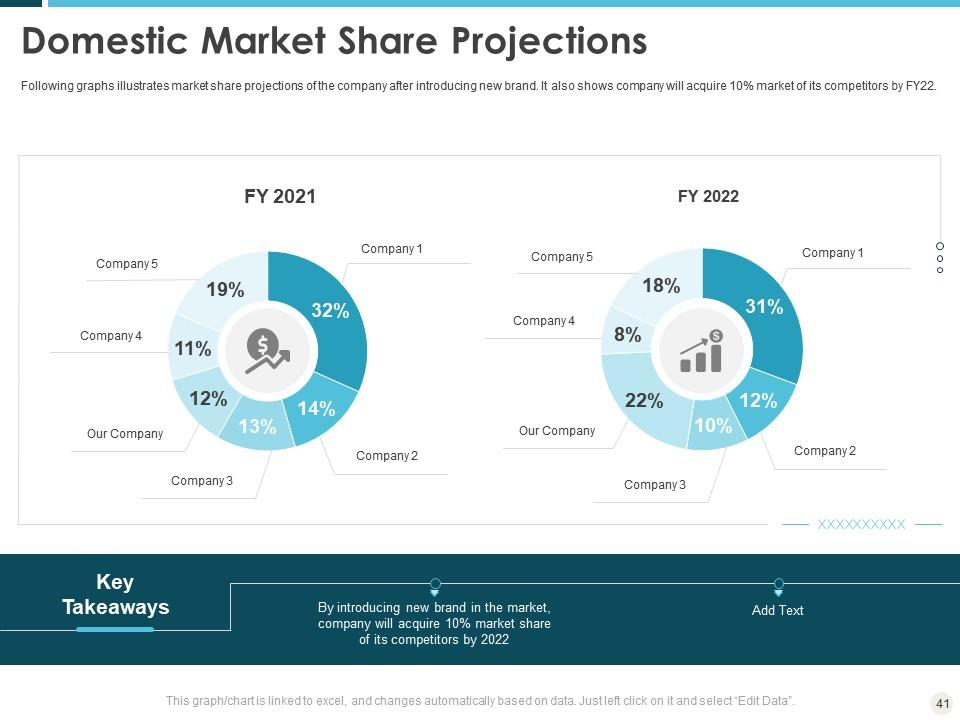
Slide 41: This slide illustrates market share projections of the company after introducing new brand. It also shows company will acquire 10% market of its competitors by FY22.
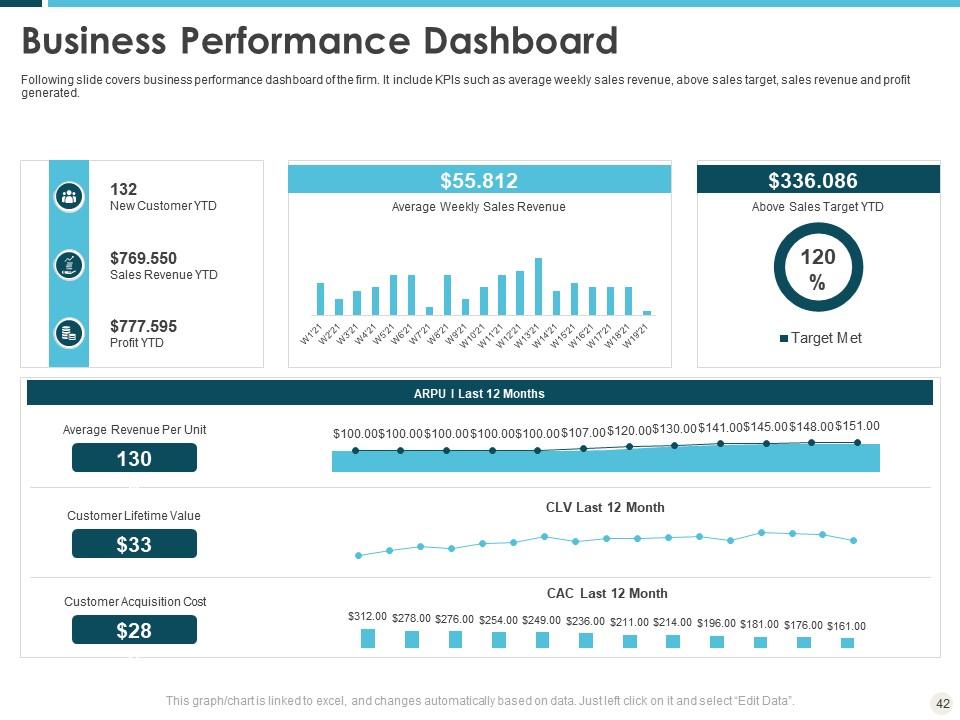
Slide 42: This slide covers business performance dashboard of the firm. It include KPIs such as average weekly sales revenue, above sales target, sales revenue and profit generated.
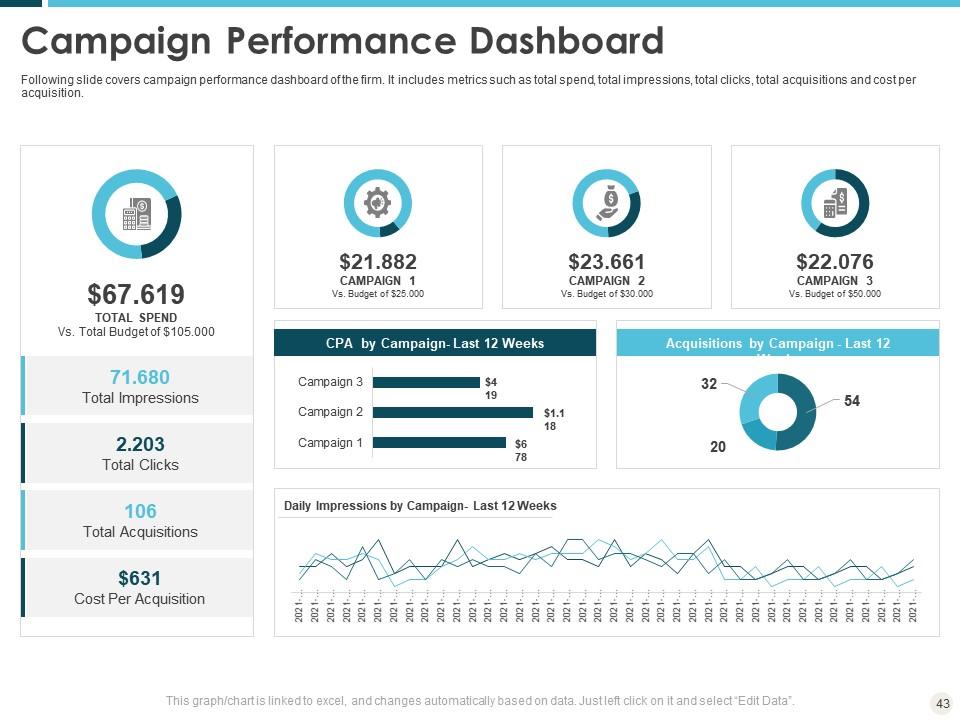
Slide 43: This slide covers campaign performance dashboard of the firm. It includes metrics such as total spend, total impressions, total clicks, total acquisitions and cost per acquisition.
Slide 44: This is an icon slide. Use it as per your needs.
Slide 45: This is an additional slide.
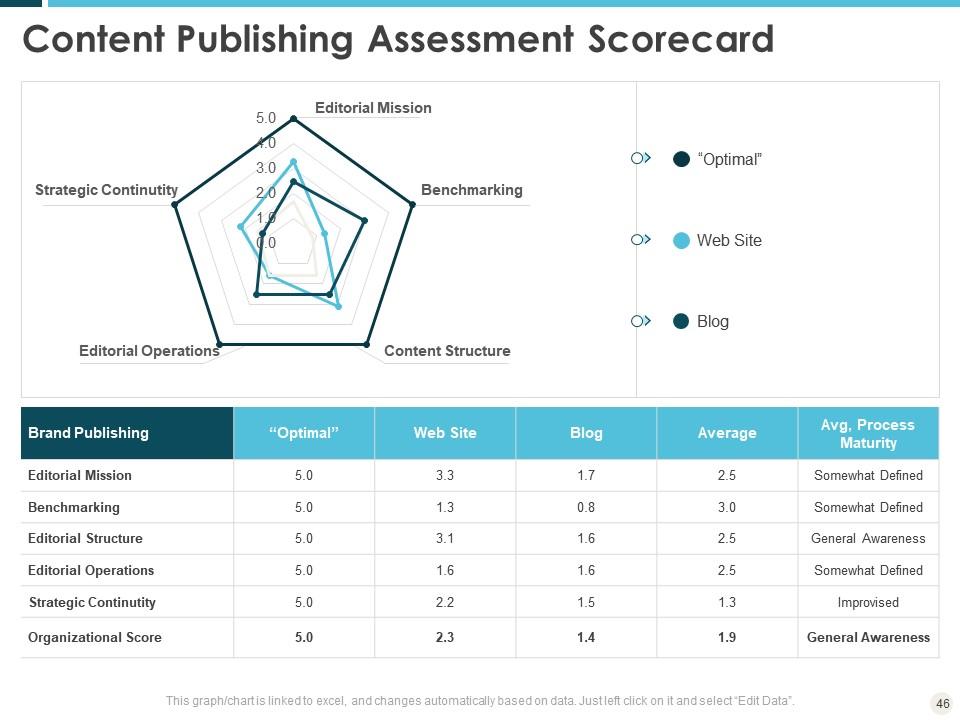
Slide 46: This slide showcases Content Publishing Assessment Scorecard
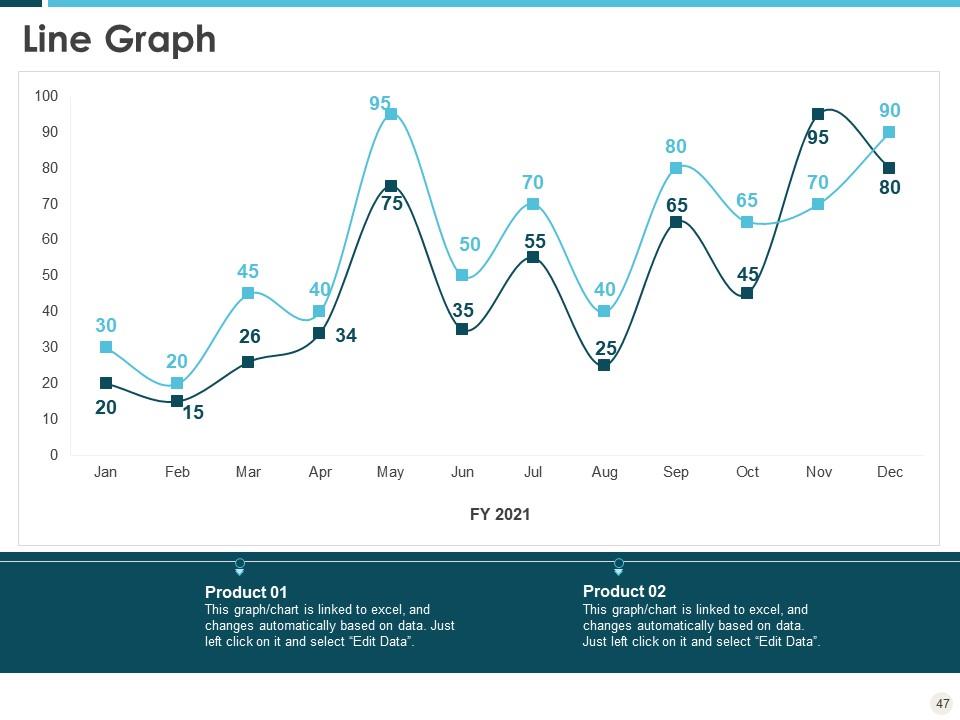
Slide 47: This is a Line Graph that can be used to showcase a comparison between two products.
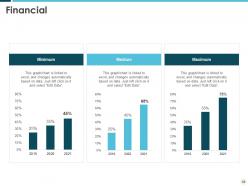
Slide 48: This is Financial scores slide. State your financial aspects etc. here.
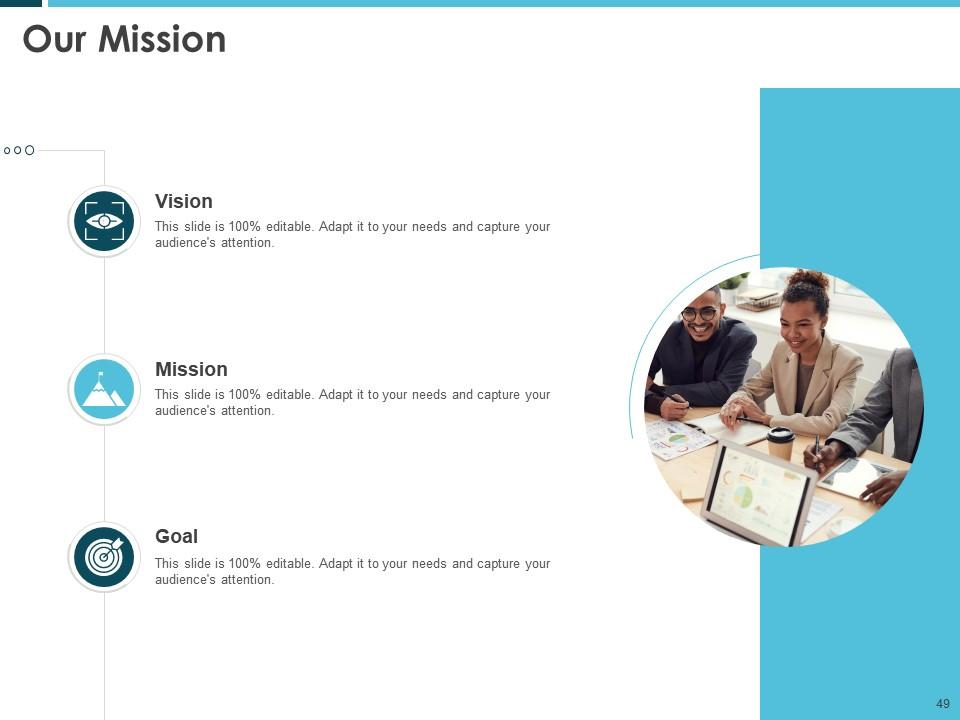
Slide 49: This is Our Mission Our Vision slide to state your mission, vision etc.
Slide 50: This is a roadmap slide that can be used to showcase chronological sequence of events.
Slide 51: This is a Blub Or Idea image slide to present innovative/ creative aspects.
Slide 52: This is a Venn diagram slide that can be used to depict comparison between three elements.
Slide 53: This is a Post It Notes slides that can be used to keep the important data at one place.
Slide 54: This is a creative Puzzle image slide to state information, specifications etc.
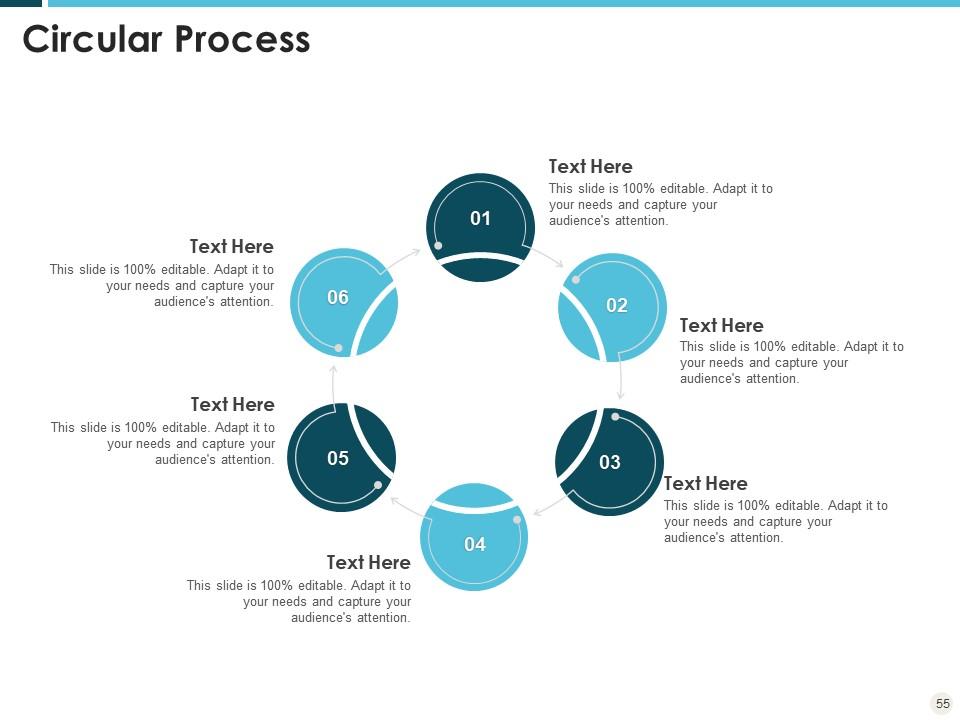
Slide 55: This is a Circular Process slide that can be used to showcase complex process flow.
Slide 56: This is a 30 60 90 Days Plan slide that can be used to formulate robust plans.
Slide 57: This is a Thankyou slide for acknowledgment. You can share your contact details here.
Building an effective brand strategy to attract customers powerpoint presentation slides with all 57 slides:
Use our Building An Effective Brand Strategy To Attract Customers Powerpoint Presentation Slides to effectively help you save your valuable time. They are readymade to fit into any presentation structure.
-
Awesome use of colors and designs in product templates.


