Cyber Security Risk Dashboard Snapshot With KPI Metrics

Rating:
90%
Cyber Security Risk Dashboard Snapshot With KPI Metrics
Slide 1 of 7
Favourites Favourites

Try Before you Buy Download Free Sample Product

Audience Impress Your
Audience
Editable 100%
Editable
Time Save Hours
of Time
The Biggest Sale is ending soon in
0
0
:
0
0
:
0
0
Rating:
90%
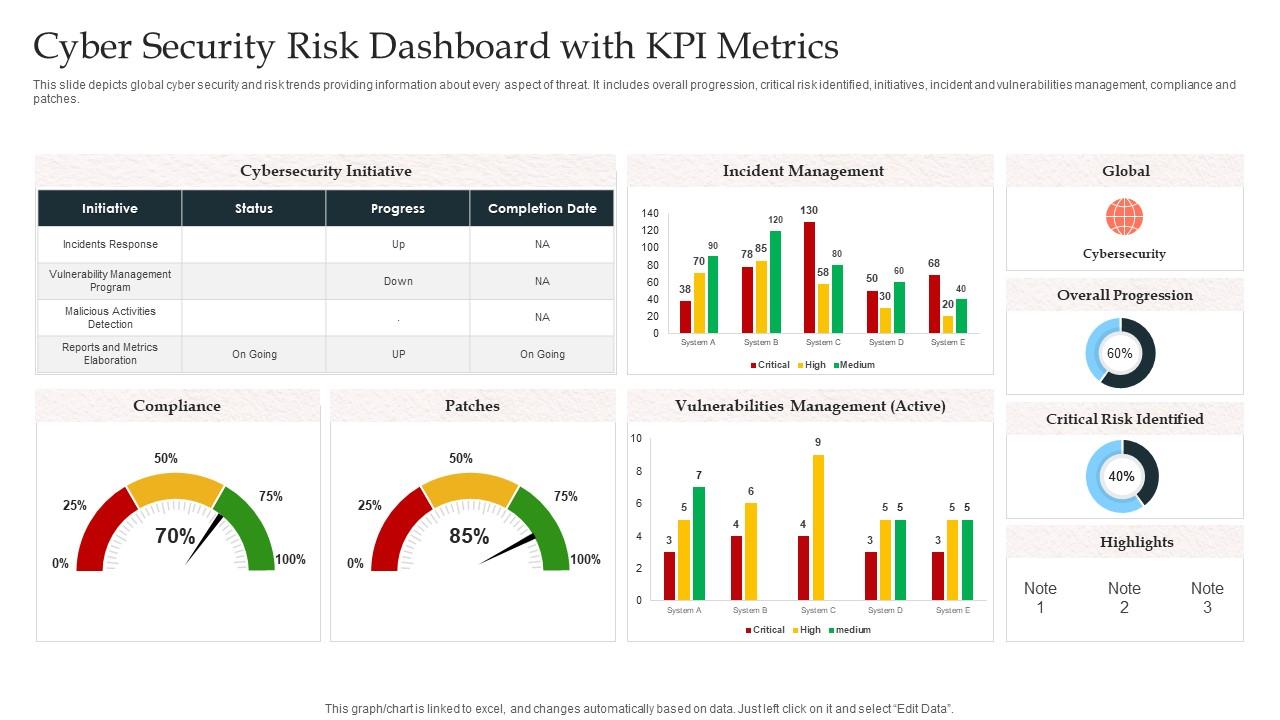
This slide depicts global cyber security and risk trends providing information about every aspect of threat. It includes overall progression, critical risk identified, initiatives, incident and vulnerabilities management, compliance and patches. Introducing our Cyber Security Risk Dashboard Snapshot With KPI Metrics set of slides. The topics discussed in these slides are Incident Management, Global, Cybersecurity, Vulnerabilities Management. This is an immediately available PowerPoint presentation that can be conveniently customized. Download it and convince your audience.

FAQs for Cyber Security Risk Dashboard Snapshot

So for your cybersecurity dashboard, you'll need five main things. Real-time threat monitoring is obvious - shows incidents and alerts as they happen. Track your vulnerability management too, like patches and exposure levels. Network traffic analysis is where you'll catch the weird stuff early (honestly saved my butt so many times). Don't forget user activity monitoring - catches insider threats and compromised accounts. Compliance indicators keep the auditors off your back. Oh, and make it role-based! Execs want high-level stuff while your SOC team needs the nitty-gritty details to actually do something about threats.

Dude, real-time dashboards are a game changer for incident response. When stuff hits the fan, you can actually watch threats move through your network instead of being buried in boring log files. Your team spots attack patterns instantly and sees which systems are getting hammered. Plus stakeholders finally understand what's happening because visuals just click better than spreadsheets (thank god). Response times drop like crazy since everyone's staring at the same live feed. Oh, and definitely hook up some automated alerts to your visual thresholds - trust me on that one.

Focus on what actually moves the needle - threat detection rates, response times, and how many vulnerabilities you've got sitting around unpatched. Those are your heavy hitters. Don't jam everything onto one screen though, it gets messy quick. Track training completion and failed logins too since people will always click the sketchy email. Honestly, I've seen way too many dashboards that look impressive but tell you nothing useful. Your board wants to glance at it and immediately know if you're winning or losing. Start with those basics, then add whatever your boss keeps asking about after incidents.

Honestly, dashboards are a game-changer for compliance stuff. They show you everything in real-time - patch status, who has access to what, how fast you're fixing vulnerabilities. All that boring regulatory stuff for SOX, HIPAA, whatever you're dealing with. Best part? Reports generate themselves instead of you frantically digging through spreadsheets when auditors show up (been there, not fun). Set up alerts so problems don't blindside you later. Way better than the old manual approach where you'd miss half the requirements anyway.

So machine learning is pretty game-changing for security dashboards. It chews through tons of network data and spots weird stuff like sketchy login attempts or strange file movements that you'd never catch otherwise. The best part? It actually gets smarter about your specific setup over time, so you're not constantly dealing with bogus alerts anymore. Honestly, I was skeptical at first but it really does cut through the noise. You get real threats prioritized instead of random junk. It can even flag potential weak spots before hackers find them. Just turn on whatever ML features your dashboard already has – you'll see the difference right away.

So first figure out your top 3-5 regulations - like if you're in healthcare, you'll want HIPAA tracking and breach alerts. Financial folks need PCI DSS and transaction monitoring stuff. Most platforms let you build custom widgets which is honestly pretty neat. Manufacturing companies usually care more about OT network security, retail is all about payment data protection. I'd start there and just configure your modules around whatever regulations actually matter to your business. Makes way more sense than using some generic setup that doesn't really fit what you're doing.

Ugh, data integration will make you want to scream. None of your security tools actually talk to each other, so good luck getting a clean view of anything. False positives are another huge pain - you'll be drowning in alerts that don't matter while missing the real stuff. Finding someone who gets both the technical side AND can explain it to executives? Nearly impossible. Oh, and people will love looking at your fancy dashboard but never actually use it for decisions. Honestly though, just pick like 3-4 critical metrics first and expand slowly.

So basically it watches how everyone normally acts - when they log in, what files they touch, that kind of thing. Then if someone starts doing weird stuff like grabbing sensitive data at 3am, it'll flag that right away. Way better than just getting alerts after something's already gone wrong, you know? You gotta let it build those baseline profiles first though - takes time to learn everyone's patterns. I've seen it catch insider threats that would've totally slipped by otherwise. Makes your security dashboard actually useful instead of just another thing beeping at you.

Honestly, most places I've worked with go for the ELK stack - Elasticsearch, Logstash, and Kibana. It's basically the standard for log stuff and visualization. Splunk's solid too but yeah, gets expensive quick (learned that the hard way). Custom builds are pretty common though. Teams throw together React or Angular frontends with Python backends like Flask or Django. Usually hook those up to PostgreSQL or InfluxDB if you're dealing with time-series data. Really depends on your data volume and what security tools you're already using. I'd start by figuring out what data sources you need to connect to first, then work backwards from there.

A cybersecurity dashboard turns all that messy security data into visuals your executives can actually understand. No more explaining what SIEM alerts mean during board meetings - honestly, that's the worst. Real-time threat levels, incident trends, compliance status... all laid out clearly. Security teams can finally make data-driven arguments for budget (hallelujah), while leadership gets the risk overview they need. Both sides speak the same language for once. Set up automated reports so you're not panicking before every meeting. Game changer, seriously.

Start with role-based permissions and multi-factor auth - that's gonna save your butt more than anything else. Update your dashboard components religiously because hackers love stale software. Oh, and don't forget logging user activities with alerts for weird behavior. Most people overlook this, but encrypt connections to your data sources and validate inputs to block injection attacks. Honestly, I've watched teams get burned by treating dashboards like they're not major targets. Audit everything quarterly - sounds boring but it's worth it.

So basically, dig into your security logs from the past 6-12 months and look for patterns. Monthly breach attempts, malware hits, login failures - that kind of stuff shows trends when you chart it out. I'd start with just your top 3 incident types because otherwise it gets overwhelming fast. Compare this year to last year and you'll spot seasonal weirdness or new attack methods. The whole point is building baselines so you know when something's off. Honestly, most people skip this step but it's where the real insights are hiding.

So the big thing is scope - small business dashboards track the basics like phishing and network stuff. Enterprise ones? They're dealing with multiple sites, thousands of users, compliance headaches. Honestly, small business versions are way cleaner since there's less mess to monitor. Enterprise dashboards can get pretty nuts with all the data feeds and role-based controls everywhere. Plus enterprise gets more customization and plays nicer with existing security tools. My take: don't get distracted by flashy demos. Just pick what actually matches your network size.

Honestly, integrations are what make dashboards actually useful instead of just pretty displays. Connect your SIEM, ticketing system, and threat feeds - suddenly you've got automated responses and can see the whole attack story in one place. No more juggling a million tabs (my browser always looks like a disaster anyway). The data flows by itself, triggers responses automatically, and pushes alerts straight to Slack or wherever your team hangs out. My advice? Start with maybe 3 integrations that fix your biggest daily annoyances. Don't go crazy trying to connect everything - you'll just create more chaos.

Stick with traffic light colors - red, yellow, green for threat levels. Executives eat that stuff up because it's instant. Heat maps showing real-time attacks across your network work great too. Those severity gauges? Pure gold. I'd throw in some trend lines for attack volume over time, maybe geographic maps if you're tracking where stuff's coming from. But seriously, avoid those flashy 3D charts that look impressive but tell you zilch. Keep your colors consistent throughout, use obvious icons for different threats, and make sure the critical alerts really pop with size and contrast. Clean and simple beats fancy every time.

Ratings and Reviews

90% of 100
Review Form
Write a review
Most Relevant Reviews
  1. 100%

    by Diego Gardner

    Slideteam offers pocket-friendly products. As a college student this is a really necessary thing to look at while paying for something.
  2. 80%

    by Duncan Berry

    Thanks for all your great templates they have saved me lots of time and accelerate my presentations. Great product, keep them up!

2 Item(s)

per page: