Marketing comparing two groups for statistical significance dashboard powerpoint template
Our Marketing Comparing Two Groups For Statistical Significance Dashboard Powerpoint Template are topically designed to provide an attractive backdrop to any subject. Use them to look like a presentation pro.
Our Marketing Comparing Two Groups For Statistical Significance Dashboard Powerpoint Template are topically designed to pro..
- Google Slides is a new FREE Presentation software from Google.
- All our content is 100% compatible with Google Slides.
- Just download our designs, and upload them to Google Slides and they will work automatically.
- Amaze your audience with SlideTeam and Google Slides.
-
Want Changes to This PPT Slide? Check out our Presentation Design Services
- WideScreen Aspect ratio is becoming a very popular format. When you download this product, the downloaded ZIP will contain this product in both standard and widescreen format.
-

- Some older products that we have may only be in standard format, but they can easily be converted to widescreen.
- To do this, please open the SlideTeam product in Powerpoint, and go to
- Design ( On the top bar) -> Page Setup -> and select "On-screen Show (16:9)” in the drop down for "Slides Sized for".
- The slide or theme will change to widescreen, and all graphics will adjust automatically. You can similarly convert our content to any other desired screen aspect ratio.
Compatible With Google Slides

Get This In WideScreen
You must be logged in to download this presentation.
PowerPoint presentation slides
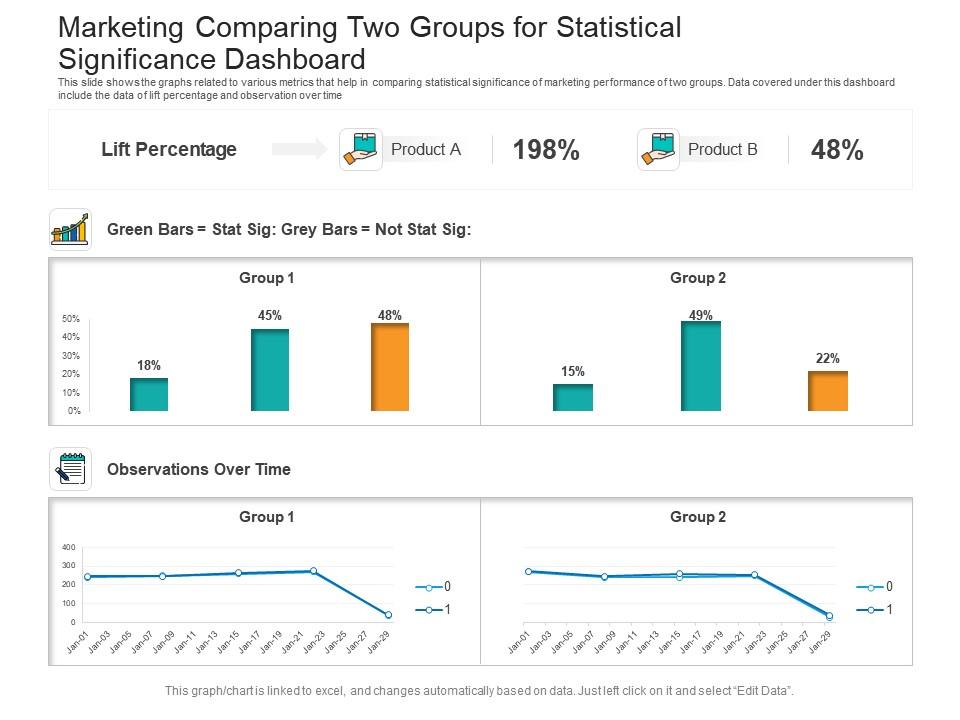
This slide shows the graphs related to various metrics that help in comparing statistical significance of marketing performance of two groups. Data covered under this dashboard include the data of lift percentage and observation over time. This is a Marketing Comparing Two Groups For Statistical Significance Dashboard Powerpoint Template drafted with a diverse set of graphics, that can be reformulated and edited as per your needs and requirements. Just download it in your system and make use of it in PowerPoint or Google Slides, depending upon your presentation preferences.
People who downloaded this PowerPoint presentation also viewed the following :
Marketing comparing two groups for statistical significance dashboard powerpoint template with all 2 slides:
Use our Marketing Comparing Two Groups For Statistical Significance Dashboard Powerpoint Template to effectively help you save your valuable time. They are readymade to fit into any presentation structure.
-
Qualitative and comprehensive slides.
-
Easy to edit slides with easy to understand instructions.
-
Awesome presentation, really professional and easy to edit.
-
I discovered this website through a google search, the services matched my needs perfectly and the pricing was very reasonable. I was thrilled with the product and the customer service. I will definitely use their slides again for my presentations and recommend them to other colleagues.
-
Awesomely designed templates, Easy to understand.
-
Really like the color and design of the presentation.
-
Unique research projects to present in meeting.
-
Design layout is very impressive.


