Rotation process indicating data processing cycle
Our Rotation Process Indicating Data Processing Cycle are topically designed to provide an attractive backdrop to any subject. Use them to look like a presentation pro.
- Google Slides is a new FREE Presentation software from Google.
- All our content is 100% compatible with Google Slides.
- Just download our designs, and upload them to Google Slides and they will work automatically.
- Amaze your audience with SlideTeam and Google Slides.
-
Want Changes to This PPT Slide? Check out our Presentation Design Services
- WideScreen Aspect ratio is becoming a very popular format. When you download this product, the downloaded ZIP will contain this product in both standard and widescreen format.
-

- Some older products that we have may only be in standard format, but they can easily be converted to widescreen.
- To do this, please open the SlideTeam product in Powerpoint, and go to
- Design ( On the top bar) -> Page Setup -> and select "On-screen Show (16:9)” in the drop down for "Slides Sized for".
- The slide or theme will change to widescreen, and all graphics will adjust automatically. You can similarly convert our content to any other desired screen aspect ratio.
Compatible With Google Slides

Get This In WideScreen
You must be logged in to download this presentation.
PowerPoint presentation slides
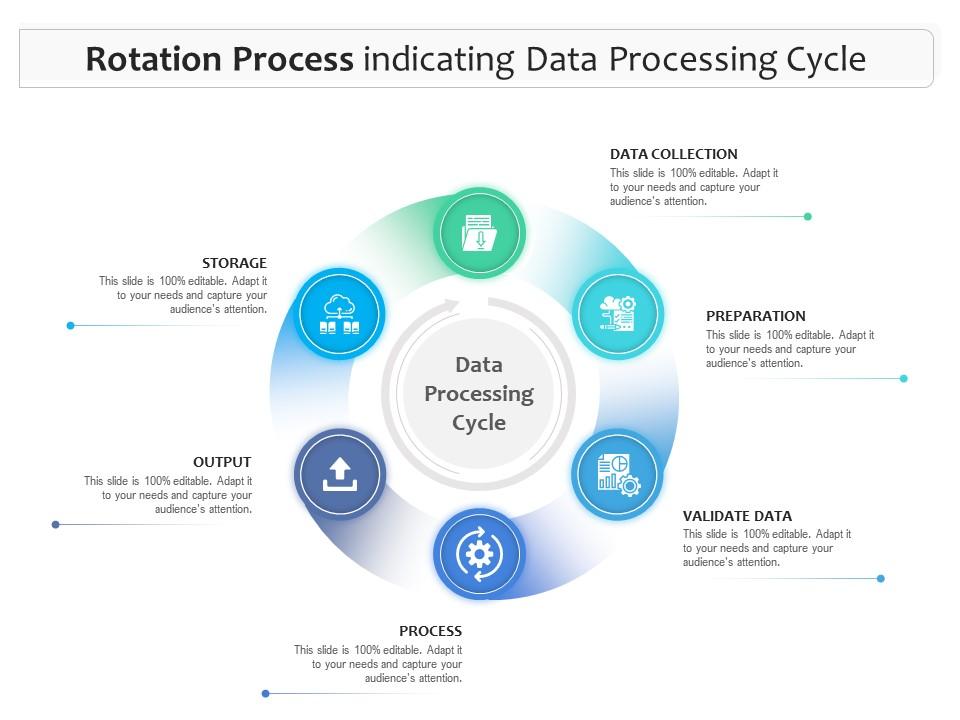
Introducing our premium set of slides with Rotation Process Indicating Data Processing Cycle. Elucidate the six stages and present information using this PPT slide. This is a completely adaptable PowerPoint template design that can be used to interpret topics like Data Collection, Preparation, Validate Data, Process, Storage. So download instantly and tailor it with your information.
People who downloaded this PowerPoint presentation also viewed the following :
Content of this Powerpoint Presentation
Description:
The image is a PowerPoint slide that illustrates the "Rotation Process indicating Data Processing Cycle." This conceptual diagram represents various stages of data handling in a cyclical format, emphasizing that data processing is an ongoing, iterative process.
The diagram is divided into five segments, each representing a step in the data processing cycle:
1. Data Collection:
This initial step involves gathering data from various sources.
2. Preparation:
This step includes organizing and structuring the collected data to make it suitable for analysis.
3. Process:
At this stage, the prepared data is processed, which could involve calculations, transformation, or analysis.
4. Output:
This refers to the result of data processing, which might be insights, reports, or actionable information.
5. Storage:
After processing, the data is stored for future use, reference, or further analysis.
6. Validate Data:
It's essential to check the data's accuracy and consistency before it enters the next cycle or is used for decision-making.
Use Cases:
Here are seven industries where such a slide could be applied:
1. Healthcare:
Use: Patient data management.
Presenter: Healthcare Data Analyst.
Audience: Hospital administration.
2. Finance:
Use: Financial data analysis.
Presenter: Financial Analyst.
Audience: Investors, company executives.
3. Marketing:
Use: Consumer data analysis for market strategy.
Presenter: Marketing Strategist.
Audience: Marketing team, brand managers.
4. Retail:
Use: Customer purchase data analysis.
Presenter: Retail Manager.
Audience: Sales and marketing team.
5. Information Technology:
Use: Software user data processing.
Presenter: IT Project Manager.
Audience: Developers, product managers.
6. Telecommunications:
Use: User data processing for network optimization.
Presenter: Network Operations Manager.
Audience: Technical staff, operations team.
7. E-commerce:
Use: Processing customer data for personalized shopping experiences.
Presenter: Data Scientist.
Audience: Product teams, marketing departments.
Rotation process indicating data processing cycle with all 2 slides:
Use our Rotation Process Indicating Data Processing Cycle to effectively help you save your valuable time. They are readymade to fit into any presentation structure.
-
Appreciate the research and its presentable format.
-
The Designed Graphic are very professional and classic.
-
Informative presentations that are easily editable.
-
Designs have enough space to add content.
-
Great designs, really helpful.
-
Awesome use of colors and designs in product templates.
-
Attractive design and informative presentation.


