- Sub Categories
-
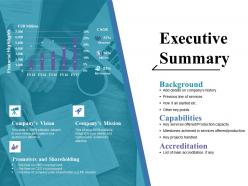 Executive summary ppt pictures
Presenting this set of slides with name - Executive Summary Ppt Pictures. This is a three stage process. The stages in this process are Background, Capabilities, Accreditation, Promoters And Shareholding, Business.
-
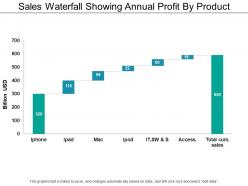 Sales waterfall showing annual profit by product
Presenting this set of slides with name - Sales Waterfall Showing Annual Profit By Product. This is a seven stage process. The stages in this process are Sales Waterfall, Waterfall Chart.
-
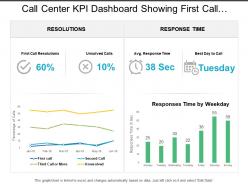 Call center kpi dashboard showing first call resolution response time
Presenting call center KPI dashboard showing first call resolution response time. This deck offers you plenty of space to put in titles and sub titles. This template is Excel linked just right click to input your information. High resolution-based layout, does not change the image even after resizing. This presentation icon is fully compatible with Google slides. Quick downloading speed and simple editing options in color text and fonts.PPT icons can easily be changed into JPEG and PDF applications.
-
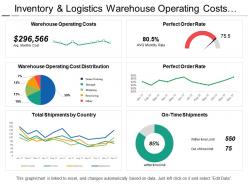 Inventory and logistics warehouse operating costs dashboard
Presenting inventory and logistics warehouse operating costs dashboard PPT slideshow. Editable charts, visuals, colors and text. Presentable and easy to comprehend info graphic format. The presentation template can be downloaded and saved in any desired format. Privilege of insertion of logo and trademarks for more personalization. Adaptable to wide screen view without the problem of pixilation. Can be used with Google slides. Easy to edit and customize as per your needs. Beneficial for industry professionals, managers, executives, researchers, sales people, etc.
-
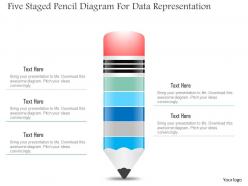 1214 five staged pencil diagram for data representation powerpoint slide
We are proud to present our 1214 five staged pencil diagram for data representation powerpoint slide. Five staged pencil diagram has been used to craft this power point template slide. This PPT slide contains the concept of data representation. Use this PPT slide for your business data related presentation.
-
 Business Team With Pie Charts For Data Driven Strategy Powerpoint Slides
Hassle free download in quick and easy steps. Change orientation and sizes of PPT images to suit your need. Insert company name, brand name, tagline, logo etc. and suitable text to personalize. Fully modifiable color scheme and contrast of PPT infographics. Easily convertible to JPG or PDF and runs smoothly with Google slides. No change in the high resolution post editing.
-
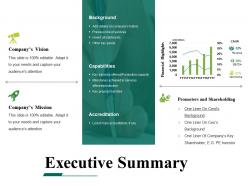 Executive summary powerpoint templates microsoft
Presenting executive summary powerpoint templates microsoft. This is a executive summary powerpoint templates microsoft. This is a four stage process. The stages in this process are accreditation, capabilities, background, promoters and shareholding.
-
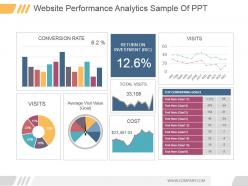 Website performance analytics sample of ppt
Presenting website performance analytics sample of ppt. This is a website performance analytics sample of ppt. This is a three stage process. The stages in this process are conversion rate, visits, average visit value goal, return on investment ric, total visits, cost, visits, top converting goals, jan, feb, mar, apr, may, jun, jul, aug, sep, oct, nov, dec, goal.
-
 Information technology kpi dashboard showing overdue tasks deadlines
Introducing information technology KPI dashboard showing overdue tasks deadlines PowerPoint template. PPT slides offer a thorough editable customization of font, color, and orientation of high powered info-graphics. Quick and easy downloading process. Suitable for business managers and professionals. Sufficient space is available for the easy placement of desired content. Templates are compatible with wide range of software such as pdf/jpeg/Jpg. PPT design can be access in standard and widescreen view. Editing instructions are explained step by step.
-
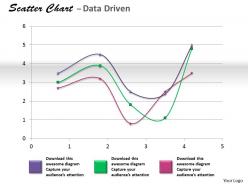 Data driven coordinate data with scatter chart powerpoint slides
We are proud to present our data driven coordinate data with scatter chart powerpoint slides. Tap The Ingenuity Of Our Data Driven Coordinate Data With Scatter Chart Powerpoint Slides Power Point Templates. They Are Programmed To Succeed. Your Success Is Our Commitment. Our Data Driven Coordinate Data With Scatter Chart Powerpoint Slides Power Point Templates Will Ensure You Reach Your Goal.
-
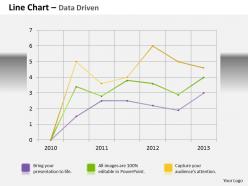 Data driven line chart business graph powerpoint slides
We are proud to present our data driven line chart business graph powerpoint slides. Throw The Gauntlet With Our Data Driven Line Chart Business Graph Powerpoint Slides Power Point Templates. They Are Created To Take Up Any Challenge. Hit The Nail On The Head With Our Data Driven Line Chart Business Graph Powerpoint Slides Power Point Templates. Embed Your Ideas In The Minds Of Your Audience.
-
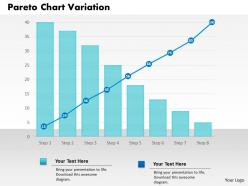 0414 pareto variation with column line chart powerpoint graph
Pixel-friendly images and graphics in the icons. No effect on picture quality when used on a wide screen display. Attune well with the major online and offline softwares. Allow instant customization of the slide icons and the graphics. Provided instructions to customize the content and the slide icons. 100% editable slide icons. Useful for the business entrepreneurs and the marketing individuals.
-
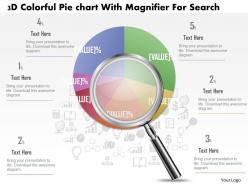 1214 3d colorful pie graph with magnifier data search powerpoint slide
Adaptable presentation designs as editing can be done with color, text and font. PowerPoint slides are compatible with Google slides. Easy to download and insert in the presentation. Option to present PPT template in standard and widescreen view. Quick to transform into Jpeg and Pdf document. Perfect for business leaders and managers. Easy to add trade name or mark or company logo.
-
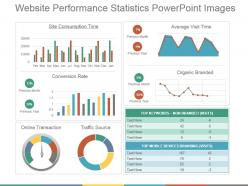 Website performance statistics powerpoint images
We present to you our website performance statistics PowerPoint images. You can change the placement, the size or the color of the graphical images used in the template. You can make numerous changes by following the instructions given in sample slides, as this PPT is fully editable. This template can be saved in either PDF or JPG format. You can view the presentation in widescreen display ratio of 16:9 or standard size display ratio of 4:3. So download, edit and present it.
-
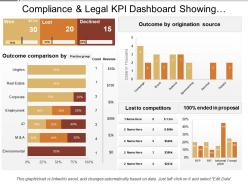 Compliance and legal kpi dashboard showing outcome comparison
Presenting this set of slides with name - Compliance And Legal Kpi Dashboard Showing Outcome Comparison. This is a three stage process. The stages in this process are Compliance And Legal, Legal Governance, Risk Management.
-
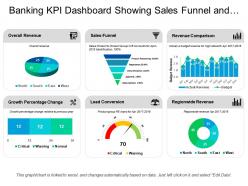 Banking kpi dashboard showing sales funnel and overall revenue
Presenting this set of slides with name - Banking Kpi Dashboard Showing Sales Funnel And Overall Revenue. This is a six stage process. The stages in this process are Banking, Finance, Money.
-
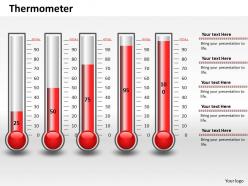 0414 percentage data thermomete column chart powerpoint graph
The PPT images offer compatibility with Google templates. High resolution icons for clear message delivery. An easy access to make the desired changes or edit it anyways. Wide screen view of the slides. Easy conversion into JPG or PDF format. Unique and informational content. Valuable for health and care professionals.
-
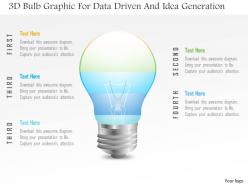 1214 3d bulb graphic for data driven and idea generation powerpoint slide
Multiple choice to display presentation slide in standard and widescreen view. 100% editable PowerPoint design as can be modified easily. These have a futuristic approach. Valuable for business professionals, sales representatives, marketing professionals, students and researchers. These can easily grab the attention of audience. PPT templates are well-matched with Google slides.
-
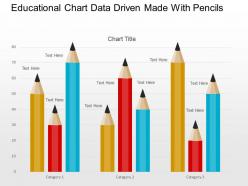 Educational chart data driven made with pencils powerpoint slides
Format slide pie outline is completely changeable. Downloading layout in any format decisions like JPEG, JPG or PDF is simple and brisk. Provide a pro perspective to your format slides. Highly apparent with Google slides. Symbols are in like way being joined. Customization of content, representation, outlines, and substance as appeared by your aching and need. Visuals don't obscure when opened on widescreen. Company logo, name and trademark can be effectively installed.
-
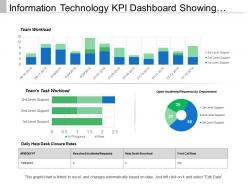 Information technology kpi dashboard showing team task workload
Presenting this set of slides with name - Information Technology Kpi Dashboard Showing Team Task Workload. This is a three stage process. The stages in this process are Information Technology, It, Iot.
-
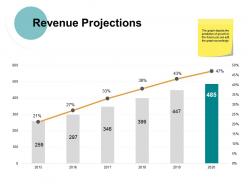 Revenue projections ppt powerpoint presentation file designs download
Presenting this set of slides with name - Revenue Projections Ppt Powerpoint Presentation File Designs Download. This is a two stage process. The stages in this process are Finance, Management, Strategy, Business, Marketing.
-
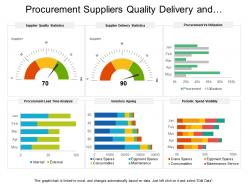 Procurement suppliers quality delivery and utilization dashboard
Presenting this set of slides with name - Procurement Suppliers Quality Delivery And Utilization Dashboard. This is a six stage process. The stages in this process are Purchase, Procurement, Buy.
-
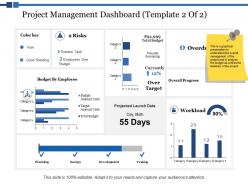 Project management dashboard risks ppt powerpoint presentation styles outfit
This is a threee stages process. The stages in this process are Finance, Marketing, Management, Investment, Analysis.
-
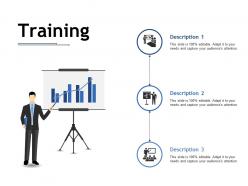 Training ppt infographics example file
Presenting this set of slides with name - Training Ppt Infographics Example File. This is a three stage process. The stages in this process are Description, Training, Task.
-
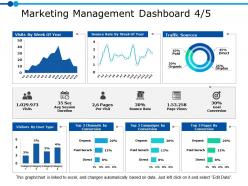 Marketing management dashboard 4 5 ppt powerpoint presentation gallery example
Presenting this set of slides with name - Marketing Management Dashboard 4 5 Ppt Powerpoint Presentation Gallery Example. This is a three stage process. The stages in this process are Business, Management, Strategy, Analysis, Marketing.
-
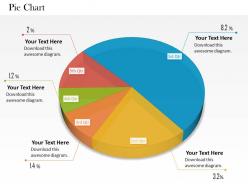 0514 multistaged data driven pie chart powerpoint slides
Presentation design accessible with different pie slices. Add this slide anywhere within your own slide for maximum impact. Easy to download and insert in the presentation. Applicable by finance department of several organizations along with entrepreneurs and managerial students. Thoroughly editable PowerPoint presentation. Modify the content at your personal comfort and need. Download and save the presentation in desired format.
-
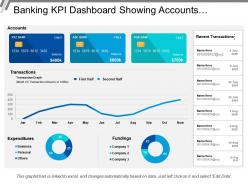 Banking kpi dashboard showing accounts expenditures fundings
Presenting this set of slides with name - Banking Kpi Dashboard Showing Accounts Expenditures Fundings. This is a three stage process. The stages in this process are Banking, Finance, Money.
-
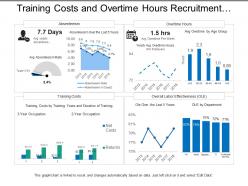 Training costs and overtime hours recruitment dashboard
Presenting this set of slides with name - Training Costs And Overtime Hours Recruitment Dashboard. This is a four stage process. The stages in this process are Staffing Plan, Recruitment, Staff Management.
-
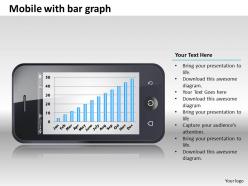 0414 mobile bar graph column chart powerpoint graph
Cogently abstracted Presentation graphics makes it easy to interpret the related notion , Refine able matrix charts, designs, style, pattern, size of the PowerPoint images, An exclusive tool perfect for business managers, specialist, experts ,researchers and scholars etc. , PowerPoint slides can be easily exportable to various configurations like PDF or JPG. Easy to insert company logo or trademark, Option to add subsequent caption or subheadings also, well versed with Google slides and other programs.
-
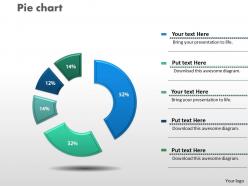 0414 pie chart data driven layout powerpoint graph
Flawless presentation of ideas. High resolution visual ensures zero pixilation at any size output. Splendid mix of color, design, format and fonts. Ease of download. Ease of saving it in any desired format. Compatible with numerous online and offline software options. Thoroughly editable slide design background. Ease of inclusion and exclusion of data. Ease of personalization with company specific name, logo and trademark. Used by marketing professionals, sales people, students and teachers.
-
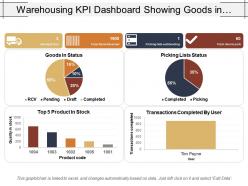 Warehousing kpi dashboard showing goods in status
The presentation design is easy to edit by anyone even having without any specific knowledge. Design elements are editable including font, type, color, size, style, shape, background, images etc. Slides are completely compatible with Google Slides and MS PowerPoint software. Both standard and full screen view available; no change on design quality will happen when opened on full screen view.
-
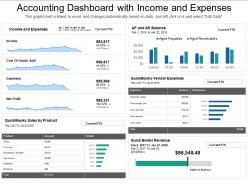 Accounting dashboard with income and expenses
Presenting accounting dashboard with income and expenses PPT slideshow. Loaded with incomparable benefits. Readymade PPT graphic helps in saving time and effort. Can be personalized by adding company trademark, logo, brand and symbols. Can be utilized for displaying both simple and complex information. Include or exclude slide content as per your individual need. Colors and text can be easily changed as the PPT slide is completely editable. Useful for every business leader and professional, project management team, business analysts, etc.
-
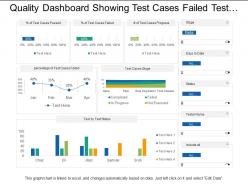 Quality dashboard showing test cases failed test status and in progress
SlideTeam feels immense pleasure in presenting to you its quality dashboard showing test cases failed test status and in progress. Following simple instructions given in the sample template you can easily alter the given set of predesigned slides. You can view the PPT template in standard size display ratio of 4:3 or widescreen display ratio of 16:9. The business slides are very easy to use and operate as they are compatible with Google Slides and can be similarly saved in format of PDF or JPG.
-
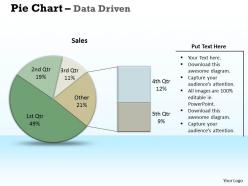 Data driven pie chart of market research powerpoint slides
We are proud to present our data driven pie chart of market research powerpoint slides. Use this data driven pie chart for market reasech. Pie charts are often used to compare data.Use this diagram to review factors that contribute to a specific situation. It helps you to take your team up to a higher level with your thoughts.
-
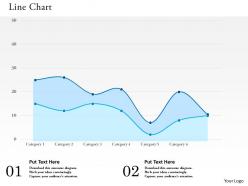 0514 use line chart for business powerpoint slides
Slide runs quite smoothly on all software. Use slides in matter of moments. Insert company logo, name or trademark with no issues. Zero pixilation when slide is viewed on widescreen. Quite Compatible with google slides. Easily display titles and subtitles with no space constraints. High resolution PPT slides. Convert to JPG and PDF formats lucidly and rapidly. Useful for businesses, small and large, technical startups, project management and strategic organizations, educational institutes teaching courses on management, economics, statistics, computer science.
-
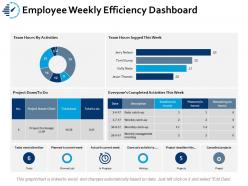 Employee weekly efficiency dashboard snapshot ppt portfolio brochure
Presenting this set of slides with name - Employee Weekly Efficiency Dashboard Snapshot Ppt Portfolio Brochure. This is a two stage process. The stages in this process are Business, Management, Strategy, Sales, Marketing.
-
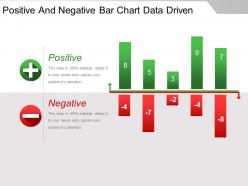 Positive and negative bar chart data driven powerpoint guide
Presenting positive and negative bar chart data driven powerpoint guide. This is a positive and negative bar chart data driven powerpoint guide. This is a two stage process. The stages in this process are positive, negative.
-
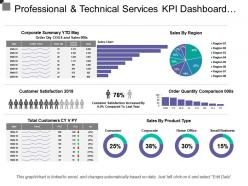 Professional and technical services kpi dashboard showing sales by region
Presenting this set of slides with name - Professional And Technical Services Kpi Dashboard Showing Sales By Region. This is a three stage process. The stages in this process are Professional And Technical Services, Services Management, Technical Management.
-
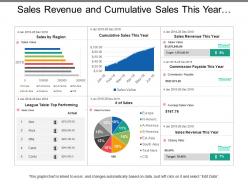 Sales revenue and cumulative sales this year dashboards
Presenting this set of slides with name - Sales Revenue And Cumulative Sales This Year Dashboards. Completely amendable presentation design as some elements are editable. Ease to personalize the slide with your company name, logo and even tag line. PowerPoint slide can be downloaded easily and transform into JPG and PDF format. More designs can be accessed with different nodes and stages. PPT diagram can be projected in standard and widescreen view. Great use of colors and innovatively designed. PPT template is compatible with Google slides.
-
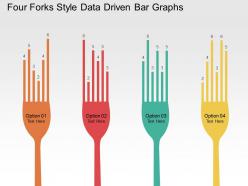 Four forks style data driven bar graphs powerpoint slides
Work adequately with all thing alterations. Easy to embed association logo, trademark or name. Visuals quality don't pixelate when expected on wide screen. Well magnificent with Google slides. Basically snap to download. Free of space necessities to state titles and sub titles. Modify PPT manage, inventive style, substance, shading and plan as showed by your style. Can be effortlessly changed over into PDF or JPG gatherings. High declaration slides portrayals.
-
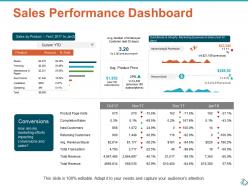 Sales performance dashboard ppt show infographic template
Presenting this set of slides with name - Sales Performance Dashboard Ppt Show Infographic Template. This is a four stage process. The stages in this process are Business, Planning, Strategy, Marketing, Management.
-
 1214 human brain pie chart for business result analysis powerpoint slide
We are proud to present our 1214 human brain pie chart for business result analysis powerpoint slide. This power point template slide has been crafted with graphic of human brain and pie chart. This PPT slide also contains the concept of result analysis based on data. Use this PPT slide for your business intelligence related presentations.
-
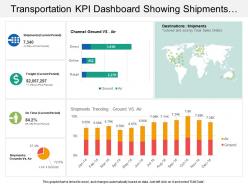 Transportation kpi dashboard snapshot showing shipments ground vs air channel
Presenting our transportation KPI dashboard snapshot showing shipments ground vs. air channel PPT slide. This layout is compatible with Google slides and data can be updated with excel linked file. This template is Excel linked just right click to input your information. Images do no blur out even when they are projected on large screen.PPT template can be utilized by sales and marketing teams and business managers. Instantly downloadable slide and supports formats like JPEG and PDF.
-
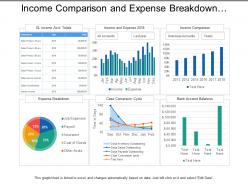 Income comparison and expense breakdown utilities dashboard
Presenting this set of slides with name - Income Comparison And Expense Breakdown Utilities Dashboard. This is a six stage process. The stages in this process are Utilities, Use, Advantage.
-
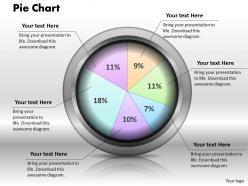 0414 pie chart to compare data powerpoint graph
We are proud to present our 0414 pie chart to compare data powerpoint graph. Use Our Pie Chart To Compare Data Powerpoint Graph Power Point Templates To Weave A Web Of Your Great Ideas. They Are Guaranteed To Attract Even The Most Critical Of Your Colleagues. Our Pie Chart To Compare Data Powerpoint Graph Power Point Templates Are Designed To Help You Succeed. They Have All The Ingredients You Need.
-
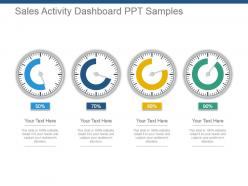 Sales activity dashboard snapshot ppt samples
Presenting sales activity dashboard snapshot ppt samples. This is a sales activity dashboard ppt samples. This is a four stage process. The stages in this process are sales, activity, dashboard, financial, strategy.
-
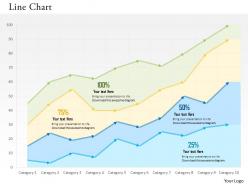 0514 data driven result analysis diagram powerpoint slides
We are proud to present our 0514 data driven result analysis diagram powerpoint slides. This Business Power Point template is designed with data driven result analysis to highlight the result in any business presentation. Create a good impact on your viewers with our unique template collection.
-
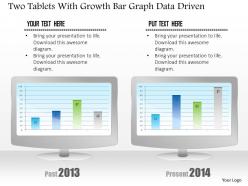 1214 two tablets with growth bar grah data driven powerpoint slide
We are proud to present our 1214 two tablets with growth bar grah data driven powerpoint slide. This power point template slide has been crafted with graphic of two tablets and bar graph. This PPT slide contains the data driven analysis. Use this PPT slide and build presentation for your business growth and financial analysis.
-
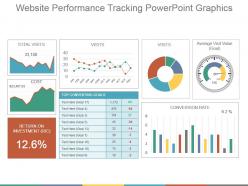 Website performance tracking powerpoint graphics
Presenting website performance tracking powerpoint graphics. This is a website performance tracking powerpoint graphics. This is a three stage process. The stages in this process are total visits, conversion rate, return on investment, average visit value.
-
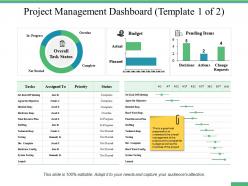 Project management dashboard snapshot ppt professional example introduction
Presenting this set of slides with name - Project Management Dashboard Snapshot Ppt Professional Example Introduction. This is a three stage process. The stages in this process are Percentage, Product, Management, Marketing, Business.
-
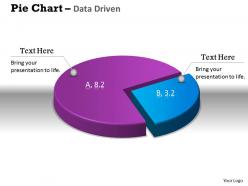 Data driven 3d pie chart shows relative size of data powerpoint slides
We are proud to present our data driven 3d pie chart shows relative size of data powerpoint slides. Let Our Data Driven 3D Pie Chart Shows Relative Size Of Data Powerpoint Slides Power Point Templates Mark The Footprints Of Your Journey. Illustrate How They Will Lead You To Your Desired Destination. Conjure Up Grand Ideas With Our Magical Data Driven 3D Pie Chart Shows Relative Size Of Data Powerpoint Slides Power Point Templates. Leave Everyone Awestruck By The End Of Your Presentation.
-
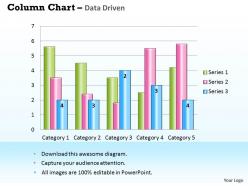 Data driven chart for case studies powerpoint slides
We are proud to present our data driven chart for case studies powerpoint slides. Create A Matrix With Our Data Driven Chart For Case Studies Powerpoint Slides Power Point Templates. Feel The Strength Of Your Ideas Click Into Place. Stir Your Ideas In The Cauldron Of Our Data Driven Chart For Case Studies Powerpoint Slides Power Point Templates. Cast A Magic Spell On Your Audience.
-
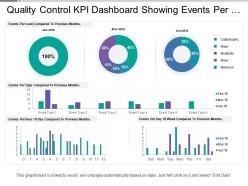 Quality control kpi dashboard showing events per hour and day
Presenting this set of slides with name - Quality Control Kpi Dashboard Showing Events Per Hour And Day. This is a four stage process. The stages in this process are Quality Management, Quality Control, Quality Assurance.
-
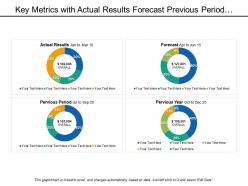 Key metrics with actual results forecast previous period and year
Presenting this set of slides with name - Key Metrics With Actual Results Forecast Previous Period And Year. This is a four stage process. The stages in this process are Key Metrics, Key Performance Indicator, Kpi.
-
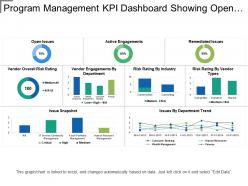 Program management kpi dashboard showing open issues and risk rating
Presenting this set of slides with name - Program Management Kpi Dashboard Showing Open Issues And Risk Rating. This is a three stage process. The stages in this process are Program Development, Human Resource Management, Program Management.
-
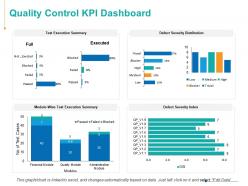 Quality control kpi dashboard ppt powerpoint presentation inspiration example
Presenting this set of slides with name - Quality Control KPI Dashboard Ppt Powerpoint Presentation Inspiration Example. This is a six stage process. The stages in this process are Finance, Analysis, Business, Investment, Marketing.
-
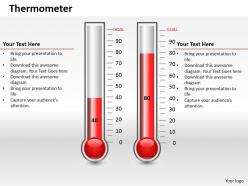 0414 column chart in thermometer style powerpoint graph
PowerPoint infographic fully adaptable with Google slides. Adaptable to wide screen view without the problem of pixilation. Modifiable color, text and font as per the trade requirement. Easy to download and can be turned into JPG and PDF format. Accessibility of addition of logo and trademarks for personalization. Awesome use of colors and innovatively designed. Corresponding designs accessible with different nodes and stages.
-
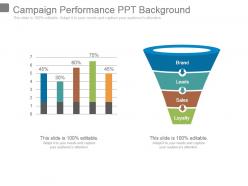 Campaign performance ppt background
Presenting campaign performance ppt background. This is a campaign performance ppt background. This is a two stage process. The stages in this process are brand, leads, sales, loyalty.
-
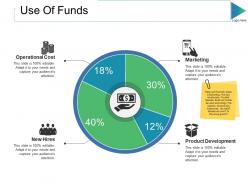 Use of funds ppt slides clipart
Presenting this set of slides with name - Use Of Funds Ppt Slides Clipart. This is a four stage process. The stages in this process are Operational Cost, New Hires, Product Development, Marketing, Business.
-
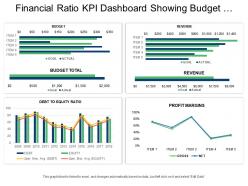 Financial ratio kpi dashboard snapshot showing budget revenue and profit margins
Presenting this set of slides with name - Financial Ratio Kpi Dashboard Snapshot Showing Budget Revenue And Profit Margins. This is a four stage process. The stages in this process are Accounting Ratio, Financial Statement, Financial Ratio.


