- Sub Categories
-
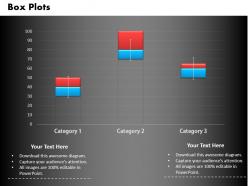 0414 box plots business column chart powerpoint graph
High resolution PowerPoint presentation template. Slide has a creative and professional look. Completely compatible with Google slides. Offers modification in font, colors and shape. Trouble free to download and saves valuable time. Personalization by insertion of company trade name and design. Available in both Standard and Widescreen format. Downloadable PowerPoint template to insert text and share.
-
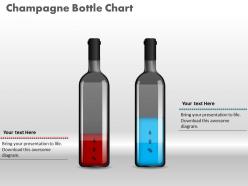 0414 percentage data champagne bottle column chart powerpoint graph
Picture quality does not deter when opened on a big screen display. Trouble-free incorporation of customized content or graphics. Provided guidance to modify the graphical content. Save the presentation visual in JPG or PDF format. Compatible with the online as well as offline PowerPoint softwares. Effectively useful for the Marketing professionals, interpreters and the strategy designers.
-
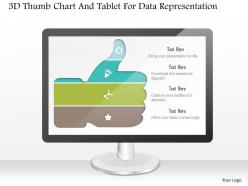 1214 3d thumb chart and tablet for data representation powerpoint slide
We are proud to present our 1214 3d thumb chart and tablet for data representation powerpoint slide. This Power point template slide has been designed with graphic of thumb chart and tablet. These text boxes can be used for data representation. Use this PPT for your business data analysis related presentations.
-
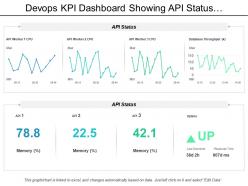 Devops kpi dashboard showing api status and uptime
Presenting this set of slides with name - Devops Kpi Dashboard Showing Api Status And Uptime. This is a four stage process. The stages in this process are Development And Operations, Devops.
-
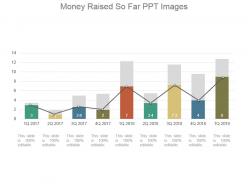 Money raised so far ppt images
Presenting money raised so far PPT images. Change PowerPoint structure, font, text, color and design as per your requirements. Easy data entry options to put in company logo, brand or name .Ideal for marketing professionals, business managers, entrepreneurs and big organizations. This presentation theme is totally attuned with Google slide. Easy conversion to other software’s like JPG and PDF formats. Image quality remains the unchanged even when resize the image or portray on large screens. You can play with shapes and colors to make the chart fitting your brand colors and style.
-
 Lead scoring ppt infographic template
Presenting lead scoring ppt infographic template. This is a lead scoring ppt infographic template. This is a six stage process. The stages in this process are measurable roi on lead generation program, increased conversion rates from qualified lead to opportunity, increased sales productivity and effectiveness, better alignment of marketing and sales efforts, better forecast and pipeline visibility, shortened sales cycle.
-
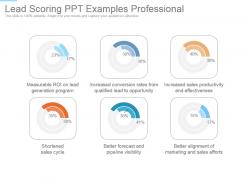 Lead scoring ppt examples professional
Presenting lead scoring ppt examples professional. This is a lead scoring ppt examples professional. This is a six stage process. The stages in this process are measurable roi on lead generation program, increased conversion rates from qualified lead to opportunity, increased sales productivity and effectiveness, shortened sales.
-
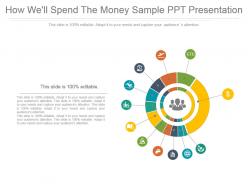 New method for expenditure management sample ppt presentation
Presenting new method for expenditure management sample ppt presentation. This is a new method for expenditure management sample ppt presentation. This is a one stage process. The stages in this process are business, process, marketing, success, icons, strategy, management.
-
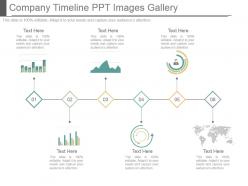 Company timeline ppt images gallery
Presenting company timeline ppt images gallery. This is a company timeline ppt images gallery. This is a six stage process. The stages in this process are business, timeline, icons, strategy, success.
-
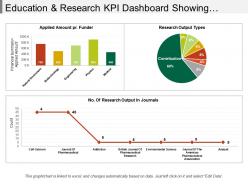 Education and research kpi dashboard Snapshot showing research outputs and amount
Presenting education and research KPI dashboard snapshot showing research outputs and amount PPT slide. The research data metric presentation slide designed by professional team of SlideTeam. The education and research report PPT slide is 100% customizable in PowerPoint. The research amount KPI dashboard slide is also compatible with Google Slide so a user can share this slide with others. A user can make changes in the font size, font type, color as well as dimensions of the research key measure PPT template as per the requirement. You may edit the value in the research key measure PPT template as the slide gets linked with the Excel sheet.
-
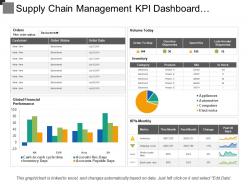 Supply chain management kpi dashboard showing order status volume and inventory
Presenting this set of slides with name - Supply Chain Management Kpi Dashboard Showing Order Status Volume And Inventory. This is a two stage process. The stages in this process are Demand Forecasting, Predicting Future Demand, Supply Chain Management.
-
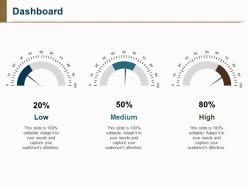 Dashboard Snapshot ppt slide templates
Presenting dashboard snapshot PPT slide templates PPT slide. The speedometer dashboard excel presentation template designed by the designers of SlideTeam to give presentation on various subjects. The speedometer icon dashboard PPT slide is 100% editable in PowerPoint. The speedometer dashboard excel template is compatible with Google Slide and the template gets linked with Excel data sheet. You can make changes in the font size, font type, color as well as dimensions of the circular icons in the dashboard speedometer slide as per the requirement.
-
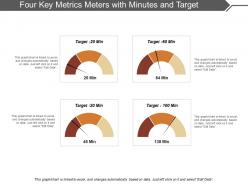 Four key metrics meters with minutes and target
This highly professional PPT design is completely customizable; you can modify and personalize the design according to your business requirements. You can include business name, logo, and trademark into the design to make it personalized design. The design slides are easily downloadable on a single click into JPEG and PDF formats and can be opened with Google Slides and Microsoft PowerPoint software.
-
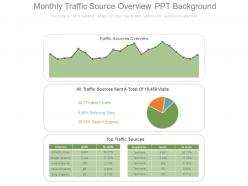 Monthly traffic source overview ppt background
Presenting monthly traffic source overview ppt background. This is a monthly traffic source overview ppt background. This is a four stage process. The stages in this process are traffic sources overview, direct traffic, referring sites, search engines.
-
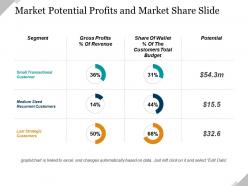 Market potential profits and market share ppt presentation
Presenting market potential profits and market share ppt presentation. This is a market potential profits and market share ppt presentation. This is a six stage process. The stages in this process are business, finance, marketing, strategy, success, analysis.
-
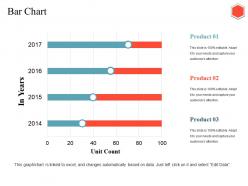 Bar chart ppt inspiration
Presenting this set of slides with name - Bar Chart Ppt Inspiration. This is a three stage process. The stages in this process are Bar Chart, Business, Finance, Analysis, Management.
-
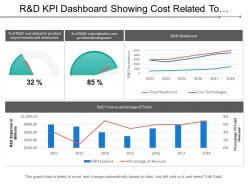 R and d kpi dashboard showing cost related to product improvements and extensions
Presenting this set of slides with name - R And D Kpi Dashboard Showing Cost Related To Product Improvements And Extensions. This is a four stage process. The stages in this process are R And D, Research And Development, Research And Technological Development.
-
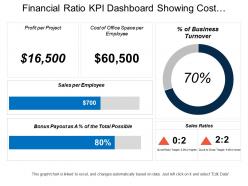 Financial ratio kpi dashboard showing cost of office space per employee and sales per employee
Presenting this set of slides with name - Financial Ratio Kpi Dashboard Showing Cost Of Office Space Per Employee And Sales Per Employee. This is a two stage process. The stages in this process are Accounting Ratio, Financial Statement, Financial Ratio.
-
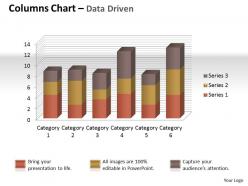 Data driven 3d chart for quality characterstics powerpoint slides
We are proud to present our data driven 3d chart for quality characterstics powerpoint slides. A bar graph is composed of discrete bars that represent different categories of data. The length or height of the bar is equal to the quantity within that category of data. Bar graphs are best used to compare values across categories.
-
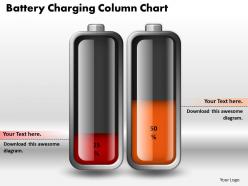 0414 battery charging column chart powerpoint graph
We are proud to present our 0414 battery charging column chart powerpoint graph. Our Battery Charging Column Chart PowerPoint Graph Powerpoint Templates give you the basic framework of your talk. Give it the shape you desire with your wonderful views. Our Battery Charging Column Chart PowerPoint Graph Powerpoint Templates are the lungs of your talk. Fill them with the oxygen of your indepth thought process.
-
 0414 doubtful man bar chart illustration powerpoint graph
Completely editable PPT slide including fonts, visuals, text, colors, etc. Compatible with number of software options. Excellence in picture quality. Slides can be easily inserted in an ongoing presentation. Beneficial for investors, shareholders, financiers, professors, students, marketers, sales people, etc. Presentation design can be displayed in standard and widescreen view. Personalize the presentation with individual company name and logo.
-
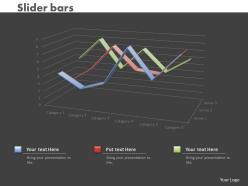 0414 slider line chart business illustration powerpoint graph
Easy data input like company logo, name or trademark. This PowerPoint icon is completely compatible with Google slides. Great for entrepreneurs, marketing and sales persons. Change PPT layout, font, text, color and blueprint as per your approach. Quick downloading speed and formats can be changed to JPEG and PDF. Quality of picture remain unaffected even when we resize the image.
-
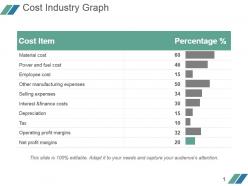 Cost industry graph powerpoint slide background image
Presenting cost industry graph powerpoint slide background image. This is a cost industry graph powerpoint slide background image. This is a ten stage process. The stages in this process are cost item, material cost, power and fuel cost, employee cost, other manufacturing expenses, selling expenses, interest and finance costs, depreciation, tax, operating profit margins, net profit margins, percentage.
-
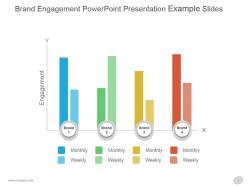 Brand engagement powerpoint presentation example slides
Presenting brand engagement powerpoint presentation example slides. This is a brand engagement powerpoint presentation example slides. This is a four stage process. The stages in this process are engagement, monthly, weekly, brand.
-
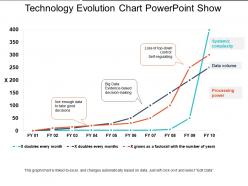 Technology evolution chart powerpoint show
Introducing technology evolution chart PowerPoint slide. Informational PPT structure altogether valuable for IT experts, IT managers and other IT professionals, business specialists, and more. Advantageous PPT Image which offers a scope to add the organization name, structure, or symbol or logo. Consonant with all other accessible software applications and Google Slides. Highlights such as the image, style, text, font, color and more. are also 100% editable.
-
 Trend analysis report powerpoint shapes
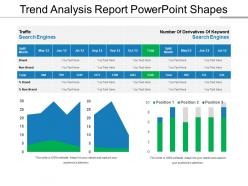
Presenting Trend Analysis Report PowerPoint Shapes. Customize the slide as per your wants. You are free to change anything in the slide. Modify the colors, background, font type, and font size. It can be transformed and saved in various formats like JPG, PNG, PDF, and JPEG. The slide goes well with the Google Slides and major Microsoft versions. It can be viewed on standard screen size and widescreen size as well.
-
 Project progress with task assign priority status and meter with different rating
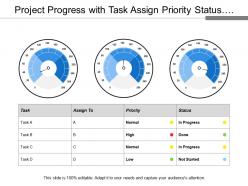
Presenting this set of slides with name - Project Progress With Task Assign Priority Status And Meter With Different Rating. This is a three stage process. The stages in this process are Project Progress, Project Growth, Project Management.
-
 Inventory and logistics products to reorder dashboards
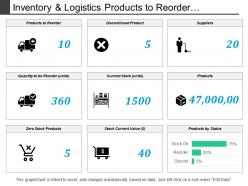
Presenting this set of slides with name - Inventory And Logistics Products To Reorder Dashboards. This is a three stage process. The stages in this process are Inventory And Logistics, Inventory Management, Warehousing And Inventory Management.
-
 0514 data driven business chart diagram powerpoint slides
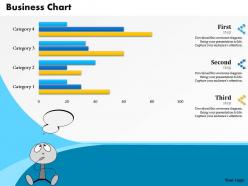
We are proud to present our 0514 data driven business chart diagram powerpoint slides. This Business Power Point template is designed with business concept bar chart based on data driven analysis. Use this template and show your skills.
-
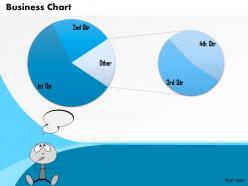 0514 two result business pie chart data driven powerpoint slides
Works vigorously without issues on all compatible software. Easy to convert to JPG and PDF formats. Pixelation does not happen when slide is projected on widescreen. Compatible with google slides for more shared information access. High resolution PPT graphics for crispness. Amendable layout including font, text, color, design. Add company logo, trademark without worries. Zero space constraints when adding titles and sub titles to the design. Employable in businesses, small and major, startups, educational institutes, project management firms and more.
-
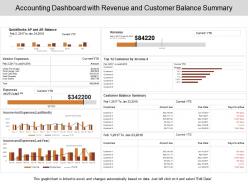 Accounting dashboard with revenue and customer balance summary
Pre-designed accounting dashboard with revenue and customer balance summary PPT template. High-resolution PowerPoint presentation backgrounds for better clarity of the information displayed. Offers wide variety of options and colors to alter the appearance. Allows adding of enterprise personal details such as brand name, logo and much more. Enough space available to enter text and its related points in the PPT slide. This slide is available in both Standard and Widescreen slide size. Compatible with multiple formats like JPEG, PDF and Google slides.
-
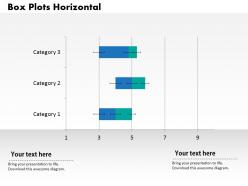 0414 box plots horizontal bar chart powerpoint graph
We are proud to present our 0414 box plots horizontal bar chart powerpoint graph. Deadlines are an element of todays workplace. Our 0414 Box Plots Horizontal Bar Chart Powerpoint Graph Powerpoint Templates help you meet the demand. Just browse and pick the slides that appeal to your intuitive senses. Our 0414 Box Plots Horizontal Bar Chart Powerpoint Graph Powerpoint Templates will help you be quick off the draw. Just enter your specific text and see your points hit home.
-
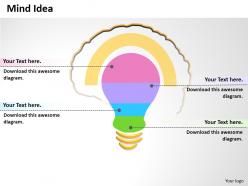 0414 brainwriting idea bar chart powerpoint graph
Fully editable PowerPoint design. Professional use of colors and shapes. Great in picture and pixel quality. PPT template can be shown in standard and widescreen view. Presentation slide is fully editable to allow customization for font, text, colors, etc. Simple to download and convert into PDF format. Compatible with software options such as JPEG and PDF. Valuable for technology administrators, professionals, software engineering team, IT executives etc.
-
 0414 brilliant idea bar chart illustration powerpoint graph
Skillful use of colors and shapes. Presentation design can be presented in standard and widescreen view. Great in picture and pixel quality. PPT slide friendly with Google slides. PowerPoint template design is editable to allow customization with size and text. Convenient download and easy to adjust into PDF format. Friendly with software options such as JPEG and PDF. Useful for business growth, success, vision, achievement etc.
-
 0414 dotted line business chart powerpoint graph
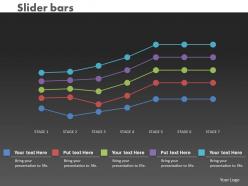
Presentable and easy to comprehend info graphic format. The presentation template can be downloaded and saved in any desired format. Privilege of insertion of logo and trademarks for more personalization. Adaptable to wide screen view without the problem of pixilation. Beneficial and productive insight for industry professionals, teachers, students, strategists and management planners.
-
 0414 thermometer designed column chart powerpoint graph
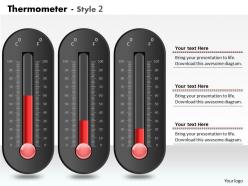
PPT slide is compatible with Google slide. High resolution. PPT visual is useful to businessmen, academicians, for science, weather and science projections. Presentation slide show helps to insert links of stored files and can be used t create animated GIF if required. PPT graphic can be optimized and viewed in tablets, phone, widescreen monitors and projector screens.
-
 Comparison chart design powerpoint graphics
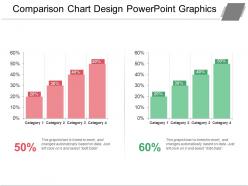
Presenting comparison chart design PowerPoint graphics PPT slide. The bar chart diagram slide specially designed by SlideTeam for professionals for sharing the required strategies for project or process. The chart design slide is 100% editable in PowerPoint and gets synced with Google Slides. A user can easily edit the font type, font size, color & size of bar graph and aspect ratios of this template, without affecting template's quality. The text placeholder is editable and you can edit as per your preference.
-
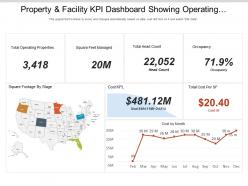 Property and facility kpi dashboard showing operating properties headcount and occupancy
Showing, property and facility KPI dashboard showing operating properties headcount and occupancy PowerPoint Presentation Slide. This Presentation has been designed under the keen supervision of professionals and is fully editable. You can have the feasibility to change the font size, font type, colors, and even the background. This Template is obedient with Google Slide and can be saved in JPG or PDF format without any fuss created during the saving process. Fast download at the click of the button provided below.
-
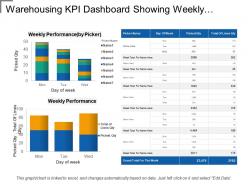 Warehousing kpi dashboard showing weekly performance by picker
The best part of this PPT design is the use of excel linked editable charts. You can change your business related information, statistics and figures in excel sheet and changes will reflect in PPT design. PPT design is 100% editable; you can change the design elements according to your business needs. You can download and save this design as JPEG or PDF formats. Design is fully supported on Google Slides and MS PowerPoint software.
-
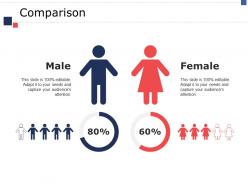 Comparison ppt infographics diagrams
Presenting this set of slides with name - Comparison Ppt Infographics Diagrams. This is a two stage process. The stages in this process are Male, Female, Comparison.
-
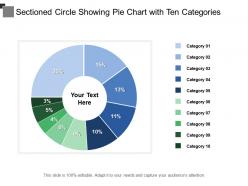 Sectioned circle showing pie chart with ten categories
Presenting sectioned circular presentation template. This PowerPoint presentation template is fully customizable and is designed by professionals looking for an impressive visual presentation. The user can edit the objects in the slide like font size and font color without going through any fuss. This presentation slide is 100% compatible with Google Slide and can be saved in JPG or PDF file format easily. Fast download this at a click of the button.
-
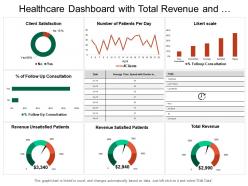 Healthcare dashboard with total revenue and patients per day
Presenting this set of slides with name - Healthcare Dashboard With Total Revenue And Patients Per Day. This is a six stage process. The stages in this process are Healthcare, Health Improvement, Medical Care.
-
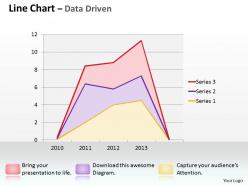 Data driven line chart shows revenue trends powerpoint slides
We are proud to present our data driven line chart shows revenue trends powerpoint slides. This PowerPoint diagram helps you chart the course of your presentation.This unique image makes your presentations professional and interactive. Deliver amazing presentations to mesmerize your audience.
-
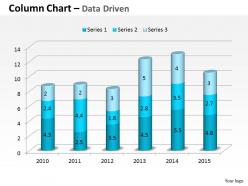 Data driven 3d compare yearly business performance powerpoint slides
We are proud to present our data driven 3d compare yearly business performance powerpoint slides. Our Data Driven 3D Compare Yearly Business Performance Powerpoint Slides Power Point Templates Are The Layers Of Your Gourmet Cake. Provide The Icing Of Your Ideas And Produce A Masterpiece. Use Our Data Driven 3D Compare Yearly Business Performance Powerpoint Slides Power Point Templates And Feel The Difference. Right Off They Generate A Surge Of Interest.
-
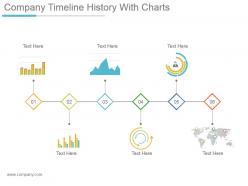 Company timeline history with charts powerpoint slide introduction
Presenting company timeline history with charts powerpoint slide introduction. This is a company timeline history with charts powerpoint slide introduction. This is a six stage process. The stages in this process are business, planning, process, icons, strategy.
-
 Market potential market penetration and market share ppt images gallery
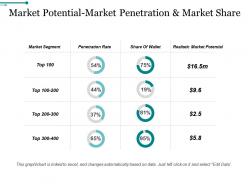
Presenting market potential market penetration and market share ppt images gallery. This is a market potential market penetration and market share ppt images gallery. This is a eight stage process. The stages in this process are market segment, penetration rate, share of wallet, realistic market potential.
-
 Donut pie chart ppt background
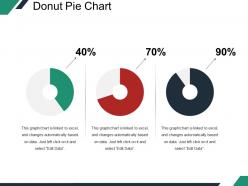
Presenting Donut Pie Chart PPT Background. This PPT presentation is Google Slides compatible hence it is easily accessible. You can download and save this PowerPoint layout in different formats like PDF, PNG, and JPG. This PPT theme is available in both 4:3 and 16:9 aspect ratios. This PowerPoint template is customizable so you can modify the font size, font type, color and shapes as per your requirements.
-
 Donut pie chart ppt portfolio summary
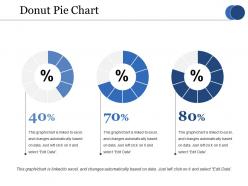
Presenting this set of slides with name - Donut Pie Chart Ppt Portfolio Summary. This is a three stage process. The stages in this process are Percentage, Finance, Donut, Business.
-
 Bar graph powerpoint slide template
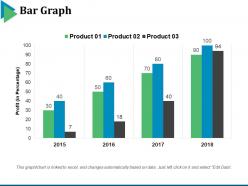
Presenting this set of slides with name - Bar Graph Powerpoint Slide Template. This is a three stage process. The stages in this process are Profit, Years, Business, Marketing, Finance, Graph.
-
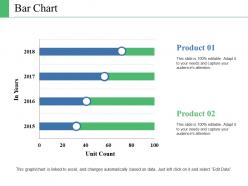 Bar chart ppt background graphics
Presenting a PowerPoint slide named Bar chart PPT background graphics. Use this completely customizable and easy-to-edit PPT slide to communicate your ideas in the presentation. You can format the font size, color and style of the slide. Background color can be altered too. Add your desired content anywhere in the slide. It’s compatibility with Google slides make it readily accessible. You can save it in PDF as well as JPG formats. This PPT template offers a simple and fresh design with lots of icons to choose from. This PPT slide is Excel-linked also. Have an engaging presentation ready in minutes with this PPT template.
-
 Training timeline process ppt infographics example introduction
Presenting this set of slides with name - Training Timeline Process Ppt Infographics Example Introduction. This is a six stage process. The stages in this process are Timeline, Business, Planning, Management, Process.
-
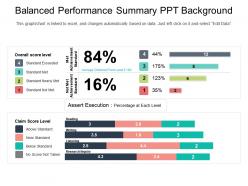 Balanced performance summary ppt background
Presenting Balanced Performance Summary PPT Background which is professionally designed and 100% editable. You can customize the color, fonts, font size and font types as per the requirement. This slide is adaptable with the Google Slides which makes it easily accessible at once. Can be converted into formats like PDF, JPG and PNG. It is available in both standard and widescreen. You can modify the shape of the diagram which makes your presentation look even more engaging.
-
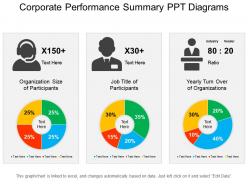 Corporate performance summary ppt diagrams
Presenting a PPT template named Corporate Performance Summary PPT Diagram. You can edit the color, style and size of the font. You can replace and rewrite the text as per your requirement. Add or delete the content anywhere in the deck of PPT slides. We at SlideTeam offer you with high-quality visuals and graphics to enhance your presentation. Provide your audience with the needful visual aid by using this template. This PowerPoint slide is compatible with Google Slides. You can export the slide anywhere in any format like JPG or PDF formats.
-
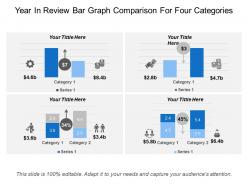 Year in review bar graph comparison for four categories
Presenting this set of slides with name - Year In Review Bar Graph Comparison For Four Categories. This is a four stage process. The stages in this process are Year In Review, Year Highlights, Countdowns.
-
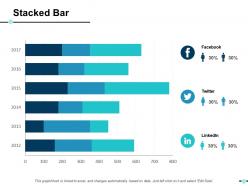 Stacked bar ppt slides summary
Presenting this set of slides with name - Stacked Bar Ppt Slides Summary. This is a three stage process. The stages in this process are Business, Management, Strategy, Analysis, Marketing.
-
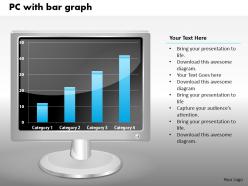 0414 column chart graph on pc powerpoint graph
We are proud to present our 0414 column chart graph on pc powerpoint graph. Our 0414 Column Chart Graph On PC Powerpoint Graph Powerpoint Templates are creatively constructed and eye catching. Focus attention on the key issues of your presentation. Use our 0414 Column Chart Graph On PC Powerpoint Graph Powerpoint Templates and nail the day. Lead your team show them the way.
-
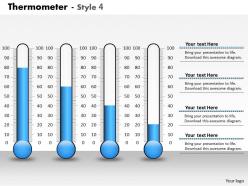 0414 increasing flow thermometer column chart powerpoint graph
We are proud to present our 0414 increasing flow thermometer column chart powerpoint graph. Our Increasing Flow Thermometer Column Chart Powerpoint Graph Powerpoint Templates are the layers of your gourmet cake. Provide the icing of your ideas and produce a masterpiece. Use our Increasing Flow Thermometer Column Chart Powerpoint Graph Powerpoint Templates and and feel the difference. Right off they generate a surge of interest.
-
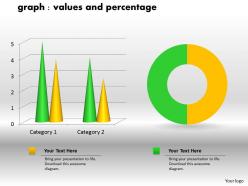 0414 percentage values donut and column chart powerpoint graph
Easy proofing and editing is added on feature of presentation visual. Presentation slide is useful in business marketing, management and recourse disbursement. Basic theme yet it can modified with respect to font, color and layout. Attractive color scheme gives a professional look to PPT layout. Conversion into PDF or JPG formats is very easy and handy. PPT graphic offers font size which can be read from a distance.
-
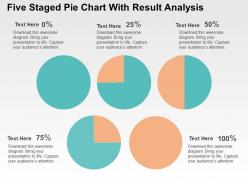 Five staged pie chart with result analysis powerpoint slides
Modifiable PPT Slide with pie diagrams with rate and symbols. Perfect with various arrangement alternatives like JPEG, JPG or PDF. Gives an expert standpoint to your PowerPoint introduction. Symbols are likewise being included. Customization of each PowerPoint realistic and content as indicated by your craving and need. Accessible in Widescreen slide estimate too. Opportunity to alter it with organization name and logo.
-
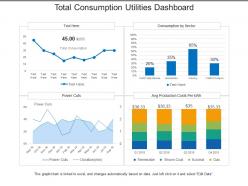 Total consumption utilities dashboard
Presenting this set of slides with name - Total Consumption Utilities Dashboard. This is a four stage process. The stages in this process are Utilities, Use, Advantage.


