- Sub Categories
-
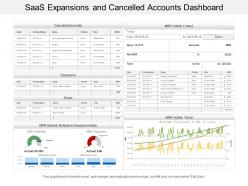 Saas expansions and cancelled accounts dashboard
Presenting Saas expansions and cancellation accounts dashboard PPT template. Download is quick and can be easily shared. Conveys a sense of change over time. Suitable for corporate leaders and business associates. Flexible PPT slide as can be used whenever required. PowerPoint design can be shared in Standard and Widescreen view. High quality graphics and visuals used in the PPT. Option to include business content i.e. name, logo and text. Effortless conversion into PDF/ JPG format. Can be easily merged with your ongoing presentation slides.
-
 0514 3d graphic of scientific thermometer powerpoint slides
We are proud to present our 0514 3d graphic of scientific thermometer powerpoint slides. 3d graphic of dollar bag is used in this Business Power Point template. Use this template for financial presentations based on data driven analysis.
-
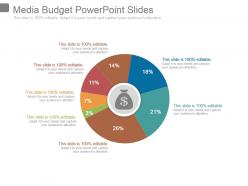 Media budget powerpoint slides
Presenting media budget powerpoint slides. This is a media budget powerpoint slides. This is a seven stage process. The stages in this process are donut, strategy, management, finance, business.
-
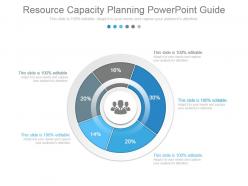 Resource capacity planning powerpoint guide
Presenting resource capacity planning powerpoint guide. This is a resource capacity planning powerpoint guide. This is a five stage process. The stages in this process are business, process, marketing, management, strategy, success.
-
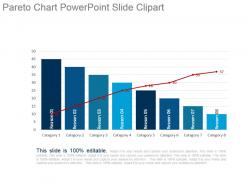 Pareto chart powerpoint slide clipart
Presenting pareto chart powerpoint slide clipart. This is a pareto chart powerpoint slide clipart. This is a eight stage process. The stages in this process are category, reason.
-
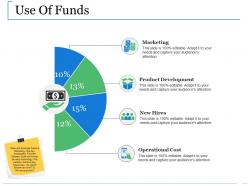 Use of funds ppt slides gallery
Presenting this set of slides with name - Use Of Funds Ppt Slides Gallery. This is a four stage process. The stages in this process are Business, Operational Cost, New Hires, Product Development, Marketing.
-
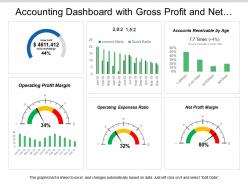 Accounting dashboard with gross profit and net profit margin
Introducing accounting dashboard with gross profit and net profit margin PPT slideshow. Loaded with incomparable benefits. Readymade PPT graphic helps in saving time and effort. Can be personalized by adding company trademark, logo, brand and symbols. Can be utilized for displaying both simple and complex information. Include or exclude slide content as per your individual need. Colors and text can be easily changed as the PPT slide is completely editable. Useful for every business leader and professional, project management team, business analysts, etc.
-
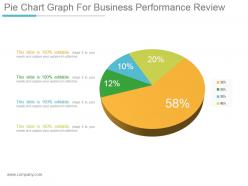 Pie chart graph for business performance review ppt design templates
Presenting pie chart graph for business performance review ppt design templates. This is a pie chart graph for business performance review ppt design templates. This is a four stage process. The stages in this process are pie, percentage, business, finance, marketing.
-
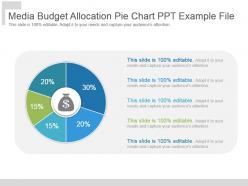 Media budget allocation pie chart ppt example file
Presenting media budget allocation pie chart ppt example file. This is a media budget allocation pie chart ppt example file. This is a five stage process. The stages in this process are business, marketing, strategy, management, success.
-
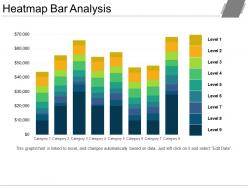 Heatmap bar analysis
Presenting the Heatmap Bar Analysis PowerPoint slide. This ready to use PowerPoint presentation can be downloaded in various formats like PDF, JPG and PNG. You can change the color, font size, font type and shapes of this PPT layout according to your needs. This PPT template is compatible with Google Slides and is available in both 4:3 and 16:9 aspect ratios.
-
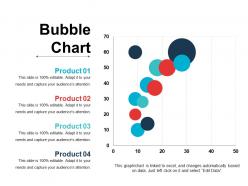 Bubble chart powerpoint slide design templates
Presenting bubble chart powerpoint slide design templates. This is a bubble chart powerpoint slide design templates. This is a four stage process. The stages in this process are bubble, business, marketing, finance, graph.
-
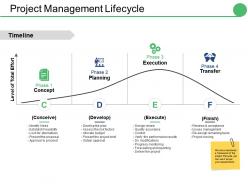 Project management lifecycle ppt gallery images
Presenting this set of slides with name - Project Management Lifecycle Ppt Gallery Images. This is a four stage process. The stages in this process are Concept, Planning, Execution, Transfer, Develop.
-
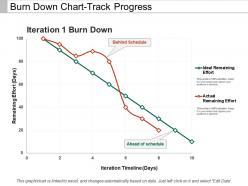 Burn down chart-track progress
Presenting this set of slides with name - Burn Down Chart-Track Progress. This is a two stage process. The stages in this process are Burn Down Chart, Agile Software Development Chart, Run Chart.
-
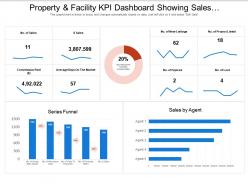 Property and facility kpi dashboard showing sales and properties listed
Presenting, property and facility KPI dashboard showing sales and properties listed PowerPoint Presentation Slide. This Presentation has been designed under the strict supervision of professionals and is fully editable. You can have access to play with the font size, font type, colors, and even the background. This Template is manageable with Google Slide and can be saved in JPG or PDF format without any hassle created during the saving process. Fast download at the click of the button shown below.
-
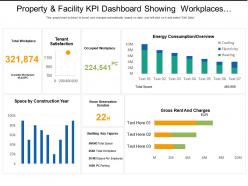 Property and facility kpi dashboard showing workplaces and energy consumption
Introducing, property and facility KPI dashboard showing workplaces and energy consumption warehousing KPI dashboard PowerPoint Presentation Slide. This Presentation has been designed professionally and is fully editable. You can reshape the font size, font type, colors, and even the background. This Template is cordial with Google Slide and can be saved in JPG or PDF format without any resistance created. Fast download at the click of the button.
-
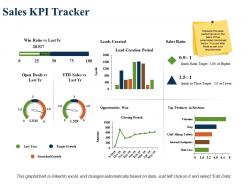 Sales kpi tracker lead creation period sales ratio
Presenting this set of slides with name - Sales Kpi Tracker Lead Creation Period Sales Ratio. This is a three stage process. The stages in this process are Leads Created, Sales Ratio, Top Products In Revenue, Opportunities Won, Stretched Growth.
-
 Healthcare dashboard with admission by division and overall patient satisfaction
Presenting this set of slides with name - Healthcare Dashboard With Admission By Division And Overall Patient Satisfaction. This is a seven stage process. The stages in this process are Healthcare, Health Improvement, Medical Care.
-
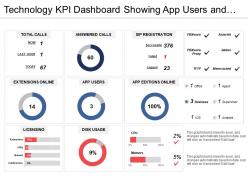 Technology kpi dashboard showing app users and disk usage
Presenting this set of slides with name - Technology Kpi Dashboard Showing App Users And Disk Usage. This is a nine stage process. The stages in this process are Technology, IT, IOT.
-
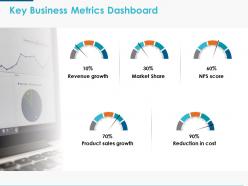 Key business metrics dashboard ppt powerpoint presentation icon clipart
Presenting this set of slides with name Key Business Metrics Dashboard Ppt Powerpoint Presentation Icon Clipart. This is a five process. The stages in this process are Finance, Analysis, Business, Investment, Marketing. This is a completely editable PowerPoint presentation and is available for immediate download. Download now and impress your audience.
-
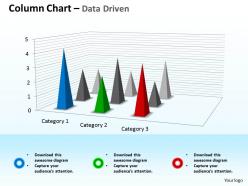 Data driven 3d chart for business observation powerpoint slides
We are proud to present our data driven 3d chart for business observation powerpoint slides. A bar graph is composed of discrete bars that represent different categories of data. The length or height of the bar is equal to the quantity within that category of data. Bar graphs are best used to compare values across categories.
-
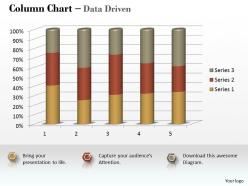 Data driven 3d statistical process column chart powerpoint slides
We are proud to present our data driven 3d statistical process column chart powerpoint slides. Use Our Data Driven 3D Statistical Process Column Chart Powerpoint Slides Power Point Templates Get Your Audience In Sync. Grab Their Eyeballs They Won?t Even Blink. You Work The Stage With An Air Of Royalty. Let Our Data Driven 3D Statistical Process Column Chart Powerpoint Slides Power Point Templates Be The Jewels In Your Crown.
-
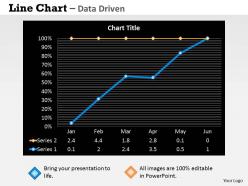 Data driven economic status line chart powerpoint slides
We are proud to present our data driven economic status line chart powerpoint slides. Kick Up A Storm With Our Data Driven Economic Status Line Chart Powerpoint Slides Power Point Templates. The Heads Of Your Listeners Will Swirl With Your Ideas. Ascend The Ladder Of Success With Ease. Our Data Driven Economic Status Line Chart Powerpoint Slides Power Point Templates Will Provide Strong And Sturdy Steps.
-
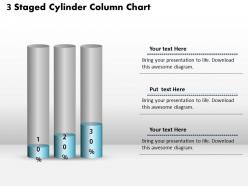 0414 3 staged cylinder column chart powerpoint graph
Incredibly amicable PPT design entirely useful for trade professionals, trade experts etc. from diverse areas , Comprehensive and convenient PPT Images with ductile dummy data options with an alternate to add company name, design or symbol, Consonant with all available graphic software’s and Google slides, Totally accessible into other file configurations like PDF or JPG. Features as background images, styles, texts and other characteristics are fully editable, Expeditious downloading process.
-
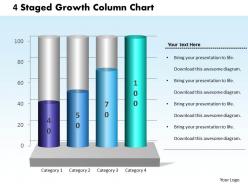 0414 4 staged growth column chart powerpoint graph
We are proud to present our 0414 4 staged growth column chart powerpoint graph. Our 4 Staged Growth Column Chart PowerPoint Graph Powerpoint Templates will generate and maintain the level of interest you desire. They will create the impression you want to imprint on your audience. Our 4 Staged Growth Column Chart PowerPoint Graph Powerpoint Templates are effectively colour coded to priorities your plans. They automatically highlight the sequence of events you desire.
-
 0414 human mind with an idea pie chart powerpoint graph
Extremely powerful PPT presentation tools, helps in the generation of innovative ideas. Portrays a completely professional image of your enterprise. Adds a hint of glace to the entire presentation. Makes the information easily understandable and adaptable. Fits into any presentation easily and effortlessly. Allows insertion of titles and subtitles. Provides instant downloading to save your valuable time.
-
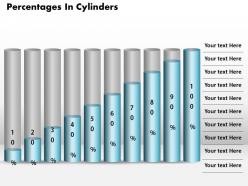 0414 percentage in cylinders 10 stages column chart powerpoint graph
Easy proofing and editing is added on feature of presentation visual. Presentation slide is useful in business marketing, management and recourse disbursement. Basic theme yet it can modified with respect to font, color and layout. Attractive color scheme gives a professional look to PPT layout. Conversion into PDF or JPG formats is very easy and handy. PPT graphic offers font size which can be read from a distance. Shapes are in vector format and can be edited.
-
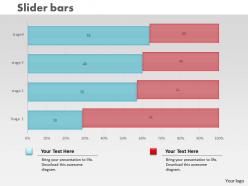 0414 slider bar chart for data sets powerpoint graph
We are proud to present our 0414 slider bar chart for data sets powerpoint graph. Hit the ground running with our Slider Bar Chart For Data Sets Powerpoint Graph Powerpoint Templates. Go the full distance with ease and elan. Leave a lasting impression with our Slider Bar Chart For Data Sets Powerpoint Graph Powerpoint Templates. They possess an inherent longstanding recall factor.
-
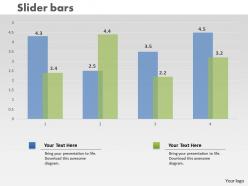 0414 slider column chart for business presenations powerpoint graph
Easily editable presentation layout as color, text and font are editable. PowerPoint designs are totally compatible with Google slides. Effortlessly download and changeable into JPEG and PDF document. Choice of insertion of corporate symbol and image for personalization. Presentable and easy to comprehend info graphic format. PPT slide can be presented in both standard and widescreen view. Excel linked design so you can make changes in the excel sheet and the design will change accordingly.
-
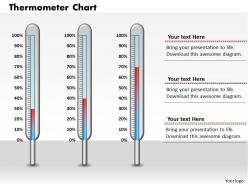 0414 three thermometers column chart powerpoint graph
We are proud to present our 0414 three thermometers column chart powerpoint graph. Our Three Thermometers Column Chart Powerpoint Graph Powerpoint Templates provide you the cutting edge. Slice through the doubts in the minds of your listeners. You aspire to touch the sky with glory. Let our Three Thermometers Column Chart Powerpoint Graph Powerpoint Templates provide the fuel for your ascent.
-
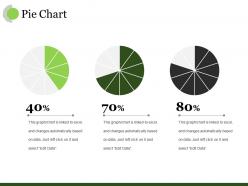 Pie chart ppt sample
Presenting this set of slides with name - Pie Chart Ppt Sample. This is a three stage process. The stages in this process are Business, Marketing, Finance, Planning, Strategy.
-
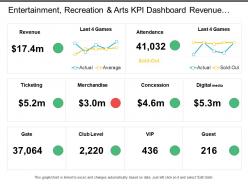 Entertainment recreation and arts kpi dashboard revenue ticketing merchandise vip and guest
Presenting this set of slides with name - Entertainment Recreation And Arts Kpi Dashboard Revenue Ticketing Merchandise Vip And Guest. This is a four stage process. The stages in this process are Entertainment, Recreation And Arts, Attractions, Culture, Entertainment.
-
 Insurance total claims per year and month dashboard
• Bright colors and clarity in graphics • Thoroughly editable slides • Ease of editing the slides with the help of instructions provided. • Easy to download • Comfortably customizable • Of much help to financial analysts, insurance company employees, students and teachers. • High resolution of slide visuals do not let the image pixelate when projected on wide screen • Compatible with latest software options and multiple format types.
-
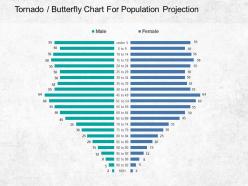 Tornado butterfly chart for population projection powerpoint ideas
Presenting tornado butterfly chart for population projection PowerPoint ideas PPT slide. Presentation is brimming with aesthetic appeal and professional parameters. It’s an uncluttered and intense projection of relevant visuals. Harmonious use of PPT icons, colors, fonts and designs with respect to the subject. There is freedom to execute changes in slide background as per the individual’s preference and flexibility to customize it with company-specific elements like name, logo, and trademark. PPT ensures compatibility with multiple software and format options. There is the use of high resolution and stupendous quality visuals. Used by several business strategists, stakeholders, managers, students, financiers, sales professionals, and entrepreneurs.
-
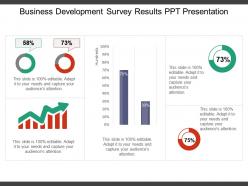 Business development survey results ppt presentation
Presenting business development survey results PPT presentation slideshow PPT which is 100% editable. This PPT template easy to customize and enables you to personalize it as per your own criteria. The presentation slide is data driven that is excel linked chart and fully compatible with Google slides, multiple format and software options. In case of any assistance, kindly take instructions from our presentation design services and it is easy to download in a very short span of time. The images, layouts, designs are of high quality and ensures quality in widescreen.
-
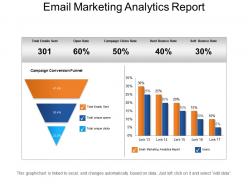 Email marketing analytics report example of ppt
Presenting Marketing Analytics Report PowerPoint Slide Show. Modify the colors, font size and font type as per your needs. You just need to replace the sample text with your text and your presentation will be ready in minutes. This slide is linked to an Excel sheet and can be transformed into JPG and PDF formats. You may add or remove the number of fields according to your requirements. Get this template now in standard screen and widescreen.
-
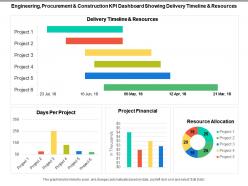 Engineering procurement and construction kpi dashboard showing delivery timeline and resources
Presenting this set of slides with name - Engineering Procurement And Construction Kpi Dashboard Showing Delivery Timeline And Resources. This is a four stage process. The stages in this process are Engineering, Procurement And Construction, Construction Management, Engineering, Purchasing And Construction .
-
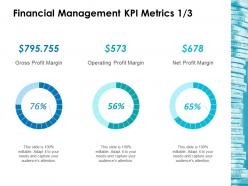 Financial management kpi metrics 1 3 ppt layouts backgrounds
Presenting this set of slides with name - Financial Management Kpi Metrics 1 3 Ppt Layouts Backgrounds. This is a three stage process. The stages in this process are Business, Management, Strategy, Analysis, Marketing.
-
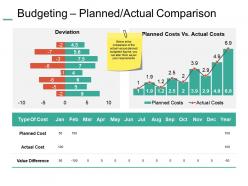 Budgeting planned actual comparison ppt summary example introduction
Presenting Budgeting Planned Actual Comparison PPT Summary Example Introduction. Customize it as per your presentation theme by changing its colors, font type, and font size. You are free to make alterations in the background as well. Convert and save it in JPG, PNG, PDF, and various other file formats. Present it in front of a large segment because of its splendid pixel quality. Its adaptability with the Google Slides makes it accessible at once.
-
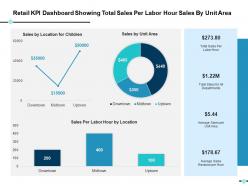 Retail kpi dashboard showing total sales per labor hour sales by unit area ppt slides gallery
Presenting this set of slides with name - Retail Kpi Dashboard Showing Total Sales Per Labor Hour Sales By Unit Area Ppt Slides Gallery. This is a three stage process. The stages in this process are Business, Management, Strategy, Analysis, Marketing.
-
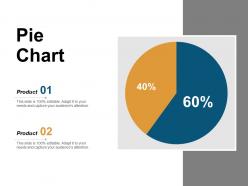 Pie chart ppt powerpoint presentation model information
Presenting this set of slides with name - Pie Chart Ppt Powerpoint Presentation Model Information. This is a two stage process. The stages in this process are Analysis, Financials, Business, Management, Strategy.
-
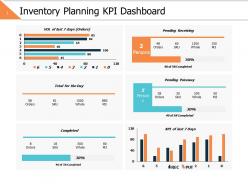 Inventory planning kpi dashboard ppt powerpoint presentation file clipart images
Presenting this set of slides with name - Inventory Planning Kpi Dashboard Ppt Powerpoint Presentation File Clipart Images. This is a six stage process. The stages in this process are Business, Management, Strategy, Analysis, Finance.
-
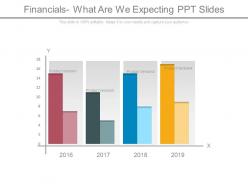 Financials what are we expecting ppt slides
Presenting financials what are we expecting ppt slides. This is a financials what are we expecting ppt slides. This is a four stage process. The stages in this process are analysis, business, marketing, strategy, success.
-
 Gross margin improvement powerpoint templates
Presenting gross margin improvement powerpoint templates. Presenting gross margin improvement powerpoint templates. Presenting gross margin improvement powerpoint templates. This is a gross margin improvement powerpoint templates. This is two stage process. The stages in this process are chart title, gross margin, improvement, strategy, business, success, finance.
-
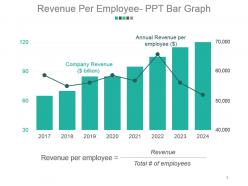 Revenue per employee ppt bar graph powerpoint slide background image
Presenting revenue per employee ppt bar graph powerpoint slide background image. This is a revenue per employee ppt bar graph powerpoint slide background image. This is a eight stage process. The stages in this process are annual revenue per employee, company revenue, revenue per employee, revenue, total number of employees.
-
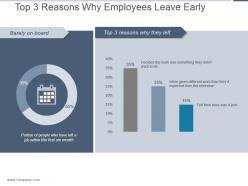 Top 3 reasons why employees leave early sample of ppt
Presenting top 3 reasons why employees leave early sample of ppt. This is a top 3 reasons why employees leave early sample of ppt. This is a two stage process. The stages in this process are decided the work was something they didnt want to do, were given different work than they expected from the interview, felt their boss was a jerk, top 3 reasons why they left, barely on board, portion of people who have left a job within the first six month.
-
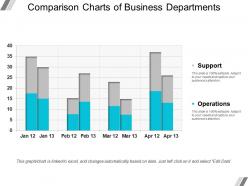 Comparison charts of business departments powerpoint slide themes
Presenting, with our comparison charts of business departments powerpoint slide themes pre-designed flat design for your business comparison plans. We have shown an excellent use of icons, images, and designs. Fit for use by managers, employees, and organizations for professional activity and comparing various parameters. Thoroughly compatible with Google Slides and can be saved in jpg or pdf format without any trouble. We have shown high-quality graphics and icons to ensure that there is no depreciating in quality on increasing their size or editing the design. Download quickly to save time.
-
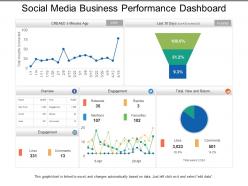 Social media business performance dashboard
Presenting, agile development showing product owner with iteration plan and planning meeting PPT template. This PPT slide can be used for agile development and sprint planning related presentations by experts, students or strategists. All the icons practiced here are 100% editable in PowerPoint software. You can change the color, size, and format of any icon to your liking. Insert your business logo in the PPT slide, which is also compatible with google slides.
-
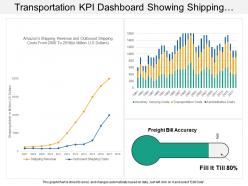 Transportation kpi dashboard showing shipping revenue and outbound shipping costs
Presenting transportation KPI dashboard showing shipping revenue and outbound shipping costs PPT slide. Simple data input like company logo, name or trademark. User can edit the data in linked excel sheet and graphs and charts gets customized accordingly .This PPT slide offers you plenty of space to put in titles and sub titles. High resolution based presentation layout, does not change the image even after resizing. This presentation icon is data driven and template can be downloaded via excel file to incorporate data.
-
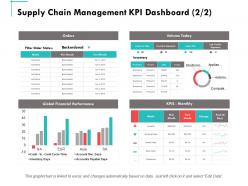 Supply chain management kpi dashboard business ppt powerpoint presentation summary maker
Presenting this set of slides with name - Supply Chain Management Kpi Dashboard Business Ppt Powerpoint Presentation Summary Maker. This is a four stages process. The stages in this process are Finance, Marketing, Management, Investment, Analysis.
-
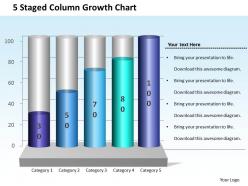 0414 5 staged column growth chart powerpoint graph
Quality images and graphic icons. An easy access to download the slide template. Replace the watermark with your company’s logo or business name. Use your own images and the icons in the slides. Edit the content, size, colors and the orientation of the slide icons. Follow provided instructions to edit and change the slide icons. Advantageous for the Business presenters, Mangers and the employees.
-
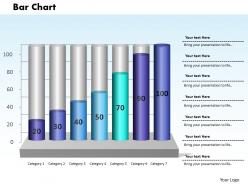 0414 column chart with business growth powerpoint graph
Effortlessly amendable PPT illustration into JPG and PDF. Seamless use of colors in the PowerPoint visual design. Access to include organization badge, icon and picture as required. Matching designs attainable with different nodes and stages. High determination with fabulous picture quality. Quick to download and saves valuable time. Exquisitely crafted Presentation background. Preference to demonstrate slide in standard 4:3 widescreen 16:9 view.
-
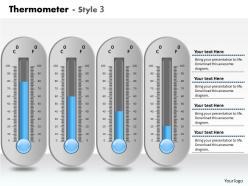 0414 thermometer column chart for business growth powerpoint graph
We are proud to present our 0414 thermometer column chart for business growth powerpoint graph. Our Thermometer Column Chart For Business Growth Powerpoint Graph Powerpoint Templates are creatively constructed and eye catching. Focus attention on the key issues of your presentation. Use our Thermometer Column Chart For Business Growth Powerpoint Graph Powerpoint Templates and nail the day. Lead your team show them the way.
-
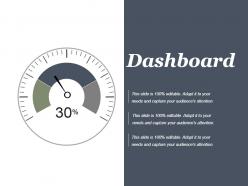 Dashboard powerpoint slide background
Presenting dashboard powerpoint slide background. This is a dashboard powerpoint slide background. This is a one stage process. The stages in this process are dashboard, meter, measure, speed, percentage.
-
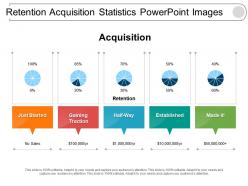 Retention acquisition statistics powerpoint images
Introducing retention acquisition statistics PowerPoint design. This PowerPoint design is adaptable with all software’s operations and all Google Slides. This Presentation slide can also be simply exportable into PDF or JPG file schemes. This PPT image can be displayed in a larger screen ratio with an unaffected high resolution. All the aspects or features of this Presentation graphic like matter, pattern, context, intensity etc. can be manually manageable.
-
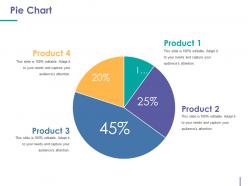 Pie chart powerpoint templates download
Presenting Pie Chart PowerPoint Templates Download. This PPT theme is available in both 4:3 and 16:9 aspect ratios. This PowerPoint template is customizable so you can modify the font size, font type, color and shapes as per your requirements. This PPT presentation is Google Slides compatible hence it is easily accessible. You can download and save this PowerPoint layout in different formats like PDF, PNG, and JPG.
-
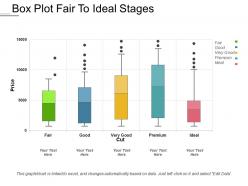 Box plot fair to ideal stages
Presenting box plot fair to ideal stages. This is a box plot fair to ideal stages. This is a five stage process. The stages in this process are box plot, statistical data, whiskers plot, statistical distribution.
-
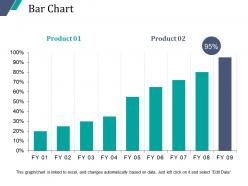 Bar chart sample ppt presentation
Presenting Bar Chart Sample Ppt Presentation Presentation. Our PPT layout is compatible with Google Slides. You can download this PPT theme in various formats like PDF, PNG, and JPG. This PowerPoint template is completely editable and you can modify the font size, font type, and shapes as per your requirements. This PPT slide is available at 4:3 and 16:9 aspect ratios.
-
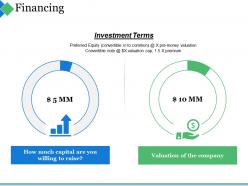 Financing ppt styles structure
Presenting this set of slides with name - Financing Ppt Styles Structure. This is a two stage process. The stages in this process are How Much Capital Are You Willing To Raise, Valuation Of The Company, Investment Terms, Financing.
-
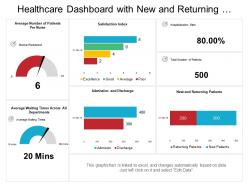 Healthcare dashboard with new and returning patients
Presenting this set of slides with name - Healthcare Dashboard With New And Returning Patients. This is a six stage process. The stages in this process are Healthcare, Health Improvement, Medical Care.
-
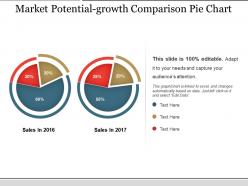 Market potential growth comparison pie chart ppt infographics
Presenting Market Potential Growth Comparison pie chart PPT infographics slide. This presentation diagram is 100% editable in PowerPoint and has been designed by professionals using high-quality graphics. You can customize the font type, font size, colors of the diagram, and background color as per your requirement. Incorporating your company name and logo in this slide is very easy. You can replace the dummy content in text placeholders with your presentation content without any hassle. This slide is fully compatible with Google Slides and can be saved in JPG or PDF format. High quality graphics and icons ensure that there is no deteriorating in quality on enlarging their size.


