- Sub Categories
-
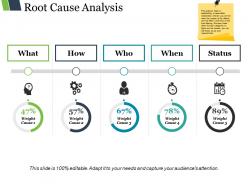 Root cause analysis good ppt example
Presenting Root Cause Analysis Good PPT Example which is designed professionally for your convenience. Change the color, fonts, font size, and font types of the template as per the requirements. The model is readily available in both 4:3 and 16:9 aspect ratio. It is compatible with Google Slides which makes it accessible at once. Can be converted into formats like PDF, JPG, and PNG.
-
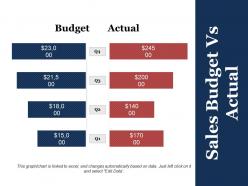 Sales budget vs actual presentation layouts
Presenting this set of slides with name - Sales Budget Vs Actual Presentation Layouts. This is a four stage process. The stages in this process are Business, Marketing, Finance, Strategy, Growth.
-
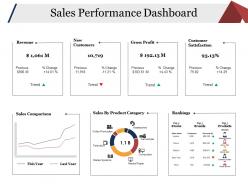 Sales performance dashboard ppt slide examples
Presenting this set of slides with name - Sales Performance Dashboard Ppt Slide Examples. This is a seven stage process. The stages in this process are Revenue, New Customers, Gross Profit, Customer Satisfaction, Sales Comparison.
-
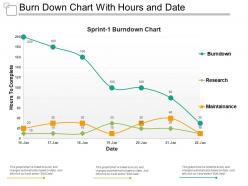 Burn down chart with hours and date
Presenting this set of slides with name - Burn Down Chart With Hours And Date. This is a three stage process. The stages in this process are Burn Down Chart, Agile Software Development Chart, Run Chart.
-
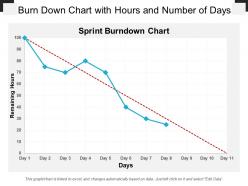 Burn down chart with hours and number of days
Presenting this set of slides with name - Burn Down Chart With Hours And Number Of Days. This is a one stage process. The stages in this process are Burn Down Chart, Agile Software Development Chart, Run Chart.
-
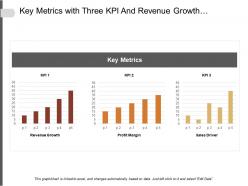 Key metrics with three kpi and revenue growth profit margin and sales driver
Presenting this set of slides with name - Key Metrics With Three Kpi And Revenue Growth Profit Margin And Sales Driver. This is a three stage process. The stages in this process are Key Metrics, Key Performance Indicator, Kpi.
-
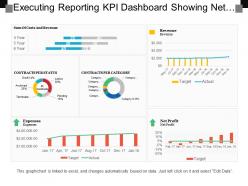 Executing reporting kpi dashboard showing net profit expenses contracts per category
Presenting this set of slides with name - Executing Reporting Kpi Dashboard Showing Net Profit Expenses Contracts Per Category. This is a six stage process. The stages in this process are Executive Reporting, Executive Analysis, Executive Performance.
-
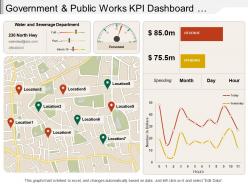 Government and public works kpi dashboard showing water sewerage department
Presenting the KPI dashboard PPT template. This KPI presentation layout is 100% modifiable and is designed professionally. You can edit the objects in this slide like font color and font size without going through any fuss. This presentation template is 100% compatible with Google Slide and can be saved in JPG or PDF file format hassle-free. To download this, click on the button below.
-
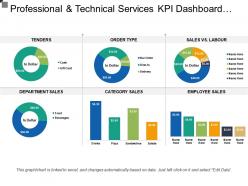 Professional and technical services kpi dashboard showing department sales
Presenting this set of slides with name - Professional And Technical Services Kpi Dashboard Showing Department Sales. This is a six stage process. The stages in this process are Professional And Technical Services, Services Management, Technical Management.
-
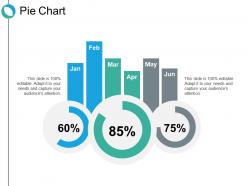 Pie chart ppt show example introduction
Presenting this set of slides with name - Pie Chart Ppt Show Example Introduction. This is a three stage process. The stages in this process are Percentage, Product, Management, Marketing.
-
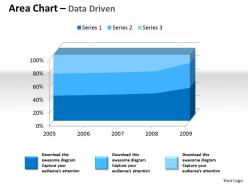 Data driven 3d area chart for quantiative data powerpoint slides
Template formats are altogether impeccable with Google slides. Respectable and straightforward into practical setup. Templates can be downloaded and saved into JPEG and PDF report. Determination to implant business name, logo or sign as per the need. Adaptable to share in widescreen see as pixels don't break. Comparative diagrams open with different centers and stages as required. Simple to adjust shading, content, content style and even shape. Useful for business experts, strategists, and corporate organization trend-setters.
-
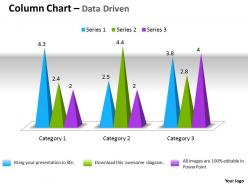 Data driven 3d change in business process chart powerpoint slides
We are proud to present our data driven 3d change in business process chart powerpoint slides. A bar graph is composed of discrete bars that represent different categories of data. The length or height of the bar is equal to the quantity within that category of data. Bar graphs are best used to compare values across categories.
-
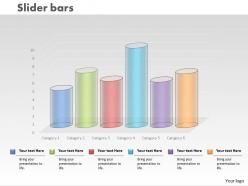 0414 slider column chart for communicating data powerpoint graph
Simply adjustable PowerPoint templates as changes accepted with color, text and shape. PPT templates are well-harmonized with Google slides. Presentation slide can be displayed in standard and widescreen view. Give personal touch to the presentation with business symbol, name and image. Excel linked design so you can make changes in the excel sheet and the design will change accordingly. Easy to download and change into other format such as JPEG and PDF. Valuable for business managers, communication and marketing executives, sales and advertising agencies.
-
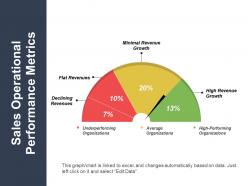 Sales operational performance metrics sample ppt files
Presenting sales operational performance metrics sample PPT files PPT slide. This sales performance template has designed by professionals while sharing the sales strategies and you can also easily edit this template in PowerPoint. You are enabled to edit the font type, size & color, diagram color, and background color as well according to the requirement. You can insert the organization name, trademark, and tagline in this template. You can even use icons of own choice by simply replacing the previous icon as thousands of editable icons available on this webpage.
-
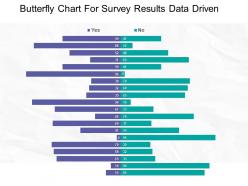 Butterfly chart for survey results data driven example of ppt
Presenting butterfly chart for survey results data-driven example of PPT slide. There is an impressive use of images, color and content parallel to the topic. Professionally equipped and aesthetically designed. PPT is compatible with numerous formats. PowerPoint is harmonious with multiple online and offline software option and is 100 percent editable. Ease of editing with the help of guidance provided for the same. Modify the content as per need. Personalize the presentation with company name, logo and trademark. Used by various students, teachers, IT professionals and entrepreneurs.
-
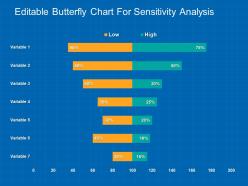 Editable butterfly chart for sensitivity analysis powerpoint guide
Presenting editable butterfly chart for sensitivity analysis PowerPoint guide PPTslide. Well crafted, aesthetically designed and professionally proficient presentation. There is the use of impressive picture quality. High-resolution images do not pixelate when projected on a wide screen. PPT has thoroughly editable slides, so add or erase the content at your personal choice. Personalize the content with company name and logo. It is compatible with multiple online and offline software options. This PPT is harmonious with a large set of format. Used by marketers, stakeholders, strategists, business analysts, and educators.
-
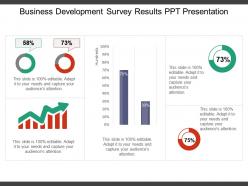 Business development survey results ppt presentation
Presenting business development survey results PPT presentation slideshow PPT which is 100% editable. This PPT template easy to customize and enables you to personalize it as per your own criteria. The presentation slide is data driven that is excel linked chart and fully compatible with Google slides, multiple format and software options. In case of any assistance, kindly take instructions from our presentation design services and it is easy to download in a very short span of time. The images, layouts, designs are of high quality and ensures quality in widescreen.
-
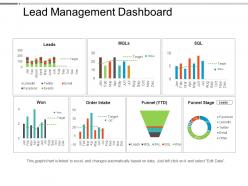 Lead management dashboard snapshot powerpoint slide
This PPT includes 1 dashboard template which can be easily edited as per your preference. The infographic slide can be instantly downloaded just with a click. It is excel linked and data-driven. It can be used by any business organization and management. The image quality does not degrade even if viewed in any size of the screen. Compatible with Google Slides. Available in two slide size designs- Standard and widescreen.
-
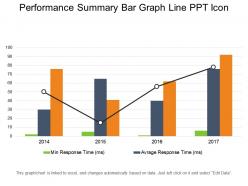 Performance summary bar graph line ppt icon
Presenting the slide named Performance Summary Bar Graph Line PPT Icon. Customize this easy to use template with font colour, font size and font style of your choice. You can easily arrange the bar categories sequentially for best readability. The text in the template can be rewritten. The colour of the background and bar graph can be changed. You can choose from a wide variety of icons that we offer and can replace them in accordance with your purpose. This template is compatible with Google Slides. You can save this slide in both PDF and JPG formats.
-
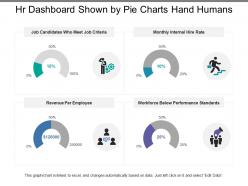 Hr dashboard shown by pie charts hand humans
Presenting this set of slides with name - Hr Dashboard Shown By Pie Charts Hand Humans. This is a four stage process. The stages in this process are Hr Dashboard, Human Resource Dashboard, Hr Kpi.
-
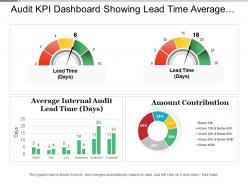 Audit kpi dashboard showing lead time average entry variance and amount contribution
Presenting this set of slides with name - Audit Kpi Dashboard Showing Lead Time Average Entry Variance And Amount Contribution. This is a four stage process. The stages in this process are Audit, Examine, Survey.
-
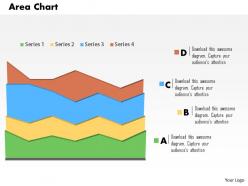 0514 area chart for data driven analysis powerpoint slides
We are proud to present our 0514 area chart for data driven analysis powerpoint slides. A unique area data driven chart is used in this Business power Point template. Use this template for sequential data flow in any presentation. Go ahead use this template in your business presentation.
-
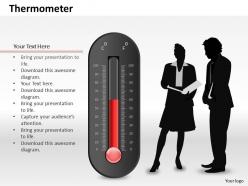 0514 data driven thermometer diagram powerpoint slides
We are proud to present our 0514 data driven thermometer diagram powerpoint slides. Unique design data driven thermometer is used in this Business Power Point template. To display various reading in any science related presentation use this graphic masterpiece and get noticed.
-
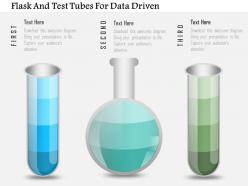 1214 flask and test tubes for data driven powerpoint slide
We are proud to present our 1214 flask and test tubes for data driven powerpoint slide. Graphic of flask and test tubes are used to craft this power point template slide. This PPT slide can be used for data driven measurement and analysis. Use this PPT slide for your science and math related presentation.
-
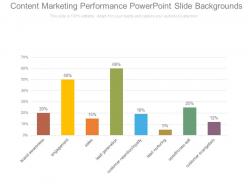 Content marketing performance powerpoint slide backgrounds
Presenting content marketing performance powerpoint slide backgrounds. This is a content marketing performance powerpoint slide backgrounds. This is a eight stage process. The stages in this process are brand awareness, engagement, sales, lead generation, customer retention loyalty, lead nurturing, upsell cross sell, customer evangelism.
-
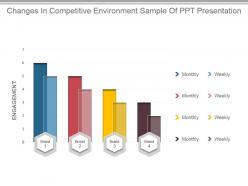 Changes in competitive environment sample of ppt presentation
Presenting changes in competitive environment sample of ppt presentation. Presenting changes in competitive environment sample of ppt presentation. Presenting changes in competitive environment sample of ppt presentation. This is a changes in competitive environment sample of ppt presentation. This is four stage process. The stages in this process are engagement, monthly, brand, weekly.
-
 Operating expenses by category powerpoint slide inspiration
Presenting operating expenses by category powerpoint slide inspiration. This is a operating expenses by category powerpoint slide inspiration. This is a five stage process. The stages in this process are business, management, marketing, finance, operating.
-
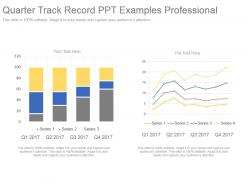 Quarter track record ppt examples professional
Presenting quarter track record ppt examples professional. This is a quarter track record ppt examples professional. This is a four stage process. The stages in this process are series.
-
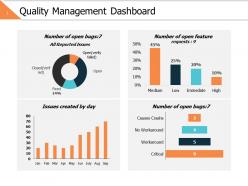 Quality management dashboard ppt powerpoint presentation gallery ideas
Presenting this set of slides with name - Quality Management Dashboard Ppt Powerpoint Presentation Gallery Ideas. This is a four stage process. The stages in this process are Business, Management, Strategy, Analysis, Finance.
-
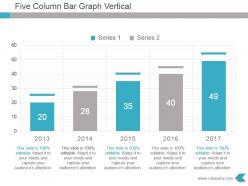 Five column bar graph vertical presentation design
Presenting five column bar graph vertical presentation design. This is a five column bar graph vertical presentation design. This is a five stage process. The stages in this process are series 1, series 2.
-
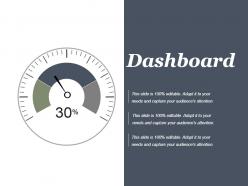 Dashboard powerpoint slide background
Presenting dashboard powerpoint slide background. This is a dashboard powerpoint slide background. This is a one stage process. The stages in this process are dashboard, meter, measure, speed, percentage.
-
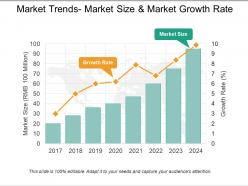 Market trends market size and market growth rate ppt infographics
Presenting market trends market size and market growth rate ppt infographics. This is a market trends market size and market growth rate ppt infographics. This is a eight stage process. The stages in this process are growth rate, market size.
-
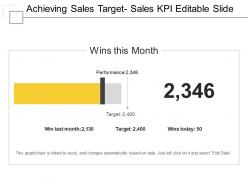 Achieving sales target sales kpi editable slide ppt example
The best advantage of downloading this sales target KPI PPT is that it is fully editable. You can change the font type, color, size, shape, style, background according to your business preferences. You can download and convert design template into JPEG and PDF formats. Design is fully compatible with Google Slides and Microsoft Office versions 2010 and 13. Use of high quality icons makes the design look more attractive.
-
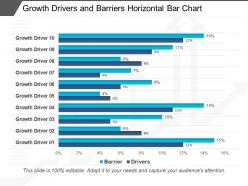 Growth drivers and barriers horizontal bar chart sample of ppt
Presenting growth drivers and barriers horizontal bar chart sample of PPT. which has been designed by professional experts. This PowerPoint template is 100% editable in PPT slide, date driven and flexible with changes as per your need and convenience. The user can easily incorporate the company, business name and logo and save it as a JPG or PDF. The PPT slide ensures high quality graphics and the icons and can be downloaded in just a few seconds.
-
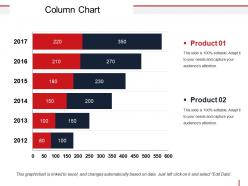 Column chart powerpoint graphics
Presenting column chart powerpoint graphics. This is a column chart powerpoint graphics. This is a six stage process. The stages in this process are product, year, step, growth, business.
-
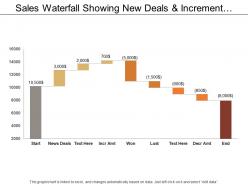 Sales waterfall showing new deals and increment amount
Presenting this set of slides with name - Sales Waterfall Showing New Deals And Increment Amount. This is a nine stage process. The stages in this process are Sales Waterfall, Waterfall Chart.
-
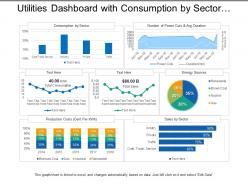 Utilities dashboard with consumption by sector and energy sources
Presenting this set of slides with name - Utilities Dashboard With Consumption By Sector And Energy Sources. This is a three stage process. The stages in this process are Utilities, Use, Advantage.
-
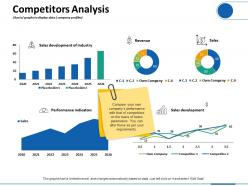 Competitors analysis charts graphs to display data company profiles
Presenting this set of slides with name - Competitors Analysis Charts Graphs To Display Data Company Profiles. This is a five stage process. The stages in this process are Revenue, Sales Development, Performance Indicators, Finance, Marketing.
-
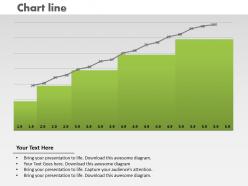 0414 column chart with growth line powerpoint graph
Multiple display option such as standard and widescreen view. Adjustable presentation background with remarkable pixel quality. Easy customization of presentation graphic and content. Proficiently transformable into numerous software options such as JPG or PDF. Provides a uniform approach to your PowerPoint illustration. Choice to insert company name, badge and label. Similar PPT designs accessible with different nodes and stages.
-
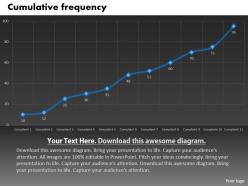 0414 cumulative frequency data line chart powerpoint graph
Presentation background can be amend easily as access to change color, text accessible. Astonishing PowerPoint visual accessible in standard and widescreen display. Far fetched picture quality as pixels don’t break. Merge well with online software tools i.e. JPG and PDF. Hundred percent compatible with Google slides. Pre-designed PPT infographic saves you valuable time. Modify the presentation slide with your company trademark, badge and design.
-
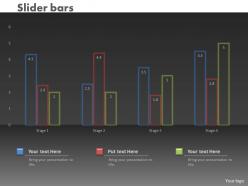 0414 slider column chart for market trends powerpoint graph
Picture quality remain similar even when you project it on big screen. Convert presentation slide fonts, text, color and design as per your style. Straightforwardly converted to other software application like JPG and PDF formats. Great for sales and marketing and entrepreneurs. This presentation theme is totally compatible with Google slides. Simple to put in company logo, brand or name.
-
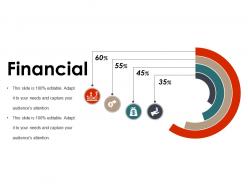 Financial ppt diagrams
Presenting the Financial PPT Diagrams PPT visual which is completely editable. The slide is readily available in both 4:3 and 16:9 aspect ratio. Customize the fonts, colors, font type, and font size of the slide as per your requirements. You can save your presentation in various formats like PDF, JPG, and PNG. The template is compatible with Google Slides, which makes it accessible at once.
-
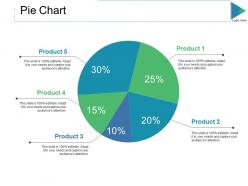 Pie chart ppt slides outfit
Presenting this set of slides with name - Pie Chart Ppt Slides Outfit. This is a five stage process. The stages in this process are Business, Marketing, Strategy, Percentage, Process.
-
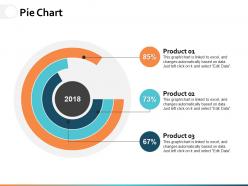 Pie chart ppt powerpoint presentation gallery infographic template
Presenting this set of slides with name - Pie Chart Ppt Powerpoint Presentation Gallery Infographic Template. This is a three stage process. The stages in this process are Percentage, Product, Business, Management, Marketing.
-
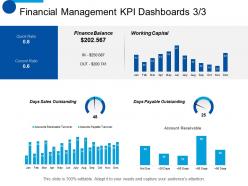 Financial management kpi dashboards business ppt summary smartart
Presenting this set of slides with name - Financial Management KPI Dashboards Business Ppt Summary Smartart. This is a six stage process. The stages in this process are Finance, Analysis, Business, Investment, Marketing.
-
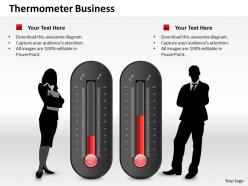 0514 two business use thermometer graphic powerpoint slides
We are proud to present our 0514 two business use thermometer graphic powerpoint slides. Graphic of two business use thermometer is used in this Business Power Point template. To display various reading in any science related presentation use this graphic masterpiece and get noticed.
-
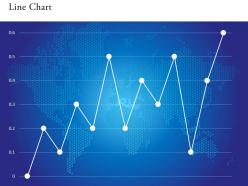 0514 unique pattern data driven line chart powerpoint slides
We are proud to present our 0514 unique pattern data driven line chart powerpoint slides. This Business Power Point template slide is designed with 3d graphic growth line chart. This template is crafted for financial growth display.
-
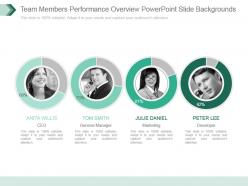 Team members performance overview powerpoint slide backgrounds
Presenting team members performance overview powerpoint slide backgrounds. This is a team members performance overview powerpoint slide backgrounds. This is a four stage process. The stages in this process are team members, performance overview, business, strategy, marketing, management, presentation.
-
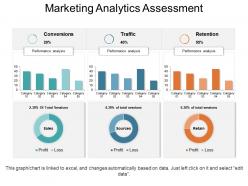 Marketing analytics assessment powerpoint templates
Presenting Marketing Analytics Assessment PowerPoint Templates.The designs are 100% editable in this PowerPoint template. The font size, font color, graphic colors, and slide background can be customized without any hassle. The users can add or remove the images according to their needs. This template includes one slide which is designed by keeping compatibility with Google Slides in mind. It is available in both standard and widescreen.
-
 Dashboard snapshot ppt summary samples
Presenting this set of slides with name - Dashboard Snapshot Ppt Summary Samples. This is a three stage process. The stages in this process are Low, Medium, High, Dashboard, Business, Percentage.
-
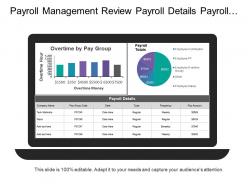 Payroll management review payroll details payroll totals
Presenting this set of slides with name - Payroll Management Review Payroll Details Payroll Totals. This is a one stage process. The stages in this process are Payroll Management, Human Resource Management, Employment Compensation.
-
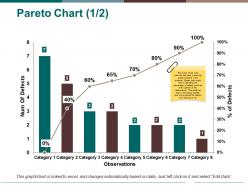 Pareto chart ppt pictures example introduction
Presenting Pareto chart PPT pictures example introduction PPT slide. The Pareto chart picture PowerPoint slide designed professionally by the team of SlideTeam and it is useful for illustrating the count of defects. The Pareto chart introduction template is the data driven template and can edit the count as the Pareto style slide gets linked with the Excel sheet. The graphical Pareto chart picture PPT slide is customizable in PowerPoint and compatible with Google Slide. A presenter can make changes in the visual Pareto chart picture template such as font size, font type, color and dimensions of the charts.
-
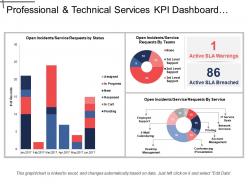 Professional and technical services kpi dashboard showing open incidents and service requests
Presenting this set of slides with name - Professional And Technical Services Kpi Dashboard Showing Open Incidents And Service Requests. This is a three stage process. The stages in this process are Professional And Technical Services, Services Management, Technical Management.
-
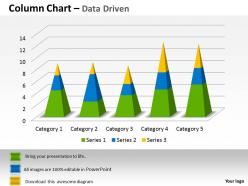 Data driven 3d categories of data sets powerpoint slides
We are proud to present our data driven 3d categories of data sets powerpoint slides. A bar graph is composed of discrete bars that represent different categories of data. The length or height of the bar is equal to the quantity within that category of data. Bar graphs are best used to compare values across categories.
-
 Customer service team benchmarking chart powerpoint slide download
Presenting customer service team benchmarking chart powerpoint slide download. This is a customer service team benchmarking chart powerpoint slide download. This is a three stage process. The stages in this process are bar chart, business, management, strategy, service.
-
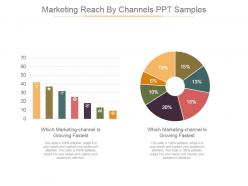 Marketing reach by channels ppt samples
Presenting marketing reach by channels ppt samples. This is a marketing reach by channels ppt samples. This is a seven stage process. The stages in this process are which marketing channel is growing fastest, strategy, financial, business, management.
-
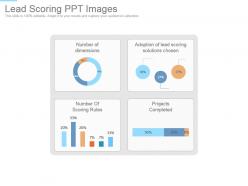 Lead scoring ppt images
Presenting lead scoring ppt images. This is a lead scoring ppt images. This is a four stage process. The stages in this process are adoption of lead scoring solutions chosen, projects completed, number of scoring rules, number of dimensions.
-
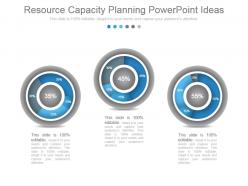 Resource capacity planning powerpoint ideas
Presenting resource capacity planning powerpoint ideas. This is a resource capacity planning powerpoint ideas. This is a three stage process. The stages in this process are percentage, business, process, marketing, management, strategy, success.
-
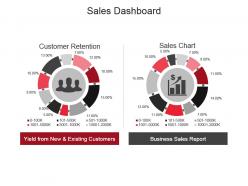 Sales dashboard powerpoint slide show
Presenting sales dashboard powerpoint slide show. This is a sales dashboard powerpoint slide show. This is a two stage process. The stages in this process are customer retention, sales chart, yield from new and existing customers, business sales report.
-
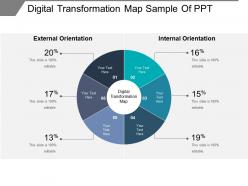 Digital transformation map sample of ppt
Presenting digital transformation map PPT slide design. This is contemporarily styled PowerPoint visual of tremendous quality and graphics. Easily exportable to PDF or JPG file compositions. Abundant space option to insert company emblem or trademark with the Presentation diagram. 100% rebuild able visuals, symbols, texts, pictures etc. Easily projected on large screen with immense quality Presentation graphic. Option to insert title and subtitle. Versant with all Google Slides. Quite beneficial for the management professionals.


