- Sub Categories
-
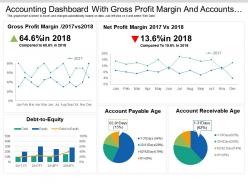 Accounting dashboard with gross profit margin and accounts payable
Offering accounting dashboard with gross profit margin and account payable PPT slideshow. Makes the information clear in the mind of the audience. Editable visuals, colors and charts. Easy to edit and customize as per your needs. Beneficial for industry professionals, technologists, managers, executives, researchers, sales people, etc. Flexible presentation designs can be presented in standard and widescreen view. Has a futuristic and realistic approach. Easy to download and save. Highly beneficial PowerPoint Slide for highlighting financial data.
-
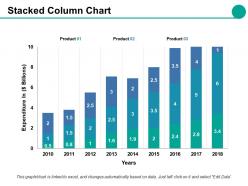 Stacked column chart ppt styles gridlines
Presenting this set of slides with name - Stacked Column Chart Ppt Styles Gridlines. This is a three stage process. The stages in this process are Business, Management, Strategy, Analysis, Marketing.
-
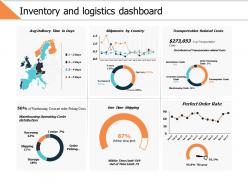 Inventory and logistics dashboard ppt powerpoint presentation file templates
Presenting this set of slides with name - Inventory And Logistics Dashboard Ppt Powerpoint Presentation File Templates. This is a six stage process. The stages in this process are Business, Management, Strategy, Analysis, Finance.
-
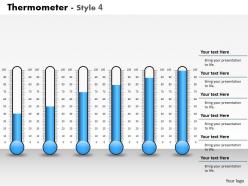 0414 display of thermometer column chart powerpoint graph
We are proud to present our 0414 display of thermometer column chart powerpoint graph. You are an avid believer in ethical practices. Highlight the benefits that accrue with our 0414 Display of Thermometer Column Chart Powerpoint Graph Powerpoint Templates. Set your controls for the heart of the sun. Our 0414 Display of Thermometer Column Chart Powerpoint Graph Powerpoint Templates will be the propellant to get you there.
-
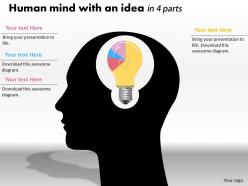 0414 idea of brain pie chart illustration powerpoint graph
We are proud to present our 0414 idea of brain pie chart illustration powerpoint graph. Lay the foundation of your presentation with our Idea Of Brain Pie Chart Illustration Powerpoint Graph Powerpoint Templates. Build upon it layer by layer and give it the form of your choice. Our Idea Of Brain Pie Chart Illustration Powerpoint Graph Powerpoint Templates are the heartstrings of your brilliant song. Strum them and produce a tune certain to touch the souls of your audience.
-
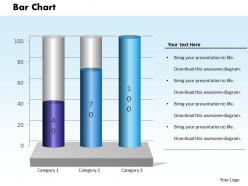 0414 incraesing flow column chart 3 stages powerpoint graph
We are proud to present our 0414 incraesing flow column chart 3 stages powerpoint graph. Our Incraesing Flow Column Chart 3 Stages Powerpoint Graph Powerpoint Templates provide the pitch to bowl on. Mesmerise your audience with your guile. Our Incraesing Flow Column Chart 3 Stages Powerpoint Graph Powerpoint Templates are stepping stones to success. Climb them steadily and reach the top.
-
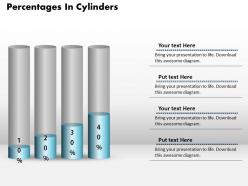 0414 percentage growth cylinders column chart powerpoint graph
We are proud to present our 0414 percentage growth cylinders column chart powerpoint graph. Bet on your luck with our Percentage Growth Cylinders Column Chart Powerpoint Graph Powerpoint Templates. Be assured that you will hit the jackpot. Let our Percentage Growth Cylinders Column Chart Powerpoint Graph Powerpoint Templates be the string of your bow. Fire of your ideas and conquer the podium.
-
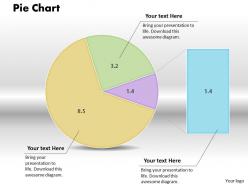 0414 pie chart businesss growth design powerpoint graph
We are proud to present our 0414 pie chart businesss growth design powerpoint graph. Our Pie Chart Businesss Growth Design Powerpoint Graph Power Point Templates Come In All Colors Shades And Hues. They Help Highlight Every Nuance Of Your Views. Our Pie Chart Businesss Growth Design Powerpoint Graph Power Point Templates Will Fulfill Your Every Need. Use Them And Effectively Satisfy The Desires Of Your Audience.
-
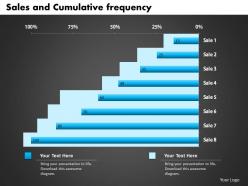 0414 sales and cumulative frequency bar chart powerpoint graph
We are proud to present our 0414 sales and cumulative frequency bar chart powerpoint graph. Lay The Foundation Of Your Presentation With Our Sales and Cumulative frequency bar chart Powerpoint Graph Power Point Templates. Build Upon It Layer By Layer And Give It The Form Of Your Choice. Our Sales and Cumulative frequency bar chart Powerpoint Graph Power Point Templates Are The Heartstrings Of Your Brilliant Song. Strum Them And Produce A Tune Certain To Touch The Souls Of Your Audience.
-
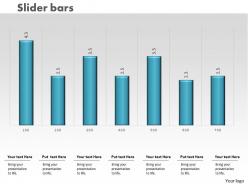 0414 slider column chart with bars powerpoint graph
We are proud to present our 0414 slider column chart with bars powerpoint graph. Our Slider Column Chart With Bars Powerpoint Graph Powerpoint Templates are the chords of your song. String them along and provide the lilt to your views. Our Slider Column Chart With Bars Powerpoint Graph Powerpoint Templates help you pinpoint your timelines. Highlight the reasons for your deadlines with their use.
-
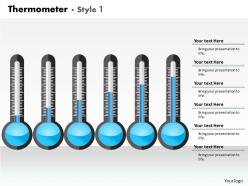 0414 thermometer column chart business layout powerpoint graph
We are proud to present our 0414 thermometer column chart business layout powerpoint graph. Our Thermometer Column Chart Business Layout Powerpoint Graph Powerpoint Templates provide the links in your chain of thought. Once intertwined they enhance the strength of your words. Our Thermometer Column Chart Business Layout Powerpoint Graph Powerpoint Templates are like ingredients in your recipe of sucess. Stir them together and get people licking their lips.
-
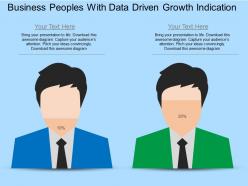 Business peoples with data driven growth indication powerpoint slides
We are proud to present our business peoples with data driven growth indication powerpoint slides. This power point template diagram has been designed with graphic of business peoples. This pie chart is data driven. This PPT diagram can be used for data driven growth indication. Use this PPT diagram can be used for marketing and business related presentations.
-
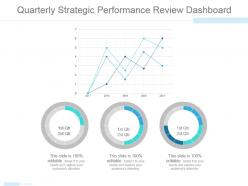 Quarterly strategic performance review dashboard ppt icon
Presenting quarterly strategic performance review dashboard ppt icon. This is a quarterly strategic performance review dashboard ppt icon. This is a three stage process. The stages in this process are finance, business, marketing, dashboard, process.
-
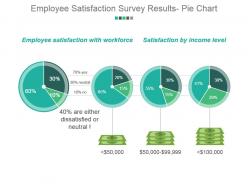 Employee satisfaction survey results pie chart powerpoint presentation examples
Presenting employee satisfaction survey results pie chart powerpoint presentation examples. This is a employee satisfaction survey results pie chart powerpoint presentation examples. This is a four stage process. The stages in this process are employee satisfaction with workforce, satisfaction by income level.
-
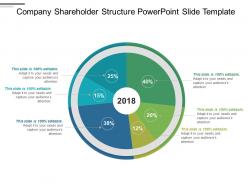 Company shareholder structure powerpoint slide template
Presenting company shareholder structure PowerPoint slide template. This layout is fully compatible with Google slides and data driven. User can edit the data in linked excel sheet and graphs and charts gets customized accordingly. Easy to put in company logo, trademark or name; accommodate words to support the key points. Images do no distort out even when they are projected on large screen. Adjust colors, text and fonts as per your business requirements. Fast downloading speed and formats can be easily changed to JPEG and PDF applications.
-
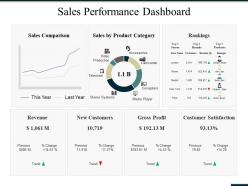 Sales performance dashboard ppt summary graphics tutorials
Presenting this set of slides with name - Sales Performance Dashboard Ppt Summary Graphics Tutorials. This is a three stage process. The stages in this process are Revenue, New Customers, Gross Profit, Customer Satisfaction, Rankings.
-
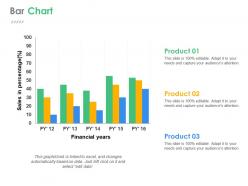 Bar chart ppt slide design
Presenting this set of slides with name - Bar Chart Ppt Slide Design. This is a three stage process. The stages in this process are Bar Chart, Marketing, Strategy, Planning, Finance.
-
 Education and research kpi dashboard by country language and education types
Presenting education and research KPI dashboard by country language and education types PPT slide. The different language PPT template designed by the professional team of SlideTeam. The different country language report slide is fully editable in PowerPoint. The country language KPI report PowerPoint slide is compatible with Google Slide so a user can share this language dashboard slide with others. A user can make changes in the font size, font type, color as well as dimensions of the education distribution PPT template as per the requirement. You may edit the value in the new research program metric report template as the slide gets linked with the Excel sheet. .
-
 Education and research kpi dashboard showing response timeline and researcher engagement
Presenting education and research KPI dashboard showing response timeline and researcher engagement PPT slide. The education report PPT slide designed by professional team of SlideTeam. The research grant KPI dashboard presentation template is customizable in PowerPoint. The student attendance rate KPI report PowerPoint slide is also compatible with Google Slide so a user can share this template with others. A user can make changes in the font size, font type, color as well as dimensions of the education finance metric dashboard template as per the requirement. You may edit the value in the education KPI dashboard PowerPoint template as the slide gets linked with the Excel sheet. .
-
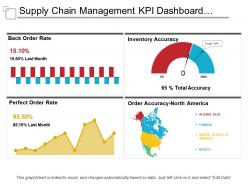 Supply chain management kpi dashboard showing back order rate and order accuracy
Presenting this set of slides with name - Supply Chain Management Kpi Dashboard Showing Back Order Rate And Order Accuracy. This is a four stage process. The stages in this process are Demand Forecasting, Predicting Future Demand, Supply Chain Management.
-
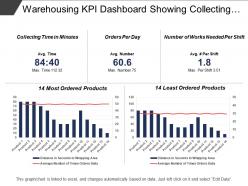 Warehousing kpi dashboard showing collecting time and orders per day
Presenting, warehousing dashboard KPI PowerPoint Presentation Slide. This Presentation has been designed professionally and is fully editable. You can personalize font size, font type, colors, and even the background. This Template is obedient with Google Slide and can be saved in JPG or PDF format without any hassle. Fast download at the click of the button.
-
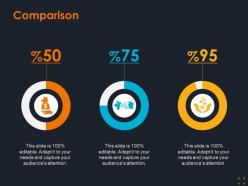 Comparison icons with percentage ppt summary graphic images
Presenting this set of slides with name - Comparison Icons With Percentage Ppt Summary Graphic Images. This is a three stage process. The stages in this process are Comparison, Marketing, Strategy, Finance, Business.
-
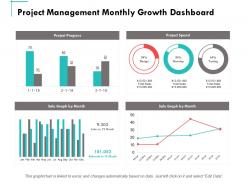 Project management monthly growth dashboard ppt powerpoint presentation summary slide
Presenting this set of slides with name - Project Management Monthly Growth Dashboard Ppt Powerpoint Presentation Summary Slide. This is a two stages process. The stages in this process are Finance, Marketing, Management, Investment, Analysis.
-
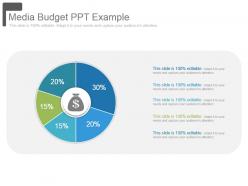 Media budget ppt example
Presenting media budget ppt example. This is a media budget ppt example. This is a five stage process. The stages in this process are finance, donut, business, success, marketing, strategy.
-
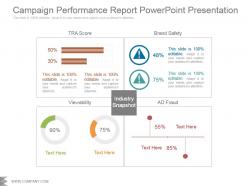 Campaign performance report powerpoint presentation
Presenting campaign performance report powerpoint presentation. This is a campaign performance report powerpoint presentation. This is a four stage process. The stages in this process are industry snapshot, viewability, ad fraud, brand safety, tra score.
-
 Marketing expenditures pie chart powerpoint slide deck
Presenting marketing expenditures pie chart powerpoint slide deck. This is a marketing expenditures pie chart powerpoint slide deck. This is a five stage process. The stages in this process are business, finance, process, strategy, chart and graph.
-
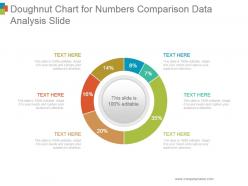 Doughnut chart for numbers comparison data analysis slide powerpoint topics
Presenting doughnut chart for numbers comparison data analysis slide powerpoint topics. This is a doughnut chart for numbers comparison data analysis slide powerpoint topics. This is a six stage process. The stages in this process are circular, process, percentage, financial, business.
-
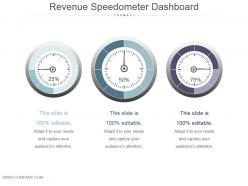 Revenue speedometer dashboard snapshot ppt diagrams
Presenting revenue speedometer dashboard Snapshot ppt diagrams. This is a revenue speedometer dashboard ppt diagrams. This is a three stage process. The stages in this process are business, marketing, success, dashboard, percentage.
-
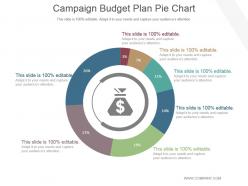 Campaign budget plan pie chart powerpoint ideas
Presenting campaign budget plan pie chart powerpoint ideas. This is a campaign budget plan pie chart powerpoint ideas. This is a seven stage process. The stages in this process are business, success, finance, strategy, management.
-
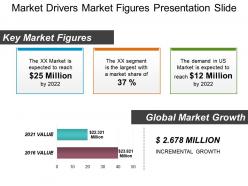 Market drivers market figures presentation slide
Presenting this PPT slide named - Market drivers market figures presentation slide. Save your time with a completely editable PPT design. You can make the needful alterations in the font color, font size and font style. The color of text and background can be for formatted. You can design the PPT slide with a range of editable icons. You can add or edit text anywhere in the PowerPoint template. It’s compatibility with Google slides make it accessible at once. You can customize and save the slide in PDF and JPG formats as well. Get this high quality slide to add value to your presentation.
-
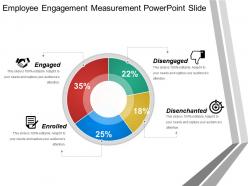 Employee engagement measurement powerpoint slide
Presenting employee engagement measurement PowerPoint slide. This layout is fully compatible with Google slides and data driven. User can edit the data in linked excel sheet and graphs and charts gets customized accordingly. Easy to put in company logo, trademark or name; accommodate words to support the key points. Images do no distort out even when they are projected on large screen. Adjust colors, text and fonts as per your business requirements.
-
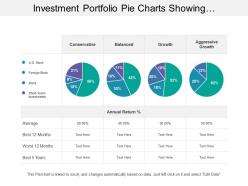 Investment portfolio pie charts showing conservative and balanced growth
Presenting this set of slides with name - Investment Portfolio Pie Charts Showing Conservative And Balanced Growth. This is a four stage process. The stages in this process are Investment Portfolio, Funding Portfolio, Expenditure Portfolio.
-
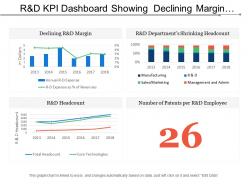 R and d kpi dashboard showing declining margin headcount and number of patents per employee
Presenting this set of slides with name - R And D Kpi Dashboard Showing Declining Margin Headcount And Number Of Patents Per Employee. This is a four stage process. The stages in this process are R And D, Research And Development, Research And Technological Development.
-
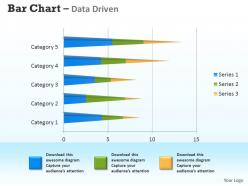 Data driven 3d bar chart for analyzing survey data powerpoint slides
We are proud to present our data driven 3d bar chart for analyzing survey data powerpoint slides. This PowerPoint chart can be used to illustrate many types of data. It should be used to make facts clearer and more understandable. Quick way for the audience to visualize what you are saying numbers trends up or down .
-
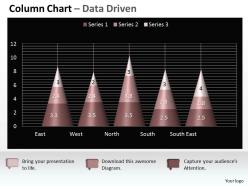 Data driven 3d chart shows interrelated sets of data powerpoint slides
We are proud to present our data driven 3d chart shows interrelated sets of data powerpoint slides. Our Data Driven 3D Chart Shows Interrelated Sets Of Data Powerpoint Slides Power Point Templates Provide You With A Vast Range Of Viable Options. Select The Appropriate Ones And Just Fill In Your Text. Subscribe To Our Data Driven 3D Chart Shows Interrelated Sets Of Data Powerpoint Slides Power Point Templates And Receive Great Value For Your Money. Be Assured Of Finding The Best Projection To Highlight Your Words.
-
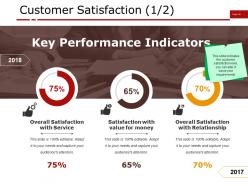 Customer satisfaction ppt examples professional
Presenting customer satisfaction ppt examples professional. Presenting customer satisfaction ppt examples professional. This is a customer satisfaction ppt examples professional. This is a three stage process. The stages in this process are overall satisfaction with service, satisfaction with value for money, overall satisfaction with relationship, percentage, business.
-
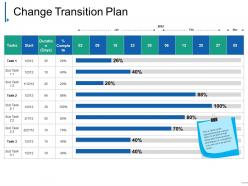 Change transition plan powerpoint slide themes
Presenting change transition plan powerpoint slide themes. This is a change transition plan powerpoint slide themes. This is a nine stage process. The stages in this process are task, sub task, complete, duration, percentage.
-
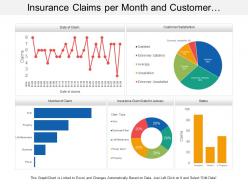 Insurance claims per month and customer satisfaction dashboard
Presenting this set of slides with name - Insurance Claims Per Month And Customer Satisfaction Dashboard. This is a five stage process. The stages in this process are Assurance, Surety, Insurance.
-
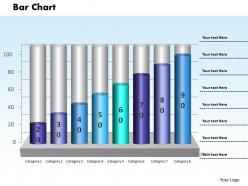 0414 inreasing profit ratio column chart powerpoint graph
We are proud to present our 0414 inreasing profit ratio column chart powerpoint graph. Let our Inreasing Profit Ratio Column Chart Powerpoint Graph Powerpoint Templates be the vehicle of your sucessful journey. Ride the bus to glory with your grand ideas. Our Inreasing Profit Ratio Column Chart Powerpoint Graph Powerpoint Templates are like a basic christmas tree. Decorate it with your beautiful thoughts and spread joy and happiness.
-
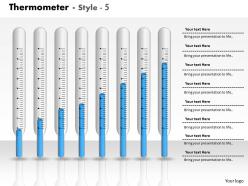 0414 thermometer business graph column chart powerpoint graph
We are proud to present our 0414 thermometer business graph column chart powerpoint graph. Let our Thermometer Business Graph Column Chart Powerpoint Graph Powerpoint Templates be the vehicle of your sucessful journey. Ride the bus to glory with your grand ideas. Our Thermometer Business Graph Column Chart Powerpoint Graph Powerpoint Templates are like a basic christmas tree. Decorate it with your beautiful thoughts and spread joy and happiness.
-
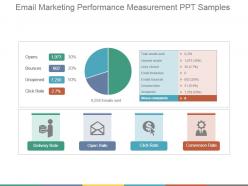 Email marketing performance measurement ppt samples
Presenting email marketing performance measurement ppt samples. This is a email marketing performance measurement ppt samples. This is a three stage process. The stages in this process are opens, bounces, unopened, click rate, delivery rate, open rate, click rate, conversion rate.
-
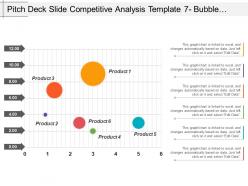 Pitch deck slide competitive analysis template 7 bubble chart ppt slide styles
Presenting Pitch Deck Slide Competitive Analysis Template 7 Bubble Chart PPT Slide Styles. Customize the slide by modifying the colors, font and background. Transform it in formats like JPG, PNG, JPEG, and PDF. The slide is Google Slides friendly. Avail it in standard screen and widescreen size. It is made up of high-resolution graphics that do not pixelate when viewed on widescreen.
-
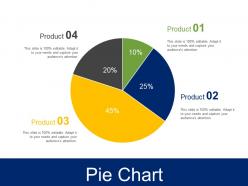 Pie chart ppt infographic template
Presenting pie chart ppt infographic template. This is a pie chart ppt infographic template. This is a four stage process. The stages in this process are chart, percentage, business, marketing, strategy.
-
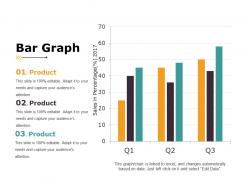 Bar graph ppt samples
Presenting Bar Graph PPT Samples PowerPoint slide. This PPT presentation is Google Slides compatible hence it is easily accessible. You can download and save this PowerPoint layout in different formats like PDF, PNG and JPG. This PPT theme is available in both 4:3 and 16:9 aspect ratios. As this PowerPoint template is 100% editable, you can modify color, font size, font type and shapes as per your requirements.
-
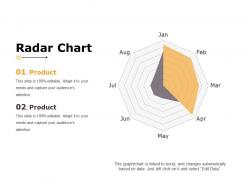 Radar chart powerpoint slide rules
Presenting radar chart powerpoint slide rules. This is a radar chart powerpoint slide rules. This is a two stage process. The stages in this process are product, radar chart, business, shapes.
-
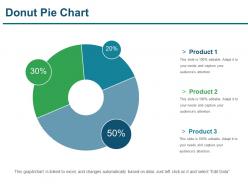 Donut pie chart presentation powerpoint
Presenting Donut Pie Chart Presentation Powerpoint. Easy to download PPT layout and can be saved in different formats like JPG, PDF, and PNG. This PowerPoint slide is completely editable so you can modify, font type, font color, shape and image according to your requirements. This Google Slides compatible PPT is available in 4:3 and 16:9 aspect ratios.
-
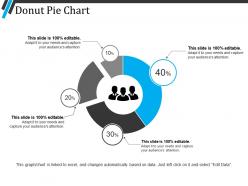 Donut pie chart example ppt presentation
Presenting donut pie chart example ppt presentation. This is a donut pie chart example ppt presentation. This is a four stage process. The stages in this process are donut pie chart, finance, marketing, strategy, analysis, business.
-
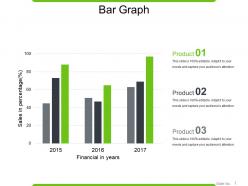 Bar graph good ppt example
Presenting bar graph good ppt example. This is a bar graph good ppt example. This is a three stage process. The stages in this process are bar graph, finance, analysis, strategy, business.
-
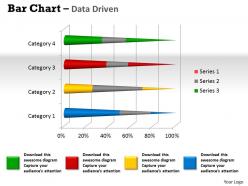 Data driven 3d bar chart to dispaly data powerpoint slides
We are proud to present our data driven 3d bar chart to dispaly data powerpoint slides. This PowerPoint diagram helps you to determine the number of activities to be studied and the number of people involved in the process.Transmit your thoughts via this slide and prods your team to action.
-
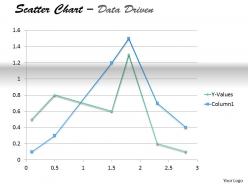 Data driven present data in scatter chart powerpoint slides
We are proud to present our data driven present data in scatter chart powerpoint slides. Use this Scatter chart to present business data in an effective way.This PPT diagram should be used to make facts clearer and more understandable.This is one of the easiest ways to compare facts and figures.
-
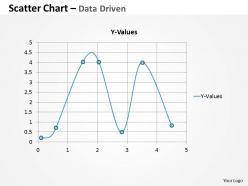 Data driven scatter chart for market trends powerpoint slides
We are proud to present our data driven scatter chart for market trends powerpoint slides. You should not waste all that time writing a report. Rather, you should spend your time analyzing the numbers and preparing a short presentation using this data driven chart.
-
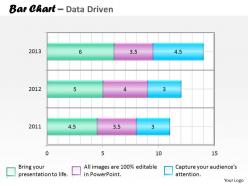 Data driven bar chart for collection of data powerpoint slides
We are proud to present our data driven bar chart for collection of data powerpoint slides. Open The Mental Windows Of Your Audience With Our Data Driven Bar Chart For Collection Of Data Powerpoint Slides Power Point Templates. Let The Fresh Breeze Of Your Thoughts Flow Through. High Five Your Audience With Our Data Driven Bar Chart For Collection Of Data Powerpoint Slides Power Point Templates. See Them Extend Their Hands With Joy.
-
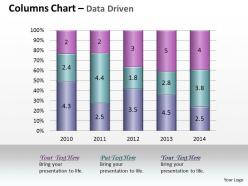 Data driven column chart of various fields powerpoint slides
We are proud to present our data driven column chart of various fields powerpoint slides. Our Data Driven Column Chart Of Various Fields Powerpoint Slides Power Point Templates Are Focused Like A Searchlight Beam. They Highlight Your Ideas For Your Target Audience. Walk Right In To Our Data Driven Column Chart Of Various Fields Powerpoint Slides Power Point Templates Store. You Will Get More Than You Ever Bargained For.
-
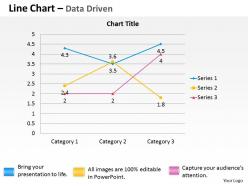 Data driven economic analysis line chart powerpoint slides
We are proud to present our data driven economic analysis line chart powerpoint slides. Set Pulses Racing With Our Data Driven Economic Analysis Line Chart Powerpoint Slides Power Point Templates. They Will Raise The Expectations Of Your Team. Our Data Driven Economic Analysis Line Chart Powerpoint Slides Power Point Templates Will Let Your Ideas Bloom. Create A Bed Of Roses For Your Audience.
-
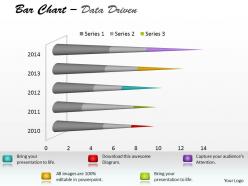 Data driven 3d bar chart to communicate information powerpoint slides
We are proud to present our data driven 3d bar chart to communicate information powerpoint slides. Our Data Driven 3D Bar Chart To Communicate Information Powerpoint slides Power Point Templates Will Generate And Maintain The Level Of Interest You Desire. They Will Create The Impression You Want To Imprint On Your Audience. Our Data Driven 3D Bar Chart To Communicate Information Powerpoint slides Power Point Templates Are Effectively Color Coded To Priorities Your Plans. They Automatically Highlight The Sequence Of Events You Desire.
-
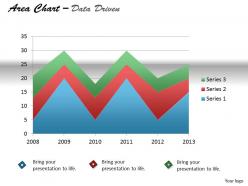 Data driven display series with area chart powerpoint slides
We are proud to present our data driven display series with area chart powerpoint slides. Our Data Driven Display Series With Area Chart Powerpoint slides Power Point Templates Are Creatively Constructed And Eye Catching. Focus Attention On The Key Issues Of Your Presentation. Use Our Data Driven Display Series With Area Chart Powerpoint slides Power Point Templates And Nail The Day. Lead Your Team Show Them The Way.
-
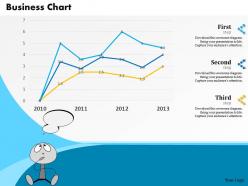 0514 annual business data driven chart powerpoint slides
We are proud to present our 0514 annual business data driven chart powerpoint slides. An annual based data driven chart graphic is used in this business power point template. This professional template is well crafted for various business presentations.
-
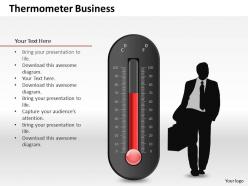 0514 use good quality scientific thermometer powerpoint slides
We are proud to present our 0514 use good quality scientific thermometer powerpoint slides. Graphic of scientific thermometer is used in this Business Power Point template. To display various reading in any science related presentation use this graphic masterpiece and get noticed.
-
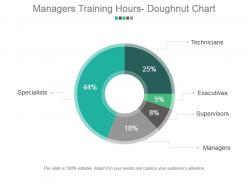 Managers training hours doughnut chart powerpoint slide
Presenting managers training hours doughnut chart powerpoint slide. This is a managers training hours doughnut chart powerpoint slide. This is a four stage process. The stages in this process are open positions by divisions, key metrics, total employees, employee churn.
-
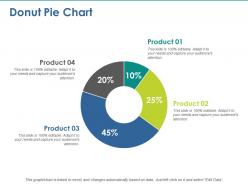 Donut pie chart with percentage ppt summary example introduction
Presenting this set of slides with name - Donut Pie Chart With Percentage Ppt Summary Example Introduction. This is a four stage process. The stages in this process are Donut Pie Chart, Finance, Analysis, Marketing, Strategy, Business.


