- Sub Categories
-
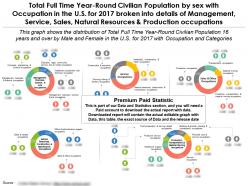 Total full time year round civilian population by sex with occupation in the us for 2017
Presenting this set of slides with name - Total Full Time Year Round Civilian Population By Sex With Occupation In The US For 2017. Total Full Time Year Round Civilian Population by sex with Occupation in the U.S. for 2017 broken into details of management, service, sales, natural resources and Production occupations. This is part of our Data and Statistics products selection, and you will need a Paid account to download the actual report with accurate data. Downloaded report will contain the actual editable graph with the actual data, an excel table with the actual data, the exact source of the data and the release date. This graph shows the distribution of Total Full Time Year Round Civilian Population 16 years and over by Male and Female in the U.S. for 2017 with Occupation and Categories. It covers topic Full Time Year Round Population by Sex for region USA and is for date range 2017. Download it immediately and use it for your business.
-
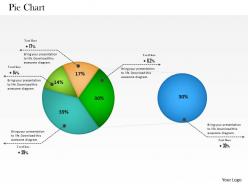 0514 business result data driven pie chart powerpoint slides
We are proud to present our 0514 business result data driven pie chart powerpoint slides. This Business Power Point template is designed with pie chart to highlight the result in any business presentation. Create a good impact on your viewers with our unique template collection.
-
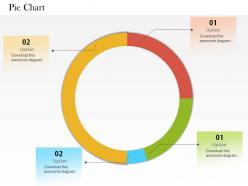 0514 data driven circular pie chart powerpoint slides
We are proud to present our 0514 data driven circular pie chart powerpoint slides. This Business Power Point template is designed with data driven circular pie chart to highlight the result in any business presentation.
-
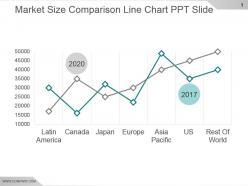 Market size comparison line chart ppt slide
Presenting market size comparison line chart ppt slide. This is a market size comparison line chart ppt slide. This is a two stage process. The stages in this process are latin america, canada, japan, europe, asia pacific, us, rest of world.
-
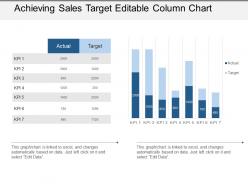 Achieving sales target editable column chart powerpoint guide
Presenting the PPT slide named Achieving sales target editable column chart PowerPoint guide. This template is professionally designed and is completely editable. The Font color, Font size, Font style, background color and color of the diagram can be altered as per your suitability. The text in the template can be rewritten and replaced with your desired content. The slide is totally compatible with Google slides and can be easily saved in JPG or PDF format. You can customize the template conveniently by changing the data in excel sheet, as this template is Excel-linked. Editable icons make the presentation more presentable. Download it now to make a hassle free presentation.
-
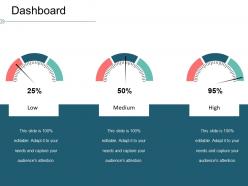 Dashboard snapshot ppt icon
Presenting this set of slides with name - Dashboard Snapshot Ppt Icon. This is a three stage process. The stages in this process are Low, Medium, High, Dashboard, Business, Percentage.
-
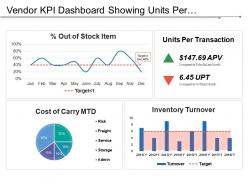 Vendor kpi dashboard showing units per transaction percentage out of stock items
Presenting this set of slides with name - Vendor Kpi Dashboard Showing Units Per Transaction Percentage Out Of Stock Items. This is a four stage process. The stages in this process are Vendor, Supplier, Retailer.
-
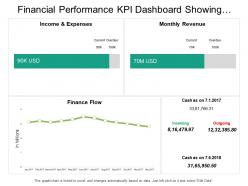 Financial performance kpi dashboard showing income expenses monthly revenue
Presenting this set of slides with name - Financial Performance Kpi Dashboard Showing Income Expenses Monthly Revenue. This is a four stage process. The stages in this process are Financial Performance, Financial Report, Financial Review.
-
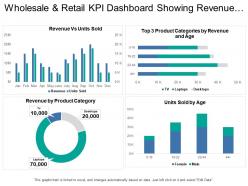 Wholesale and retail kpi dashboard showing revenue vs units sold
Presenting the retail business template for PowerPoint. This PowerPoint template is 100% editable in PowerPoint and is professionally designed. You can edit the objects in the slide like font size and font color very easily. This presentation slide is 100% compatible with Google Slide and can be saved in JPG or PDF file format without any fuss. Fast download this at the click of the button.
-
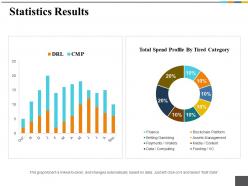 Statistics results ppt inspiration gallery
Presenting statistics results PowerPoint presentation slide. This presentation has been designed professionally and is fully editable. You can personalize font size, font type, colors, and even the background. This Template is obedient with Google Slide and can be saved in JPG or PDF format without any hassle. Fast download at the click of the button.
-
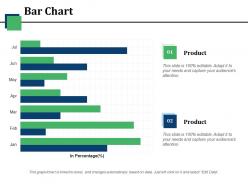 Bar chart ppt portfolio
Presenting this set of slides with name - Bar Chart Ppt Portfolio. This is a two stage process. The stages in this process are Financial, In Percentage, Business, Marketing, Strategy, Graph.
-
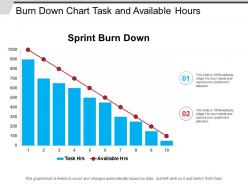 Burn down chart task and available hours
Presenting this set of slides with name - Burn Down Chart Task And Available Hours. This is a two stage process. The stages in this process are Burn Down Chart, Agile Software Development Chart, Run Chart.
-
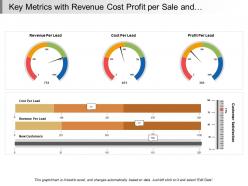 Key metrics with revenue cost profit per sale and customer satisfaction
Presenting this set of slides with name - Key Metrics With Revenue Cost Profit Per Sale And Customer Satisfaction. This is a three stage process. The stages in this process are Key Metrics, Key Performance Indicator, Kpi.
-
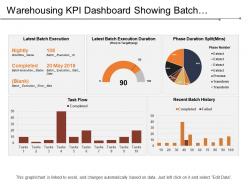 Warehousing kpi dashboard showing batch execution and task flow
Showing, warehousing KPI dashboard PowerPoint Presentation Slide. This Presentation has been designed professionally and is fully editable. You can customize the font size, font type, colors, and even the background. This Template is disciplinary with Google Slide and can be saved in JPG or PDF format without any fuss created. Fast download at the click of the button.
-
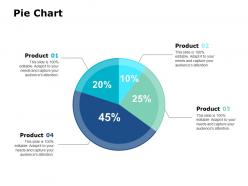 Pie chart ppt powerpoint presentation model guide
Presenting this set of slides with name - Pie Chart Ppt Powerpoint Presentation Model Guide. This is a three stage process. The stages in this process are Analysis, Financials, Business, Management, Strategy.
-
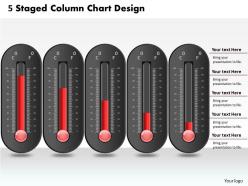 0414 5 staged column chart design powerpoint graph
We are proud to present our 0414 5 staged column chart design powerpoint graph. Hit the ground running with our 5 Staged Column Chart Design PowerPoint Graph Powerpoint Templates. Go the full distance with ease and elan. Leave a lasting impression with our 5 Staged Column Chart Design PowerPoint Graph Powerpoint Templates. They possess an inherent longstanding recall factor.
-
 0414 design of thermometer column chart powerpoint graph
We are proud to present our 0414 design of thermometer column chart powerpoint graph. Our 0414 Design Of Thermometer Column Chart Powerpoint Graph Powerpoint Templates provide you the cutting edge. Slice through the doubts in the minds of your listeners. You aspire to touch the sky with glory. Let our 0414 Design Of Thermometer Column Chart Powerpoint Graph Powerpoint Templates provide the fuel for your ascent.
-
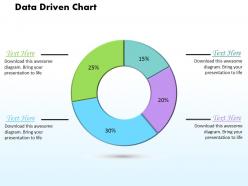 0414 donut chart business illuastration powerpoint graph
We are proud to present our 0414 donut chart business illuastration powerpoint graph. Tee off with our 0414 Donut Chart Business Illuastration Powerpoint Graph Powerpoint Templates. They will reward you with a hole in one. Launch your ideas with our 0414 Donut Chart Business Illuastration Powerpoint Graph Powerpoint Templates. Take your audience along on a magnificent flight.
-
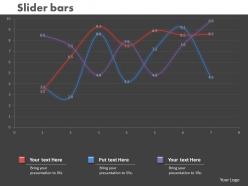 0414 slider line chart marketing illustration powerpoint graph
We are proud to present our 0414 slider line chart marketing illustration powerpoint graph. Our Slider Line Chart Business Illustration Powerpoint Graph Powerpoint Templates are aesthetically designed to attract attention. We guarantee that they will grab all the eyeballs you need. Our Slider Line Chart Business Illustration Powerpoint Graph Powerpoint Templates are specially created by a professional team with vast experience. They diligently strive to come up with the right vehicle for your brilliant Ideas.
-
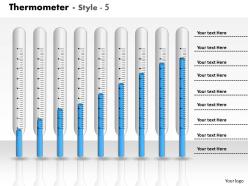 0414 thermometer business design column chart powerpoint graph
We are proud to present our 0414 thermometer business design column chart powerpoint graph. Whatever the nuance you want to project. We have a Thermometer Business Design Column Chart Powerpoint Graph Powerpoint Templates that will get it across. Create a connection with your audience using our Thermometer Business Design Column Chart Powerpoint Graph Powerpoint Templates. Transfer your depth of knowledge clearly across to them.
-
 Hiring plan powerpoint slide background image
Presenting hiring plan powerpoint slide background image. Presenting hiring plan powerpoint slide background image. Presenting hiring plan powerpoint slide background image. This is a hiring plan powerpoint slide background image. This is five stage process. The stages in this process are engineering, sales, marketing, product, support, finance.
-
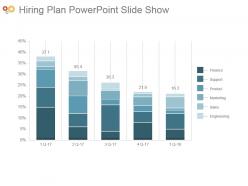 Hiring plan powerpoint slide show
Presenting hiring plan powerpoint slide show. Presenting hiring plan powerpoint slide show. Presenting hiring plan powerpoint slide show. This is a hiring plan powerpoint slide show. This is five stage process. The stages in this process are finance, support, product, marketing, sales, engineering.
-
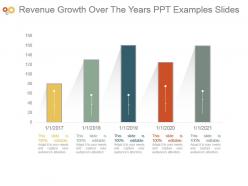 Revenue growth over the years ppt examples slides
Presenting revenue growth over the years ppt examples slides. This is a revenue growth over the years ppt examples slides. This is a five stage process. The stages in this process are business, management, marketing, revenue, growth.
-
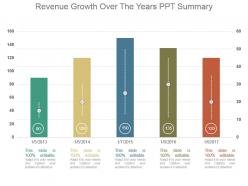 Revenue growth over the years ppt summary
Presenting revenue growth over the years ppt summary. This is a revenue growth over the years ppt summary. This is a five stage process. The stages in this process are business, management, marketing, revenue, strategy.
-
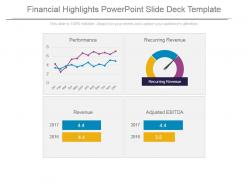 Financial highlights powerpoint slide deck template
Presenting financial highlights powerpoint slide deck template. This is a financial highlights powerpoint slide deck template. This is a four stage process. The stages in this process are performance, recurring revenue, revenue, adjusted ebitda.
-
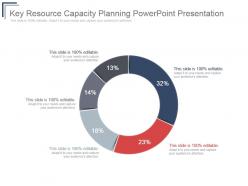 Key resource capacity planning powerpoint presentation
Presenting key resource capacity planning powerpoint presentation. This is a key resource capacity planning powerpoint presentation. This is a five stage process. The stages in this process are success, business, marketing, presentation, management.
-
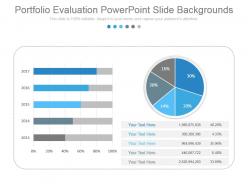 Portfolio evaluation powerpoint slide backgrounds
Presenting portfolio evaluation powerpoint slide backgrounds. This is a portfolio evaluation powerpoint slide backgrounds. This is a five stage process. The stages in this process are business, marketing, management, strategy, process.
-
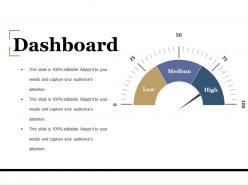 Dashboard powerpoint slide rules
Presenting dashboard powerpoint slide rules. This is a dashboard powerpoint slide rules. This is a three stage process. The stages in this process are business, marketing, strategy, planning, dashboard.
-
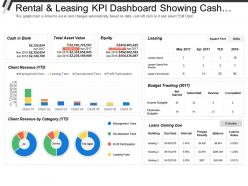 Rental and leasing kpi dashboard showing cash in bank total asset value equity
Presenting this set of slides with name - Rental And Leasing Kpi Dashboard Showing Cash In Bank Total Asset Value Equity. This is a three stage process. The stages in this process are Rental And Leasing, Dealing And Leasing, Rental And Engage.
-
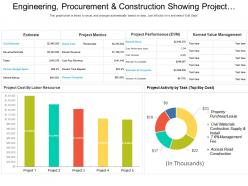 Engineering procurement and construction showing project metrics and activity
Presenting this set of slides with name - Engineering Procurement And Construction Showing Project Metrics And Activity. This is a three stage process. The stages in this process are Engineering, Procurement And Construction, Construction Management, Engineering, Purchasing And Construction .
-
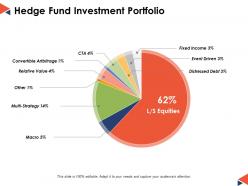 Hedge fund investment portfolio ppt powerpoint presentation file deck
This is a nine stages process. The stages in this process are Pie Chart, Percentage, Marketing, Business, Analysis.
-
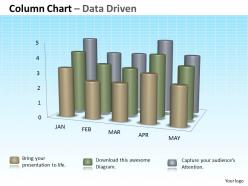 Data driven 3d column chart for sets of information powerpoint slides
We are proud to present our data driven 3d column chart for sets of information powerpoint slides. Our Data Driven 3D Column Chart For Sets Of Information Powerpoint Slides Power Point Templates Provide The Pitch To Bowl On. Mesmerize Your Audience With Your Guile. Our Data Driven 3D Column Chart For Sets Of Information Powerpoint Slides Power Point Templates Are Stepping Stones To Success. Climb Them Steadily And Reach The Top.
-
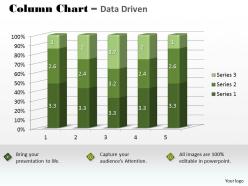 Data driven 3d statistical quality control chart powerpoint slides
We are proud to present our data driven 3d statistical quality control chart powerpoint slides. Put Your Wonderful Verbal Artistry On Display. Our Data Driven 3D Statistical Quality Control Chart Powerpoint Slides Power Point Templates Will Provide You The Necessary Glam And Glitter. You Have The Co-Ordinates For Your Destination Of Success. Let Our Data Driven 3D Statistical Quality Control Chart Powerpoint Slides Power Point Templates Map Out Your Journey.
-
 Dashboard presentation examples
Presenting Dashboard Presentation Examples which is completely editable. You can easily download this template into various formats like PDF, PNG, and JPEG. This slide is compatible with Google Slides. You can make as many changes as you want on the slide without any complications. Access this slide in both 4:9 and 16:9 ratio.
-
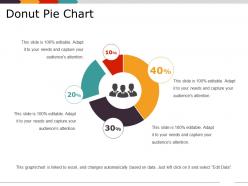 Donut pie chart ppt slide examples
Presenting Donut Pie Chart PPT Slide Examples template. The layout can be downloaded and saved in general image or document formats such as JPEG and PDF. The slide supports both the standard(4:3) and widescreen(16:9) aspect ratios. It is also compatible with Google Slides and other related software. Modify the style, size, and the background of the slides. High-quality graphics retain the quality of images.
-
 Column chart powerpoint layout
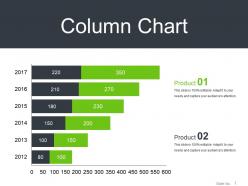
Presenting Column Chart PowerPoint Layout. This slide can be downloaded into formats like PDF, JPG, and PNG without any problem. It is adaptable with Google Slides which makes it accessible at once. You can modify the color, font, font size, and font types of the slides as per your requirement. This slide is available in both the standard and widescreen aspect ratio. High-quality graphics ensures that there is no room for deterioration.
-
 Dashboard powerpoint presentation templates
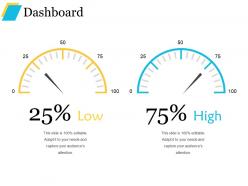
Presenting dashboard powerpoint presentation templates. This is a dashboard powerpoint presentation templates. This is a two stage process. The stages in this process are low, high, dashboard, technology, business.
-
 Dashboard powerpoint templates download
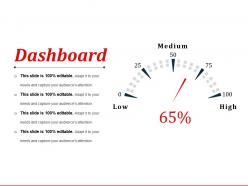
Presenting dashboard powerpoint templates download. This is a dashboard powerpoint templates download. This is a one stage process. The stages in this process are medium, low, high, dashboard.
-
 Addressable market in sector ppt slides structure
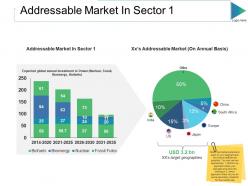
Presenting this set of slides with name - Addressable Market In Sector Ppt Slides Structure. This is a two stage process. The stages in this process are Addressable Market In Sector, Addressable Market, South Africa, Europe, Japan.
-
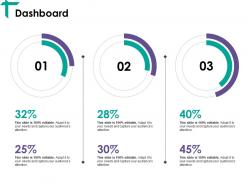 Dashboard Snapshot ppt visual aids gallery
Presenting this set of slides with name - Dashboard Snapshot Ppt Visual Aids Gallery. This is a three stage process. The stages in this process are Business, Marketing, Dashboard, Percentage, Strategy.
-
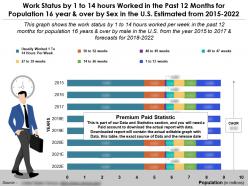 Work status by 1 to 14 hours in past 12 months for 16 year and over by sex in the us from 2015-22
Presenting this set of slides with name - Work Status By 1 To 14 Hours In Past 12 Months For 16 Year And Over By Sex In The US From 2015-22. Work Status By 1 To 14 Hours Worked In The Past 12 Months For Population 16 Year And Over By Sex In The U.S Estimated From 2015 to 2022. This is part of our Data and Statistics products selection, and you will need a Paid account to download the actual report with accurate data. Downloaded report will contain the actual editable graph with the actual data, an excel table with the actual data, the exact source of the data and the release date. This Graph Shows The Work Status By 1 To 14 Hours Worked Per Week In The Past 12 Months For Population 16 Years And Over By Male And Female In The U.S From The Year 2015 To 2017 And Forecasts For 2018 to 2022. It covers topic Work Status By 1 To 14 Hours Worked In U.S for region USA and is for date range 2015 to 22. Download it immediately and use it for your business.
-
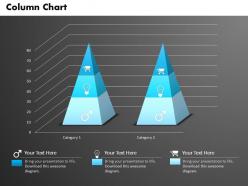 0514 3d triangular chart for data driven result display powerpoint slides
We are proud to present our 0514 3d triangular chart for data driven result display powerpoint slides. A triangular data driven chart is used in this Business power Point template. Use this template for sequential data flow in any presentation.
-
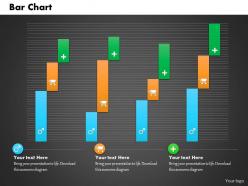 0514 unique pattern sales data driven chart powerpoint slides
We are proud to present our 0514 unique pattern sales data driven chart powerpoint slides. To display sales result analysis use our line chart graphic template. Use this professional business power point template in your presentation and get noticed. Enjoy the fun of presentation making with our great collection.
-
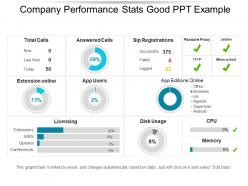 Company performance stats good ppt example
Presenting company performance stats good PPT example. This layout is fully compatible with Google Slides and data driven. User can edit the data in linked excel sheet and graphs and charts gets customized accordingly. Easy to put in company logo, trademark or name; accommodate words to support the key points. Images do no distort out even when they are projected on large screen. Adjust colors, text and fonts as per your business requirements. . This template is suitable for marketing, sales persons, business managers and entrepreneurs.
-
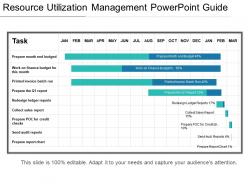 Resource utilization management powerpoint guide
Ease of customization. Replace any words, picture or number provided in the template with your own content and use it for presentation. You may even incorporate your own company’s name and logo in the presentation for personalization. The visuals used are of high resolution, therefore no issue of image pixelation if projected on the wide screen. Moreover, the presentation is compatible with numerous format and software options. Widely used by every business researcher, analyst, company owner, marketer, consultant, academician, and more.
-
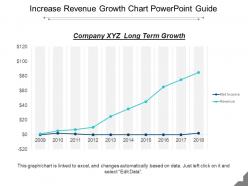 Increase revenue growth chart powerpoint guide
Presenting Increase revenue growth chart PowerPoint guide. This presentation slide is totally supported with Google Slides. This layout offers an easy conversion to other software like JPG and PDF formats. The image quality of these slides remains unchanged even when you enlarge the image or portray on large screens. This template is easily downloadable template and offers simple editing options with its color schemes, text, and fonts. User can edit the data in linked excel sheet and graphs and charts gets customized accordingly.
-
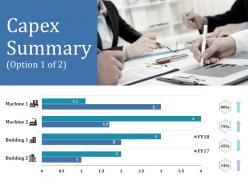 Capex summary ppt outline
Presenting this set of slides with name - Capex Summary Ppt Outline. This is a four stage process. The stages in this process are Capex Summary, Finance, Analysis, Business, Marketing.
-
 Financial ppt portfolio
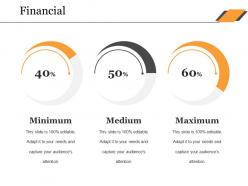
Presenting this set of slides with name - Financial Ppt Portfolio. This is a three stage process. The stages in this process are Minimum, Medium, Maximum, Financial.
-
 Bar chart ppt model
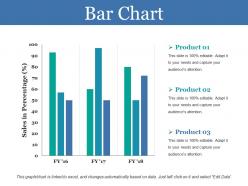
Presenting this set of slides with name - Bar Chart Ppt Model. This is a three stage process. The stages in this process are Bar Chart, Finance, Analysis, Business, Management.
-
 Month growth and sales e commerce dashboard
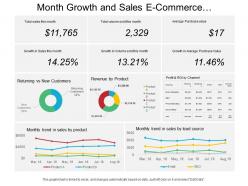
Presenting this set of slides with name - Month Growth And Sales E Commerce Dashboard. This is a seven stage process. The stages in this process are Mercantilism, Commercialism, Ecommerce.
-
 Comparison marketing management ppt powerpoint presentation outline inspiration
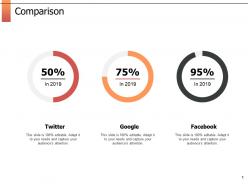
Presenting this set of slides with name - Comparison Marketing Management Ppt Powerpoint Presentation Outline Inspiration. This is a three stages process. The stages in this process are Finance, Marketing, Management, Investment, Analysis.
-
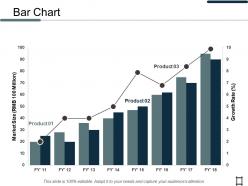 Bar chart business marketing ppt professional design inspiration
Presenting this set of slides with name - Bar Chart Business Marketing Ppt Professional Design Inspiration. This is a three stage process. The stages in this process are Finance, Analysis, Business, Investment, Marketing.
-
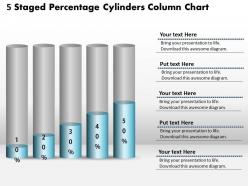 0414 5 staged percentage cylinders column chart powerpoint graph
We are proud to present our 0414 5 staged percentage cylinders column chart powerpoint graph. Brilliant backdrops are the essence of our 5 Staged Percentage Cylinders Column Chart PowerPoint Graph Powerpoint Templates. Guaranteed to illuminate the minds of your audience. Our 5 Staged Percentage Cylinders Column Chart PowerPoint Graph Powerpoint Templates are conceived by a dedicated team. Use them and give form to your wondrous ideas.
-
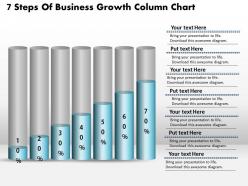 0414 7 steps of buisness growth column chart powerpoint graph
We are proud to present our 0414 7 steps of buisness growth column chart powerpoint graph. Use our 7 Steps Of Buisness Growth Column Chart PowerPoint Graph Powerpoint Templates to weave a web of your great ideas. They are guaranteed to attract even the most critical of your colleagues. Our 7 Steps Of Buisness Growth Column Chart PowerPoint Graph Powerpoint Templates are designed to help you succeed. They have all the ingredients you need.
-
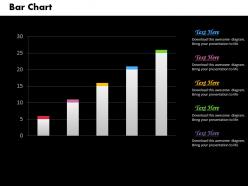 0414 business data driven column chart powerpoint graph
We are proud to present our 0414 business data driven column chart powerpoint graph. Clear and concise is the credo of our 0414 Business Data Driven Column Chart Powerpoint Graph Powerpoint Templates. Use them and dispel any doubts your team may have. Effective communication is what our 0414 Business Data Driven Column Chart Powerpoint Graph Powerpoint Templates ensure. They help you put across your views with precision and clarity.
-
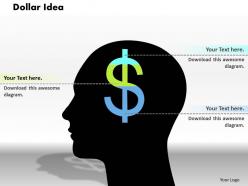 0414 human face dollar bar chart powerpoint graph
We are proud to present our 0414 human face dollar bar chart powerpoint graph. Illuminate the road ahead withour Human Face Dollar Bar Chart Powerpoint Graph Powerpoint Templates. Pinpoint the important landmarks along the way. Blaze a trail with our innovative Human Face Dollar Bar Chart Powerpoint Graph Powerpoint Templates. Clearly mark the path for others to follow.
-
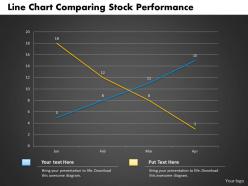 0414 line chart comparing stock performance powerpoint graph
We are proud to present our 0414 line chart comparing stock performance powerpoint graph. Our Line Chart Comparing Stock Performance Powerpoint Graph Powerpoint Templates are creatively constructed and eye catching. Focus attention on the key issues of your presentation. Use our Line Chart Comparing Stock Performance Powerpoint Graph Powerpoint Templates and nail the day. Lead your team show them the way.
-
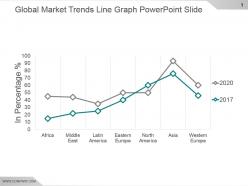 Global market trends line graph powerpoint slide
Presenting global market trends line graph powerpoint slide. This is a global market trends line graph powerpoint slide. This is a two stage process. The stages in this process are africa, middle east, latin america, eastern europe, north america, asia, western europe.
-
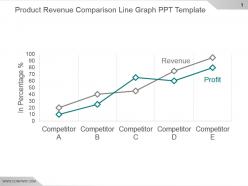 Product revenue comparison line graph ppt template
Presenting product revenue comparison line graph ppt template. This is a product revenue comparison line graph ppt template. This is a two stage process. The stages in this process are revenue, profit, competitor.
-
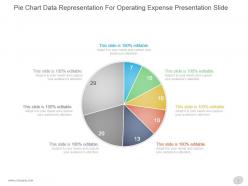 Pie chart data representation for operating expense presentation slide
Presenting pie chart data representation for operating expense presentation slide. This is a pie chart data representation for operating expense presentation slide. This is a seven stage process. The stages in this process are business, marketing, pie, circle, piece.


