- Sub Categories
-
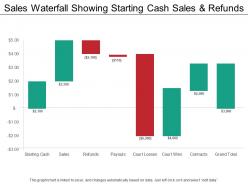 Sales waterfall showing starting cash sales and refunds
Presenting this set of slides with name - Sales Waterfall Showing Starting Cash Sales And Refunds. This is a eight stage process. The stages in this process are Sales Waterfall, Waterfall Chart.
-
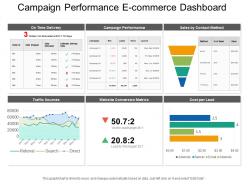 Campaign performance e commerce dashboard
Presenting this set of slides with name - Campaign Performance E Commerce Dashboard. This is a six stage process. The stages in this process are Mercantilism, Commercialism, Ecommerce.
-
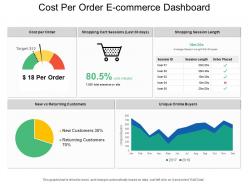 Cost per order e commerce dashboard
Presenting this set of slides with name - Cost Per Order E Commerce Dashboard. This is a five stage process. The stages in this process are Mercantilism, Commercialism, Ecommerce.
-
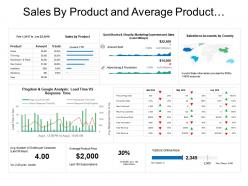 Sales by product and average product price e commerce dashboard
Presenting this set of slides with name - Sales By Product And Average Product Price E Commerce Dashboard. This is a eight stage process. The stages in this process are Mercantilism, Commercialism, Ecommerce.
-
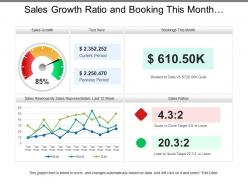 Sales growth ratio and booking this month dashboard
Presenting this set of slides with name - Sales Growth Ratio And Booking This Month Dashboard. This is a four stage process. The stages in this process are Sales Dashboard, Sales Kpis, Sales Performance.
-
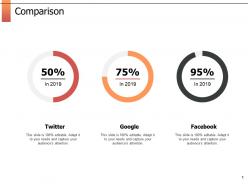 Comparison marketing management ppt powerpoint presentation outline inspiration
Presenting this set of slides with name - Comparison Marketing Management Ppt Powerpoint Presentation Outline Inspiration. This is a three stages process. The stages in this process are Finance, Marketing, Management, Investment, Analysis.
-
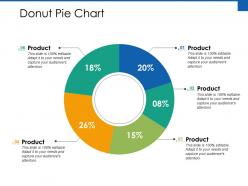 Donut pie chart finance ppt powerpoint presentation file backgrounds
Presenting this set of slides with name - Donut Pie Chart Finance Ppt Powerpoint Presentation File Backgrounds. This is an editable five stages graphic that deals with topics like Donut Pie Chart, Product, Percentage, Business, Marketing to help convey your message better graphically. This product is a premium product available for immediate download, and is 100 percent editable in Powerpoint. Download this now and use it in your presentations to impress your audience.
-
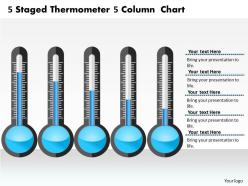 0414 5 staged thermometer 5 column chart powerpoint graph
We are proud to present our 0414 5 staged thermometer 5 column chart powerpoint graph. Hit the right notes with our 5 Staged Thermometer 5 Column Chart PowerPoint Graph Powerpoint Templates. Watch your audience start singing to your tune. Walk your team through your plans using our 5 Staged Thermometer 5 Column Chart PowerPoint Graph Powerpoint Templates. See their energy levels rise as you show them the way.
-
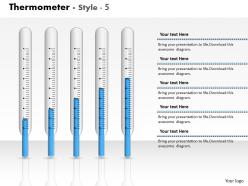 0414 column chart thermometer graph powerpoint graph
Impressive visuals of high quality. Good quality resolution. No issue of blurred images when projected on wide screen. Compatible with multiple number of online and offline software options. Ease of personalization and customization. Add the data and figures with ease. For assistance refer to the editing guidance provided in the presentation itself. Effectively downloaded and used by entrepreneurs, strategists, marketers, students and teachers.
-
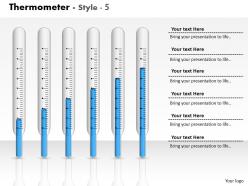 0414 data display with thermometer column chart powerpoint graph
We are proud to present our 0414 data display with thermometer column chart powerpoint graph. You have a driving passion to excel in your field. Our 0414 Data Display With Thermometer Column Chart Powerpoint Graph Powerpoint Templates will prove ideal vehicles for your ideas. You are well armed with penetrative ideas. Our 0414 Data Display With Thermometer Column Chart Powerpoint Graph Powerpoint Templates will provide the gunpowder you need.
-
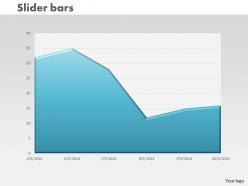 0414 slider area chart to present data powerpoint graph
We are proud to present our 0414 slider area chart to present data powerpoint graph. Deadlines are an element of todays workplace. Our Slider Area Chart To Present Data Powerpoint Graph Powerpoint Templates help you meet the demand. Just browse and pick the slides that appeal to your intuitive senses. Our Slider Area Chart To Present Data Powerpoint Graph Powerpoint Templates will help you be quick off the draw. Just enter your specific text and see your points hit home.
-
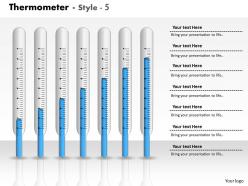 0414 thermometer graph column chart powerpoint graph
Can be viewed in 4: 3 standard screen size or 16:9 wide screen size. PPT design has many supporting actions like write, erase, correct, clean and select. Internet based click facilities like image search, oxford dictionary and others can be added with. ease and gives professional look to the PPT slide. Enables real time edition or collaboration with auto saving options.
-
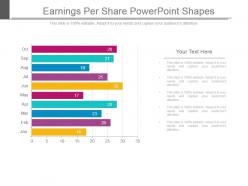 Earnings per share powerpoint shapes
Presenting earnings per share powerpoint shapes. This is a earnings per share powerpoint shapes. This is a ten stage process. The stages in this process are jan, feb, mar, apr, may, jun, jul, aug, sep, oct.
-
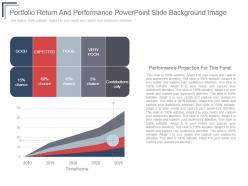 Portfolio return and performance powerpoint slide background image
Presenting portfolio return and performance powerpoint slide background image. This is a portfolio return and performance powerpoint slide background image. This is a five stage process. The stages in this process are good, expected, poor, very poor, contributions only.
-
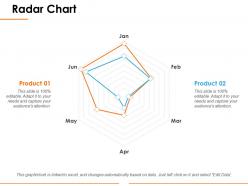 Radar chart ppt influencers
Presenting the radar chart presentation template. The spider web PPT template is designed under the supervision of professionals and is 100% customizable in PowerPoint. The business professional can bring changes to the objects like font color and font size in this slide and save it in JPG or PDF file format hassle-free. This slide is 100% compatible with Google Slide. Fast download this template at the click of the button.
-
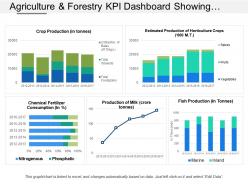 Agriculture and forestry kpi dashboard showing crop production and chemical fertilizers consumptions
Displaying agriculture and forestry KPI dashboard showing crop production and chemical fertilizers consumptions presentation slide. Modify the design with trademark and picture. PowerPoint diagram is well-matched with Google slides. Colors and text can be amended as the PPT graphic comes with easy to use editing options. Presentation design can be delivered in both standard and widescreen display view. Flexible with other software options such as PDF or JPG formats as can be converted effortlessly.
-
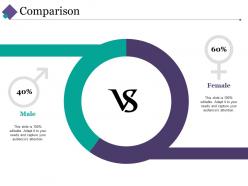 Comparison ppt layouts graphics
Introducing comparison PPT layout graphics design. Hasty download and easy to share in JPG and PDF. Tailor the design with commerce name, logo, icon, image and tagline. High quality PowerPoint slide available with adjustable options as color, text and font can be adjusted at any stage as per your requirement. Option to share presentation graphic in standard and widescreen display view. PPT template is accessible with different nodes and stages.
-
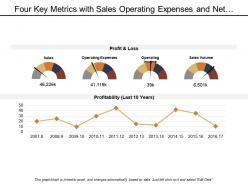 Four key metrics with sales operating expenses and net income
The design template can be downloaded on a single click from SlideTeam web page. Design can be saved as JPEG or PDF formats. Best advantage of this design template is that it’s completely editable; you can modify and customize the design template according to your business needs. The PowerPoint design is completely supported on standard and full screen view, no effect on design quality when opened on full screen view.
-
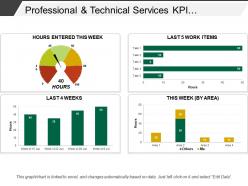 Professional and technical services kpi dashboard snapshot showing timesheet
Presenting this set of slides with name - Professional And Technical Services Kpi Dashboard Snapshot Showing Timesheet. This is a four stage process. The stages in this process are Professional And Technical Services, Services Management, Technical Management.
-
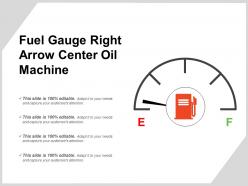 Fuel gauge right arrow center oil machine
Presenting this set of slides with name - Fuel Gauge Right Arrow Center Oil Machine. This is a one stage process. The stages in this process are Fuel Gauge, Gas Gauge, Fuel Containers.
-
 Logistics dashboard with delivery on time and quarter to date
Presenting Logistics Dashboard With Delivery On Time And Quarter To Date PPT slide. The delivery on time dashboard PowerPoint template designed professionally by the team of SlideTeam to present the approximate delivery time to clients and investors as well. The different icons such as vehicle, dollar, speed meter and many other, as well as text in the quarter to date dashboard slide are customizable in PowerPoint and can help you in sharing the average time required for an order get ready and delivered. The logistics delivery dashboard slide is compatible with Google Slide. A user can make changes in the font size, font type, color and dimensions of the different icons to present the desired delivery time.
-
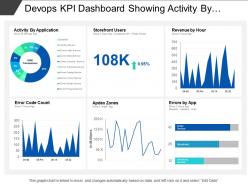 Devops kpi dashboard showing activity by application and errors by app
Presenting this set of slides with name - Devops Kpi Dashboard Showing Activity By Application And Errors By App. This is a six stage process. The stages in this process are Development And Operations, Devops.
-
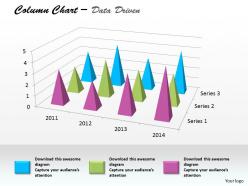 Data driven 3d column chart for business project powerpoint slides
We are proud to present our data driven 3d column chart for business project powerpoint slides. Our Data Driven Column 3D Chart For Business Project Powerpoint slides Power Point Templates Will Provide Weight To Your Words. They Will Bring Out The Depth Of Your Thought Process. Words Like Arrows Fly Straight And True. Use Our Data Driven 3D Column Chart For Business Project Powerpoint slides Power Point Templates To Make Them Hit Bulls eye Every time.
-
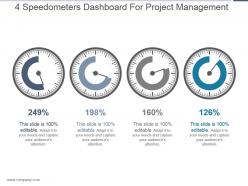 4 speedometers dashboard for project management good ppt example
Presenting 4 speedometers dashboard for project management good ppt example. This is a 4 speedometers dashboard for project management good ppt example. This is a four stage process. The stages in this process are business, marketing, dashboard, measuring, management.
-
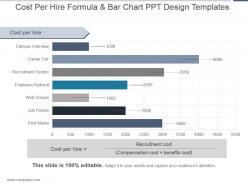 Cost per hire formula and bar chart ppt design templates
Presenting cost per hire formula and bar chart ppt design templates. This is a cost per hire formula and bar chart ppt design templates. This is a seven stage process. The stages in this process are cost per hire, campus interview, career fair, requirement vendor, employee referral, web groups, job portals, print media, cost per hire, recruitment cost, compensation cost benefits cost.
-
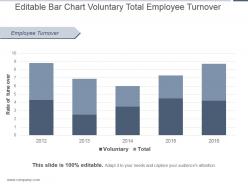 Editable bar chart voluntary total employee turnover ppt icon
Presenting editable bar chart voluntary total employee turnover ppt icon. This is a editable bar chart voluntary total employee turnover ppt icon. This is a five stage process. The stages in this process are employee turnover, rate of turn over, voluntary, total.
-
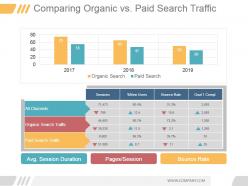 Comparing organic vs paid search traffic ppt background
Presenting comparing organic vs paid search traffic ppt background. This is a comparing organic vs paid search traffic ppt background. This is a four stage process. The stages in this process are all channels, organic search traffic, paid search traffic, avg session duration, pages session, bounce rate, sessions, new users, bounce rate, goal 1 compl, organic search, paid search.
-
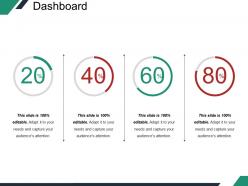 Dashboard snapshot powerpoint themes template 2
Presenting dashboard snapshot powerpoint themes template 2. This is a combo chart powerpoint slides template 2. This is a four stage process. The stages in this process are percentage, finance, donut, business.
-
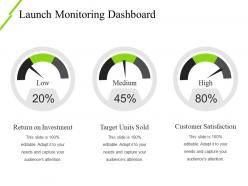 Launch monitoring dashboard snapshot ppt design
Presenting launch monitoring dashboard Snapshot ppt design. This is a launch monitoring dashboard ppt design. This is a three stage process. The stages in this process are return on investment, target units sold, customer satisfaction, low, medium, high.
-
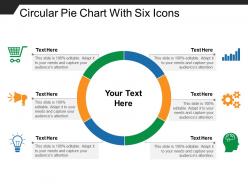 Circular pie chart with six icons
Presenting circular pie chart with six icons. This is a circular pie chart with six icons. This is a six stage process. The stages in this process are customer insight, consumer insight, customer experience.
-
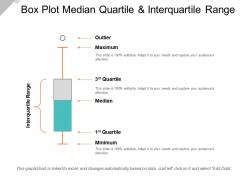 Box plot median quartile and interquartile range
Presenting Box Plot Median Quartile And Interquartile Range template. This slide supports both the widescreen (16:9) and the standard screen aspect ratios(4:3). Add appealing content like charts and graphs to the presentation. The slide is also compatible with Google Slides. This PPT can be converted into common image formats like JPEG, PNG or document formats such as PDF. High-quality graphics will prevent the deterioration of slide components.
-
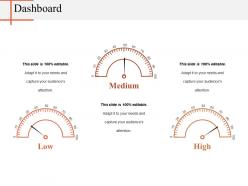 Dashboard powerpoint slide deck samples
Presenting this set of slides with name - Dashboard Powerpoint Slide Deck Samples. This is a three stage process. The stages in this process are Dashboard, Strategy, Finance, Planning, Measure.
-
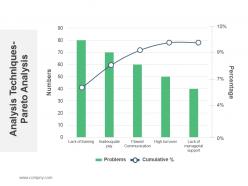 Analysis techniques pareto analysis ppt sample
Presenting analysis techniques pareto analysis ppt sample. This is a analysis techniques pareto analysis ppt sample. This is a five stage process. The stages in this process are analysis techniques pareto analysis.
-
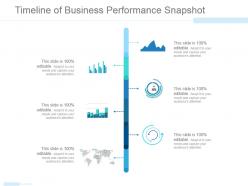 Timeline of business performance snapshot ppt infographics
Presenting timeline of business performance snapshot ppt infographics. This is a timeline of business performance snapshot ppt infographics. This is a six stage process. The stages in this process are arrows, step, business, marketing, growth.
-
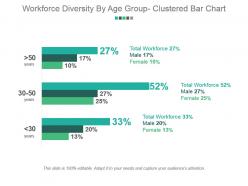 Workforce diversity by age group clustered bar chart powerpoint slide deck template
Presenting workforce diversity by age group clustered bar chart powerpoint slide deck template. This is a workforce diversity by age group clustered bar chart powerpoint slide deck template. This is a three stage process. The stages in this process are total workforce, male, female.
-
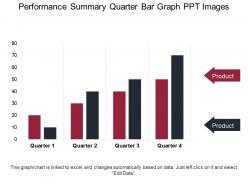 Performance summary quarter bar graph ppt images
Presenting Performance Summary Quarter Bar Graph PPT Images. Customize the slide as per your needs. Match it to your organizational presentation theme. Alter the colors, font style, font type and the background of the slide. The slide can be saved into formats like JPG, JPEG, PNG and PDF file formats. It goes well with the Google Slides and with the major Microsoft versions. Can be viewed on a standard screen and widescreen size because of its splendid pixel quality.
-
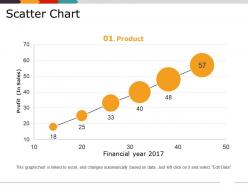 Scatter chart powerpoint themes
Presenting scatter chart powerpoint themes. This is a scatter chart powerpoint themes. This is a six stage process. The stages in this process are financial year, business, percentage, growth, profit.
-
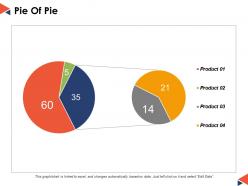 Pie of pie ppt powerpoint presentation file portfolio
This is a four stages process. The stages in this process are Pie Chart, Percentage, Marketing, Business, Analysis.
-
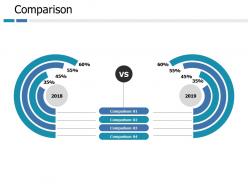 Comparison business ppt portfolio slide portrait
Presenting this set of slides with name - Comparison Business Ppt Portfolio Slide Portrait. This is a two stage process. The stages in this process are Comparison, Planning, Marketing, Finance, Strategy.
-
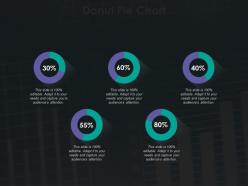 Donut pie chart ppt summary guidelines
Presenting this set of slides with name - Donut Pie Chart Ppt Summary Guidelines. This is a five stage process. The stages in this process areBusiness, Management, Strategy, Analysis, Marketing.
-
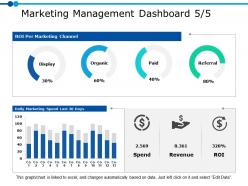 Marketing management dashboard 5 5 ppt powerpoint presentation gallery graphics
Presenting this set of slides with name - Marketing Management Dashboard 5 5 Ppt Powerpoint Presentation Gallery Graphics. This is a three stage process. The stages in this process are Business, Management, Strategy, Analysis, Marketing.
-
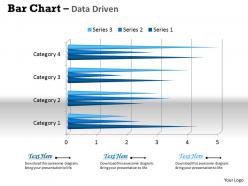 Data driven 3d bar chart for business trends powerpoint slides
We are proud to present our data driven 3d bar chart for business trends powerpoint slides. This PowerPoint chart can be used to illustrate many types of data. It should be used to make facts clearer and more understandable. Quick way for the audience to visualize what you are saying numbers trends up or down .
-
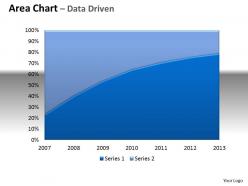 Data driven area chart with plotted line in center powerpoint slides
We are proud to present our data driven area chart with plotted line in center powerpoint slides. Seamlessly Flow From Idea To Idea. Our Data Driven Area Chart With Plotted Line In Center Powerpoint Slides Power Point Templates Give You The Threads To Weave. Ride The Surf With Our Data Driven Area Chart With Plotted Line In Center Powerpoint Slides Power Point Templates. They Will Keep You Upright Till You Hit The Shore.
-
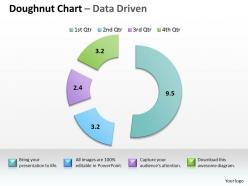 Data driven completion in project management powerpoint slides
We are proud to present our data driven completion in project management powerpoint slides. Add Color To Your Speech With Our Data Driven Completion In Project Management Powerpoint Slides Power Point Templates. Your Presentation Will Leave Your Audience Speechless. Experience Excellence With Our Data Driven Completion In Project Management Powerpoint Slides Power Point Templates. They Will Take Your Breath Away.
-
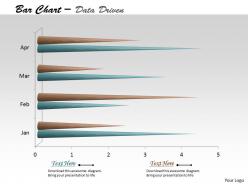 Data driven 3d time based bar chart powerpoint slides
We are proud to present our data driven 3d time based bar chart powerpoint slides. Whatever The Nuance You Want To Project. We Have A 3D Data Driven Time Based Bar Chart Powerpoint slides Power Point Templates That Will Get It Across. Create A Connection With Your Audience Using Our 3D Data Driven Time Based Bar Chart Powerpoint slides Power Point Templates. Transfer Your Depth Of Knowledge Clearly Across To Them.
-
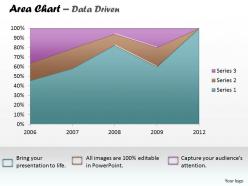 Data driven business reporting area chart powerpoint slides
We are proud to present our data driven business reporting area chart powerpoint slides. Let Our Data Driven Business Reporting Area Chart Powerpoint slides Power Point Templates Be The Vehicle Of Your Successful Journey. Ride The Bus To Glory With Your Grand Ideas. Our Data Driven Business Reporting Area Chart Powerpoint slides Power Point Templates Are Like A Basic Christmas Tree. Decorate It With Your Beautiful Thoughts And Spread Joy And Happiness.
-
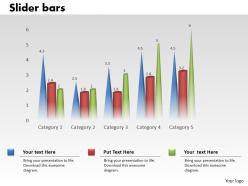 0414 data sets column chart illustration powerpoint graph
We are proud to present our 0414 data sets column chart illustration powerpoint graph. Our 0414 Data Sets Column Chart Illustration Powerpoint Graph Powerpoint Templates are like the strings of a tennis racquet. Well strung to help you serve aces. Aesthetically crafted by artistic young minds. Our 0414 Data Sets Column Chart Illustration Powerpoint Graph Powerpoint Templates are designed to display your dexterity.
-
 Market cost distribution pie chart ppt slide
Presenting market cost distribution pie chart ppt slide. This is a market cost distribution pie chart ppt slide. This is a seven stage process. The stages in this process are purchases, wages, other, rent and utilities, marketing, profit, depreciation.
-
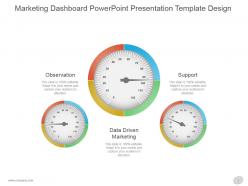 Marketing dashboard snapshot powerpoint presentation template design
Presenting marketing dashboard snapshot powerpoint presentation template design. This is a marketing dashboard powerpoint presentation template design. This is a three stage process. The stages in this process are observation, data driven marketing, support.
-
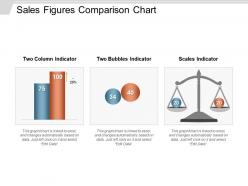 Sales figures comparison chart powerpoint slide deck
PPT design allows full editing. Excel linked charts and graphs have been used in design. Just add your numbers and information to these already visually impactful PPT slides and quickly prepare your presentation. Design is instantly downloadable into JPEG and PDF formats. PPT design can be accessed on both standard and full screen design views. Design template is fully compatible with Google Slides and MS PowerPoint software.
-
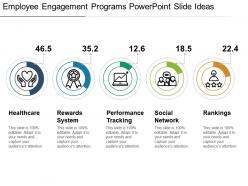 Employee engagement programs powerpoint slide ideas
Presenting a PPT template named Employee engagement programs PowerPoint slide ideas. It is a professionally designed template and is fully customizable. You can edit the colour, text and font size as per your need. You can add or delete the content if required. The slide is compatible with Google slides and can be exported in both PDF as well as JPG formats. You can avail this PPT slide in both standard screen size and wide screen size. Add or remove high quality graphic icons in the PPT slide. You are just a click to away to have this readymade presentation. Click the download button now.
-
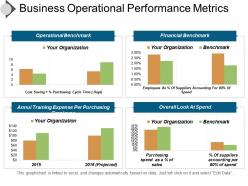 Business operational performance metrics ppt slide
Presenting business operational performance metrics PPT slide. PPT can be easily updated by anyone. Our professional PPT experts are available to support you in updating the design. Modify and personalize as per your business preferences. PPT is compatible with Google Slides and Microsoft PowerPoint. Instant and quick downloading is available. Download and convert the design into JPEG and PDF formats.
-
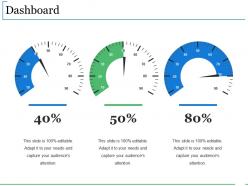 Dashboard snapshot ppt background designs
Presenting this set of slides with name - Dashboard Snapshot Ppt Background Designs. This is a three stage process. The stages in this process are Dashboard, Marketing, Strategy, Planning, Speed.
-
 Pie chart ppt file design templates
Presenting this set of slides with name - Pie Chart Ppt File Design Templates. This is a four stage process. The stages in this process are Product, Pie, Process, Percentage, Finance.
-
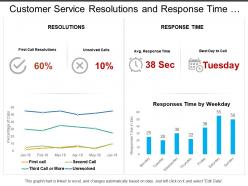 Customer service resolutions and response time dashboard
Presenting customer service resolutions and response time dashboard PPT template slide. This template slide is fully adjustable with Google Slide. You can edit the color, text style, font size of the template content as per need. The template is easy to download and can be saved in PDF, and JPEG formats. For guidance, additional instructional slides are available. Superior quality graphics are used. The quality of the slide image does not blur when viewed on a large screen. Dummy content can be replaced with other valuable information. You can personalize the template by adding your company name, and signature.
-
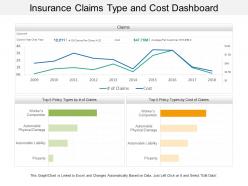 Insurance claims type and cost dashboard
• Stunning match of topic and visuals. • Professional proficiency and brilliant craftsmanship. • Ease of personalization. • Ease of customization with desired contents. • Special assistance to execute the changes has been provided. • Compatibility with multiple numbers of formats. • Compatibility with numerous software options available both online and offline. • High resolution • Used by marketing and business professionals, students and teachers.
-
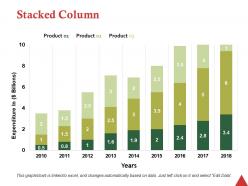 Stacked column ppt professional rules
Presenting this set of slides with name - Stacked Column Ppt Professional Rules. This is a three stage process. The stages in this process are Business, Management, Strategy, Analysis, Marketing.
-
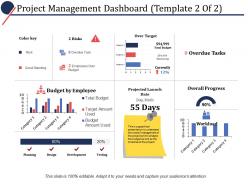 Project management dashboard ppt powerpoint presentation file graphic images
Presenting this set of slides with name - Project Management Dashboard Ppt Powerpoint Presentation File Graphic Images. This is a four stage process. The stages in this process are Business, Management, Marketing, Percentage, Product.
-
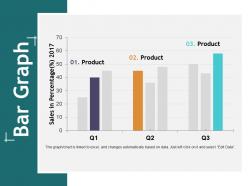 Bar graph ppt show graphic images
Presenting this set of slides with name - Bar Graph Ppt Show Graphic Images. This is a three stage process. The stages in this process are Business, Management, Strategy, Analysis, Marketing.
-
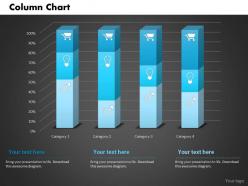 0514 data driven chart for shopping powerpoint slides
We are proud to present our 0514 data driven chart for shopping powerpoint slides. To display shopping related analyses in any business presentation use our creative Business Power Point template with data driven techniques.


