- Sub Categories
-
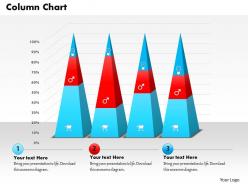 0514 data driven triangular bar graph powerpoint slides
We are proud to present our 0514 data driven triangular bar graph powerpoint slides. A triangular shape data driven bar graph is used in this Business power Point template. Use this template for sequential data flow in any presentation.
-
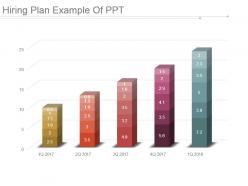 Hiring plan example of ppt
Presenting hiring plan example of ppt. Presenting hiring plan example of ppt. Presenting hiring plan example of ppt. This is a hiring plan example of ppt. This is five stage process. The stages in this process are business, growth, finance, marketing, strategy, analysis.
-
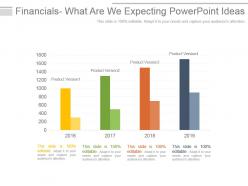 Year based financial analysis powerpoint ideas
Presenting year based financial analysis powerpoint ideas. This is a year based financial analysis powerpoint ideas. This is a four stage process. The stages in this process are product version, business, marketing, process, success.
-
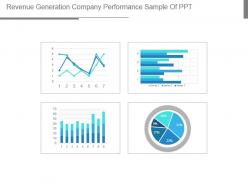 Revenue generation company performance sample of ppt
Presenting revenue generation company performance sample of ppt. This is a revenue generation company performance sample of ppt. This is a four stage process. The stages in this process are business, marketing, graph, percentage, success.
-
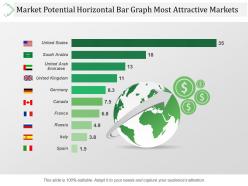 Market potential horizontal bar graph most attractive markets ppt images
Presenting market potential horizontal bar graph most attractive markets ppt images. This is a market potential horizontal bar graph most attractive markets ppt images. This is a two stage process. The stages in this process are business, marketing, strategy, finance, investment, success, location, geography.
-
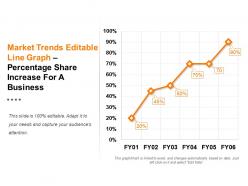 Market trends editable line graph percentage share increase for a business ppt design
Presenting market trends editable line graph percentage share increase for a business ppt design. This is a market trends editable line graph percentage share increase for a business ppt design. This is a six stage process. The stages in this process are business, finance, bar graph, marketing, management.
-
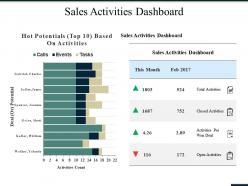 Sales activities dashboard ppt summary maker
Presenting this set of slides with name - Sales Activities Dashboard Ppt Summary Maker. This is a two stage process. The stages in this process are Sales Activities Dashboard, This Month, Deal, Activities Count, Business.
-
 Dashboard Snapshot ppt visual aids slides
Presenting this set of slides with name - Dashboard Snapshot Ppt Visual Aids Slides. This is a three stage process. The stages in this process are Dashboard, Meter, Speed, Measure, Planning.
-
 Comparison ppt slides
Presenting this set of slides with name - Comparison Ppt Slides. This is a two stage process. The stages in this process are Comparison, Male, Female.
-
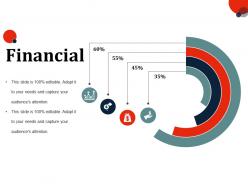 Financial ppt slides example introduction
Presenting this set of slides with name - Financial Ppt Slides Example Introduction. This is a four stage process. The stages in this process are Finance, Business, Marketing, Percentage, Icons.
-
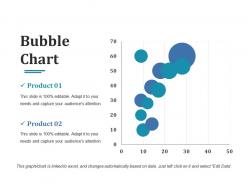 Bubble chart ppt designs
Presenting this set of slides with name - Bubble Chart Ppt Designs. This is a two stage process. The stages in this process are Bubble Chart, Finance, Business, Marketing, Analysis.
-
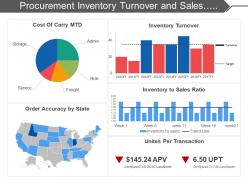 Procurement inventory turnover and sales ratio dashboard
Presenting this set of slides with name - Procurement Inventory Turnover And Sales Ratio Dashboard. This is a five stage process. The stages in this process are Purchase, Procurement, Buy.
-
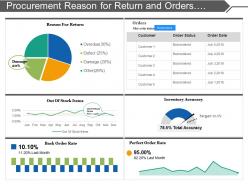 Procurement reason for return and orders detail dashboard
Presenting this set of slides with name - Procurement Reason For Return And Orders Detail Dashboard. This is a six stage process. The stages in this process are Purchase, Procurement, Buy.
-
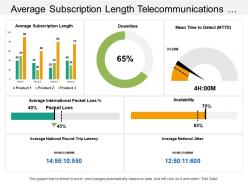 Average subscription length telecommunications dashboard
Presenting this set of slides with name - Average Subscription Length Telecommunications Dashboard. Pre-designed presentation slide can be shared easily as comes in both standard and widescreen view. Fully amendable PowerPoint design can be modified as per your preference. Picture quality is perfect as pixels remain same even when you share with large number of audiences. PPT template can be downloaded with different nodes and stages and well accustomed with all the software’s options such as JPG and PDF and even with Google slides.
-
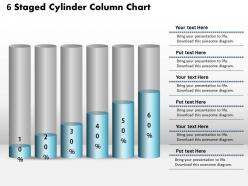 0414 6 staged cylinder column chart powerpoint graph
We are proud to present our 0414 6 staged cylinder column chart powerpoint graph. Our 6 Staged Cylinder Column Chart PowerPoint Graph Powerpoint Templates are created with admirable insight. Use them and give your group a sense of your logical mind. Use our 6 Staged Cylinder Column Chart PowerPoint Graph Powerpoint Templates to bullet point your ideas. See them fall into place one by one.
-
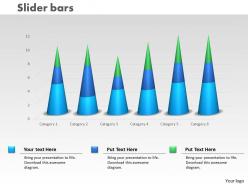 0414 slider column chart for business trends powerpoint graph
We are proud to present our 0414 slider column chart for business trends powerpoint graph. Our Slider Column Chart For Business Trends Powerpoint Graph Powerpoint Templates offer you the needful to organize your thoughts. Use them to list out your views in a logical sequence. Our Slider Column Chart For Business Trends Powerpoint Graph Powerpoint Templates are created by a hardworking bunch of busy bees. Always flitting around with solutions guaranteed to please.
-
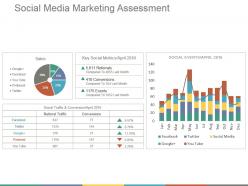 Social media marketing assessment ppt background designs
Presenting the social media marketing PowerPoint PPT. This slide is fully customizable PowerPoint template to communicate your ideas clearly. You can easily edit the charts and graphs in excel sheet. This presentation slide is designed with elegant shapes and visuals. You can convert this slide into numerous format options like JPEG, JPG or PDF. This template gives a professional outlook to your PowerPoint presentation. It is easy to customize each graphics and text as per your need. You can download it easily at a click of button.
-
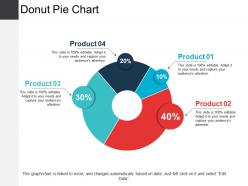 Donut pie chart ppt presentation examples
Presenting Donut Pie Chart PPT Presentation Examples. You can alter the font size, font type, font color, and shape used according to your needs as this PPT layout is 100% customizable. This PowerPoint template is Google Slides compatible and is easily accessible. This easy to download PPT theme can be easily opened and saved in various formats like JPG, PDF, and PNG.
-
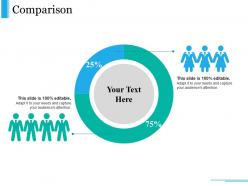 Comparison presentation pictures
Presenting this set of slides with name - Comparison Presentation Pictures. This is a two stage process. The stages in this process are Business, Marketing, Finance, Compare, Analysis.
-
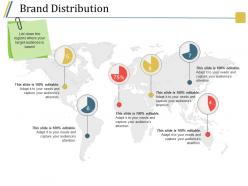 Brand distribution powerpoint show
Presenting brand distribution powerpoint show. This is a brand distribution powerpoint show. This is a six stage process. The stages in this process are pie, location, percentage, map, geographical.
-
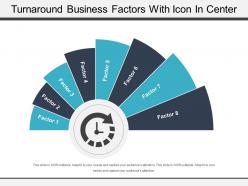 Turnaround business factors with icon in center
Presenting turnaround business factors with icon in center. This is a turnaround business factors with icon in center. This is a eight stage process. The stages in this process are turnaround, looking back, u turn.
-
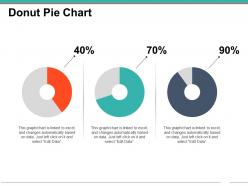 Donut pie chart powerpoint slide clipart
Presenting donut pie chart powerpoint slide clipart. This is a donut pie chart powerpoint slide clipart. This is a three stage process. The stages in this process are business, marketing, process, percentage, strategy.
-
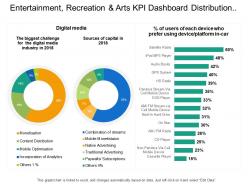 Entertainment recreation and arts kpi dashboard showing digital media sources of capital
Presenting this set of slides with name - Entertainment Recreation And Arts Kpi Dashboard Showing Digital Media Sources Of Capital. This is a three stage process. The stages in this process are Entertainment, Recreation And Arts, Attractions, Culture, Entertainment.
-
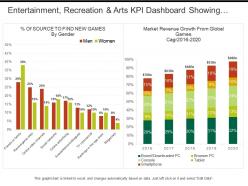 Entertainment recreation and arts kpi dashboard showing market revenue growth
Presenting this set of slides with name - Entertainment Recreation And Arts Kpi Dashboard Showing Market Revenue Growth. This is a two stage process. The stages in this process are Entertainment, Recreation And Arts, Attractions, Culture, Entertainment.
-
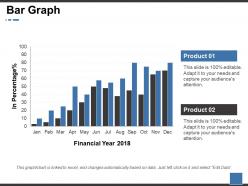 Bar graph ppt summary guidelines
Grab an opportunity to go through the bar graph PowerPoint presentation slide. This presentation has been designed under the strict supervision of professionals and is fully editable. You can remodel the font size, font type, colors, and even the background. This Template is practicable with Google Slide and can be saved in JPG or PDF format without any hurdles created during the process. Fast download at the click of the button provided below.
-
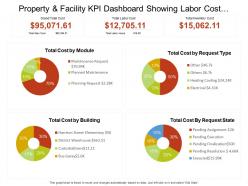 Property and facility kpi dashboard showing labor cost and inventory cost
Presenting Property And Facility KPI Dashboard Showing Labor Cost And Inventory Cost PPT slide. The pie chart dashboard PowerPoint template designed professionally by the team of SlideTeam to present the factors that contributed to the total cost. The pie chart value gets edited as a user can link it with the Excel Sheet. The Pie Chart of labor cost dashboard slide is customizable in PowerPoint. The Inventory Cost Dashboard template is also compatible with Google Slide. A user may do alteration in the font size, font type, color and dimensions of the pie chart to present the desired total cost.
-
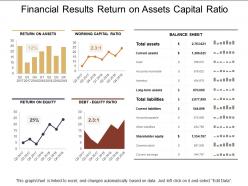 Financial results return on assets capital ratio
Sharing financial results return on assets capital ratio presentation slide. PowerPoint design can be downloaded and save into JPG and PDF format. PPT template can be downloaded in standard and widescreen view. Fully compliant slide design with Google slides. Easy to edit as color, text and font can be amended. Perfect to share business communication as pixels don’t break even when shared on large screen. Presentation graphic can be accessed with different nodes and stages.
-
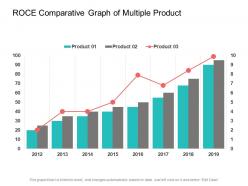 Roce comparative graph of multiple product
Presenting this set of slides with name - Roce Comparative Graph Of Multiple Product. This is a three stages process. The stages in this process are ROCE, Return On Capital Employed, Accounting Ratio.
-
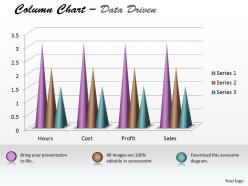 Data driven 3d chart shows data sets in order powerpoint slides
We are proud to present our data driven 3d chart shows data sets in order powerpoint slides. Our Data Driven 3D Chart Shows Data Sets In Order Powerpoint Slides Power Point Templates Are Topically Designed To Provide An Attractive Backdrop To Any Subject. Use Them To Look Like A Presentation Pro. Use Our Data Driven 3D Chart Shows Data Sets In Order Powerpoint Slides Power Point Templates To Effectively Help You Save Your Valuable Time. They Are Readymade To Fit Into Any Presentation Structure.
-
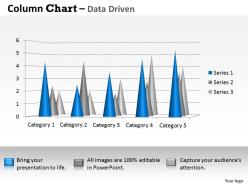 Data driven 3d distribution of data in sets powerpoint slides
We are proud to present our data driven 3d distribution of data in sets powerpoint slides. Let Our Data Driven 3D Data In Segments Pie Chart Powerpoint Slides Power Point Templates Be The Vehicle Of Your Successful Journey. Ride The Bus To Glory With Your Grand Ideas. Our Data Driven 3D Data In Segments Pie Chart Powerpoint Slides Power Point Templates Are Like A Basic Christmas Tree. Decorate It With Your Beautiful Thoughts And Spread Joy And Happiness.
-
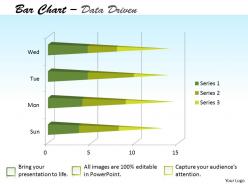 Data driven 3d forex market bar chart powerpoint slides
We are proud to present our data driven 3d forex market bar chart powerpoint slides. Our Data Driven 3D Forex Market Bar Chart Powerpoint slides Power Point Templates Give You The Basic Framework Of Your Talk. Give It The Shape You Desire With Your Wonderful Views. Our Data Driven 3D Forex Market Bar Chart Powerpoint slides Power Point Templates Are The Lungs Of Your Talk. Fill Them With The Oxygen Of Your In-depth Thought Process.
-
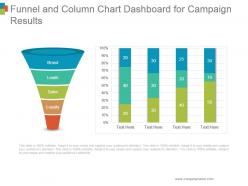 Funnel and column chart dashboard for campaign results ppt background images
Presenting funnel and column chart dashboard for campaign results ppt background images. This is a funnel and column chart dashboard for campaign results ppt background images. This is a two stage process. The stages in this process are brand, leads, sales, loyalty.
-
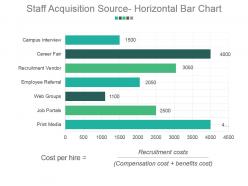 Staff acquisition source horizontal bar chart powerpoint slide backgrounds
Presenting staff acquisition source horizontal bar chart powerpoint slide backgrounds. This is a staff acquisition source horizontal bar chart powerpoint slide backgrounds. This is a seven stage process. The stages in this process are campus interview, career fair, recruitment vendor, employee referral, web groups, job portals, print media.
-
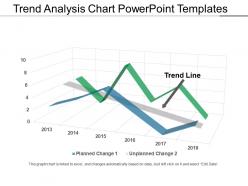 Trend analysis chart powerpoint templates
Presenting a PowerPoint slide named Trend Analysis Chart PowerPoint Templates. Create a compelling presentation with this PPT diagram, which is both professional and editable. Customize colors, choose font styles, and size. You can choose from a wide variety of icons. Resize and scale the images to fit any content. The PPT slide is compatible with Google Slides and can be fetched at once. You can save it as both PDF and JPG formats. This PPT slide is data-driven and can be linked to Excel sheet.
-
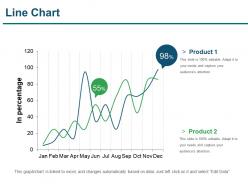 Line chart ppt infographic template
Presenting line chart ppt infographic template. This is a line chart ppt infographic template . This is a two stage process. The stages in this process are line chart, finance, marketing, analysis, business.
-
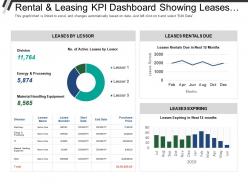 Rental and leasing kpi dashboard showing leases expiring leases by lessor
Presenting this set of slides with name - Rental And Leasing Kpi Dashboard Showing Leases Expiring Leases By Lessor. This is a four stage process. The stages in this process are Rental And Leasing, Dealing And Leasing, Rental And Engage.
-
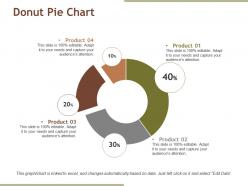 Donut pie chart ppt diagrams
Presenting this set of slides with name - Donut Pie Chart Ppt Diagrams. This is a four stage process. The stages in this process are Donut, Finance, Marketing, Planning, Analysis.
-
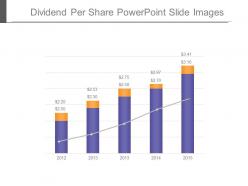 Dividend per share powerpoint slide images
Presenting dividend per share powerpoint slide images. This is a dividend per share powerpoint slide images. This is a five stage process. The stages in this process are business, graph chart, growth, strategy, finance.
-
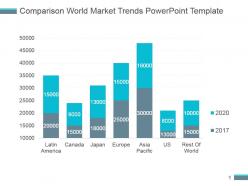 Comparison world market trends powerpoint template
Presenting comparison world market trends powerpoint template. This is a comparison world market trends powerpoint template. This is a seven stage process. The stages in this process are latin america, canada, japan, europe, asia pacific, us, rest of world.
-
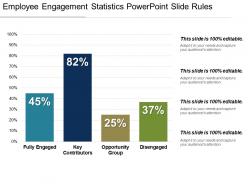 Employee engagement statistics powerpoint slide rules
Presenting our employee engagement statistics PowerPoint slide rules. This PPT slide offers you plenty of space to put in titles and subtitles. High resolution based presentation layout, does not change the image even after resizing. This presentation icon is data driven and template can be downloaded via excel file to incorporate data. Quick downloading speed and simple editing options in color text and fonts.PPT icons can easily be changed into JPEG and PDF applications.
-
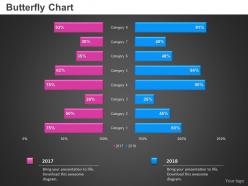 0414 butterfly bar chart for business performance powerpoint graph
Presenting 0414 bar chart for business performance PowerPoint graph PPT slide. PPT has high-resolution visuals. Impressive picture quality which does not deter when projected on a wide screen. There is an impressive use of colors and design. PPT is compatible with a large number of formats. It is compatible with numerous online and offline software options. It is thoroughly editable slide design background. Ease of modification. Personalization of content with company-specific name, logo or trademark is extremely easy. PPT is professionally proficient and aesthetically sound. Used by marketers, brand managers, sales professionals, students, and teachers.
-
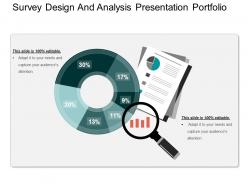 Survey design and analysis presentation portfolio
Presenting survey design and analysis presentation portfolio which is 100% editable. This PPT slide is excel linked chart that is; data driven and easy to customize and enables you to personalize it as per your own criteria. The presentation slide is fully compatible with Google slides, multiple format and software options. In case of any assistance, kindly take instructions from our presentation design services and it is easy to download in a very short span of time. The images, layouts, designs are of high quality and ensures quality in widescreen.
-
 Quarterly performance icons powerpoint ideas
Presenting quarterly performance icons PowerPoint ideas. This PPT template has an ample amount of space to put in titles and subtitles. This slide offers high resolution based presentation which does not change the image even after resizing. This presentation icon is completely compatible with Google Slides. Quick downloading speed and simple editing options in color text and fonts.PPT icons can easily be changed into JPEG and PDF applications. This diagram has been designed for entrepreneurs, corporate and business managers.
-
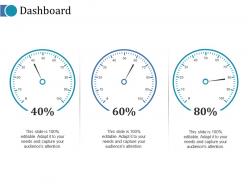 Dashboard Snapshot ppt infographics example
Presenting this set of slides with name - Dashboard Snapshot Ppt Infographics Example. This is a three stage process. The stages in this process are Low, Medium, High, Dashboard, Measurement.
-
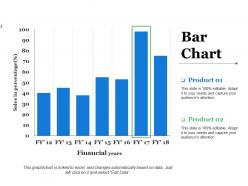 Bar chart ppt slides summary
Presenting this set of slides with name - Bar Chart Ppt Slides Summary. This is a two stage process. The stages in this process are Sales In Percentage, Percentage, Business, Marketing, Financial Years.
-
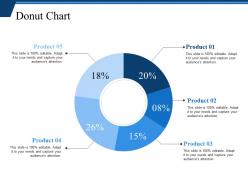 Donut chart ppt sample file
Presenting this set of slides with name - Donut Chart Ppt Sample File. This is a five stage process. The stages in this process are Donut Chart, Finance, Marketing, Strategy, Analysis.
-
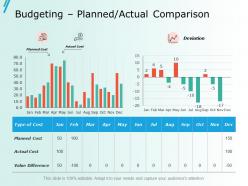 Budgeting planned actual comparison ppt slides inspiration
Presenting this set of slides with name - Budgeting Planned Actual Comparison Ppt Slides Inspiration. This is a two stage process. The stages in this process are Business, Management, Strategy, Analysis, Marketing.
-
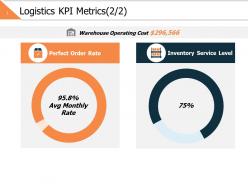 Logistics kpi metrics 2 2 ppt powerpoint presentation file format
Presenting this set of slides with name - Logistics Kpi Metrics 2 2 Ppt Powerpoint Presentation File Format. This is a two stage process. The stages in this process are Business, Management, Strategy, Analysis, Finance.
-
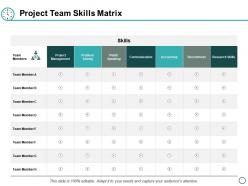 Project team skills matrix ppt powerpoint presentation layouts background designs
Presenting this set of slides with name - Project Team Skills Matrix Ppt Powerpoint Presentation Layouts Background Designs. This is a seven stages process. The stages in this process are Project Management, Communication, Planning, Business, Marketing.
-
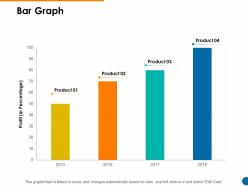 Bar graph ppt powerpoint presentation pictures slides
Presenting this set of slides with name - Bar Graph Ppt Powerpoint Presentation Pictures Slides. This is a four stage process. The stages in this process are Business, Marketing, Strategy, Analysis, Management.
-
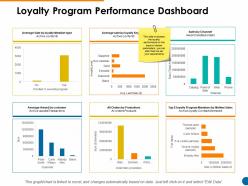 Loyalty program performance dashboard ppt powerpoint presentation pictures graphics
Presenting this set of slides with name - Loyalty Program Performance Dashboard Ppt Powerpoint Presentation Pictures Graphics. This is a six stage process. The stages in this process are Business, Strategy, Marketing, Analysis, Management.
-
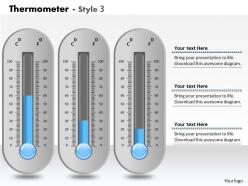 0414 layout of thermometer column chart powerpoint graph
We are proud to present our 0414 layout of thermometer column chart powerpoint graph. Our Layout of Thermometer Column Chart Powerpoint Graph Powerpoint Templates give you that extra zing. Add your views and make your audience sing. Our pretty Layout of Thermometer Column Chart Powerpoint Graph Powerpoint Templates are like snowflakes that fall. Gather them together and have a ball. Put your wondrously glowing ideas into them. Bind them together and create mayhem.
-
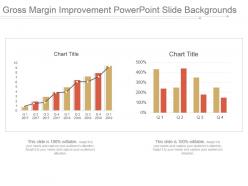 Gross margin improvement powerpoint slide backgrounds
Presenting gross margin improvement powerpoint slide backgrounds. Presenting gross margin improvement powerpoint slide backgrounds. Presenting gross margin improvement powerpoint slide backgrounds. This is a gross margin improvement powerpoint slide backgrounds. This is two stage process. The stages in this process are chart title, gross margin, improvement, business, success.
-
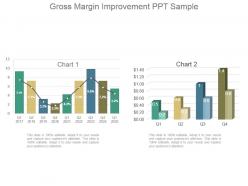 Gross margin improvement ppt sample
Presenting gross margin improvement ppt sample. Presenting gross margin improvement ppt sample. Presenting gross margin improvement ppt sample. This is a gross margin improvement ppt sample. This is two stage process. The stages in this process are gross margin, improvement, strategy, business, success, finance.
-
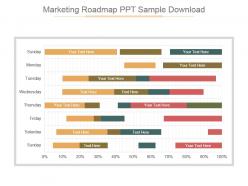 Marketing roadmap ppt sample download
Presenting marketing roadmap ppt sample download. This is a marketing roadmap ppt sample download. This is a eight stage process. The stages in this process are marketing roadmap, strategy, business, marketing, management.
-
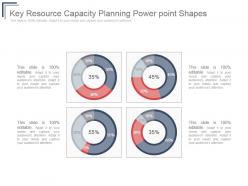 Key resource capacity planning power point shapes
Presenting key resource capacity planning power point shapes. This is a key resource capacity planning power point shapes. This is a four stage process. The stages in this process are success, business, marketing, presentation, management.
-
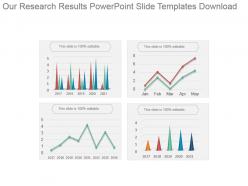 Our research results powerpoint slide templates download
Presenting our research results powerpoint slide templates download. This is a our research results powerpoint slide templates download. This is a four stage process. The stages in this process are business, management, presentation, finance, marketing.
-
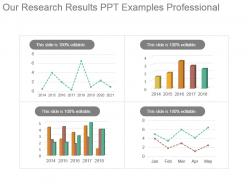 Our research results ppt examples professional
Presenting our research results ppt examples professional. This is a our research results ppt examples professional. This is a four stage process. The stages in this process are business, management, presentation, finance, marketing.
-
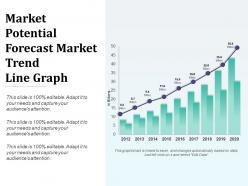 Market potential forecast market trend ppt templates
Presenting market potential forecast market trend ppt templates. This is a market potential forecast market trend ppt templates. This is a nine stage process. The stages in this process are business, bar graph, finance, strategy, marketing, success.
-
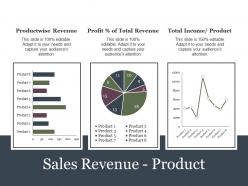 Sales revenue product presentation portfolio
Presenting this set of slides with name - Sales Revenue Product Presentation Portfolio. This is a three stage process. The stages in this process are Bar, Marketing, Finance, Growth, Strategy.


