- Sub Categories
-
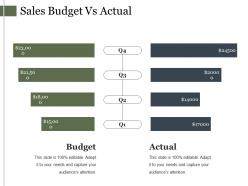 Sales budget vs actual ppt presentation
Presenting this set of slides with name - Sales Budget Vs Actual Ppt Presentation. This is a four stage process. The stages in this process are Slide Bar, Marketing, Finance, Growth, Strategy.
-
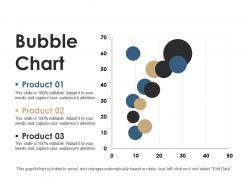 Bubble chart ppt microsoft
Presenting this set of slides with name - Bubble Chart Ppt Microsoft. This is a three stage process. The stages in this process are Bubble Chart, Finance, Analysis, Business, Strategy.
-
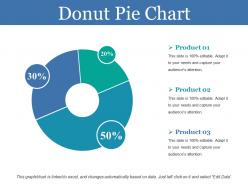 Donut pie chart ppt backgrounds
Presenting this set of slides with name - Donut Pie Chart Ppt Backgrounds. This is a three stage process. The stages in this process are Donut Pie Chart, Finance, Analysis, Management, Planning.
-
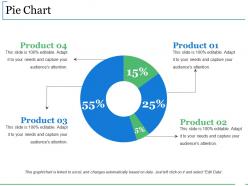 Pie chart powerpoint slide designs
Presenting this set of slides with name - Pie Chart Powerpoint Slide Designs. This is a four stage process. The stages in this process are Business, Marketing, Strategy, Planning, Finance.
-
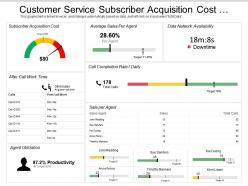 Customer service subscriber acquisition cost dashboard
Presenting this set of slides with name - Customer Service Subscriber Acquisition Cost Dashboard. This is a three stage process. The stages in this process are Customer Base, Recurring Customers, Customer Services.
-
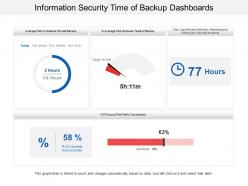 Information security time of backup dashboards
Presenting this set of slides with name - Information Security Time Of Backup Dashboards. This is a three stage process. The stages in this process are Information Security Strategy, Information Security Plan, Information Protection Strategy.
-
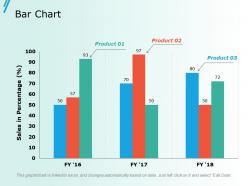 Bar chart ppt slides ideas
Presenting this set of slides with name - Bar Chart Ppt Slides Ideas. This is a three stage process. The stages in this process are Business, Management, Strategy, Analysis, Marketing.
-
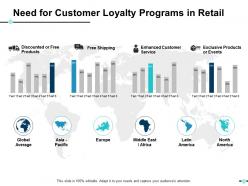 Need for customer loyalty programs in retail ppt show vector
Presenting this set of slides with name - Need For Customer Loyalty Programs In Retail Ppt Show Vector. This is a four stage process. The stages in this process are Business, Management, Strategy, Analysis, Icons.
-
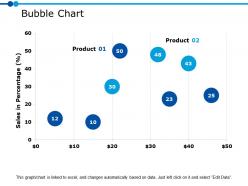 Bubble chart ppt powerpoint presentation file maker
Presenting this set of slides with name - Bubble Chart Ppt Powerpoint Presentation File Maker. This is a two stage process. The stages in this process are Business, Management, Strategy, Analysis, Marketing.
-
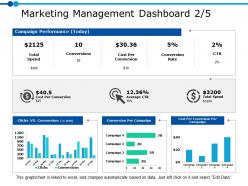 Marketing management dashboard 2 5 ppt powerpoint presentation gallery clipart
Presenting this set of slides with name - Marketing Management Dashboard 2 5 Ppt Powerpoint Presentation Gallery Clipart. This is a three stage process. The stages in this process are Business, Management, Strategy, Analysis, Marketing.
-
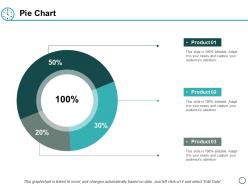 Pie chart finance ppt powerpoint presentation layouts pictures
Presenting this set of slides with name - Pie Chart Finance Ppt Powerpoint Presentation Layouts Pictures. This is a three stages process. The stages in this process are Pie Chart, Finance, Marketing, Business, Analysis.
-
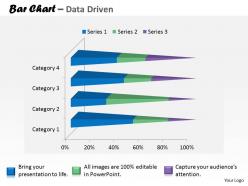 Data driven 3d currency trading bar chart powerpoint slides
We are proud to present our data driven 3d currency trading bar chart powerpoint slides. Our Data Driven 3D Currency Trading Bar Chart Powerpoint slides Power Point Templates Are The Chords Of Your Song. String Them Along And Provide The Lilt To Your Views. Our Data Driven 3D Currency Trading Bar Chart Powerpoint slides Power Point Templates Help You Pinpoint Your Timelines. Highlight The Reasons For Your Deadlines With Their Use.
-
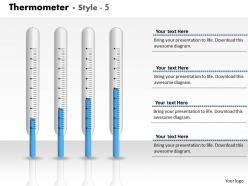 0414 graphics of thermometer column chart powerpoint graph
We are proud to present our 0414 graphics of thermometer column chart powerpoint graph. Stamp the authority of your intellect with our Graphics Of Thermometer Column Chart Powerpoint Graph Powerpoint Templates. Your superior ideas will hit the target always and everytime. Use our Graphics Of Thermometer Column Chart Powerpoint Graph Powerpoint Templates to embellish your thoughts. See them provide the desired motivation to your team.
-
 0414 innovative brain idea bar chart powerpoint graph
We are proud to present our 0414 innovative brain idea bar chart powerpoint graph. Whatever the nuance you want to project. We have a Innovative Brain Idea Bar Chart Powerpoint Graph Powerpoint Templates that will get it across. Create a connection with your audience using our Innovative Brain Idea Bar Chart Powerpoint Graph Powerpoint Templates. Transfer your depth of knowledge clearly across to them.
-
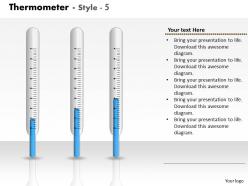 0414 thermometer column chart data illustration powerpoint graph
We are proud to present our 0414 thermometer column chart data illustration powerpoint graph. Our Thermometer Column Chart Data Illustration Powerpoint Graph Powerpoint Templates give you that extra zing. Add your views and make your audience sing. Our pretty Thermometer Column Chart Data Illustration Powerpoint Graph Powerpoint Templates are like snowflakes that fall. Gather them together and have a ball. Put your wondrously glowing ideas into them. Bind them together and create mayhem.
-
 Marketing reach by channels ppt diagrams
Presenting marketing reach by channels ppt diagrams. This is a marketing reach by channels ppt diagrams. This is a seven stage process. The stages in this process are content promotion, product launch, content creation, event management, corporate communications, crisis management, seo.
-
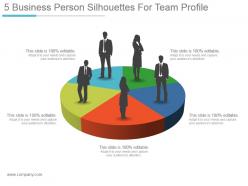 5 business person silhouettes for team profile sample ppt presentation
Presenting 5 business person silhouettes for team profile sample ppt presentation. This is a 5 business person silhouettes for team profile sample ppt presentation. This is a five stage process. The stages in this process are silhouettes, management, communication, business, marketing.
-
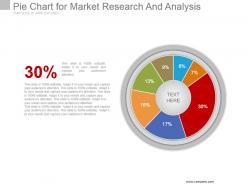 Pie chart for market research and analysis powerpoint ideas
Presenting pie chart for market research and analysis powerpoint ideas. This is a pie chart for market research and analysis powerpoint ideas. This is a seven stage process. The stages in this process are pie chart, percentage, analysis, marketing, strategy, business, success.
-
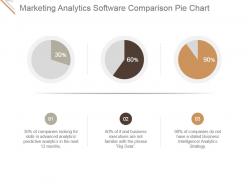 Marketing analytics software comparison pie chart powerpoint images
Presenting marketing analytics software comparison pie chart powerpoint images. This is a marketing analytics software comparison pie chart powerpoint images. This is a three stage process. The stages in this process are marketing, analysis, measure, pie chart, comparison.
-
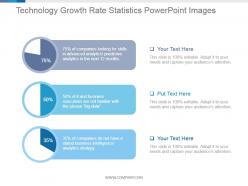 Technology growth rate statistics powerpoint images
Presenting technology growth rate statistics powerpoint images. This is a technology growth rate statistics powerpoint images. This is a three stage process. The stages in this process are business, marketing, percentage, finance, success.
-
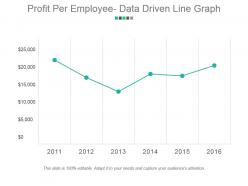 Profit per employee data driven line graph powerpoint slide background image
Presenting profit per employee data driven line graph powerpoint slide background image. This is a profit per employee data driven line graph powerpoint slide background image. This is a six stage process. The stages in this process are profit, employee, graph, line, growth.
-
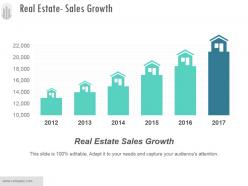 Real estate sales growth ppt templates
Presenting real estate sales growth ppt templates. This is a real estate sales growth ppt templates. This is a six stage process. The stages in this process are business, marketing, growth, management, sales.
-
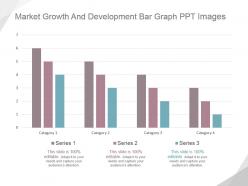 Market growth and development bar graph ppt images
Presenting market growth and development bar graph ppt images. This is a market growth and development bar graph ppt images. This is a four stage process. The stages in this process are category, series.
-
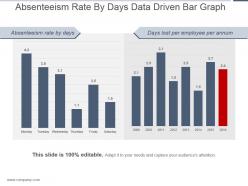 Absenteeism rate by days data driven bar graph powerpoint show
Presenting absenteeism rate by days data driven bar graph powerpoint show. This is a absenteeism rate by days data driven bar graph powerpoint show. This is a two stage process. The stages in this process are absenteeism rate by days, days lost per employee per annum, monday, tuesday, wednesday, thursday, friday, saturday.
-
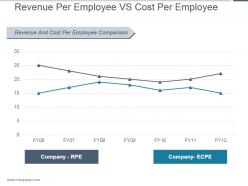 Revenue per employee vs cost per employee ppt templates
Presenting revenue per employee vs cost per employee ppt templates. This is a revenue per employee vs cost per employee ppt templates. This is a seven stage process. The stages in this process are revenue and cost per employee comparison, company rpe, company ecpe, fy.
-
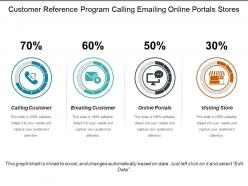 Customer reference program calling emailing online portals stores
Presenting customer reference program calling emailing online portals stores. This is a customer reference program calling emailing online portals stores. This is a four stage process. The stages in this process are customer references, customer experience, client reviews.
-
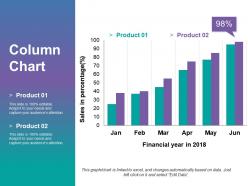 Column chart presentation visuals
Presenting column chart presentation visuals. This is a column chart presentation visuals. This is a six stage process. The stages in this process are sales in percentage, financial year in, graph, business, marketing.
-
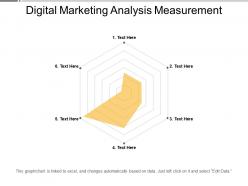 Digital marketing analysis measurement
Presenting Digital Marketing Analysis Measurement. The slide also supports the widescreen(16:9) and the standard screen(4:3) sizes. The PPT can be made inclusive of various components such as charts and graphs. It is also compatible with Google Slides and can be converted into many common image and document formats like JPEG, PNG or PDF. High-quality graphics ensure that quality is not compromised at any cost.
-
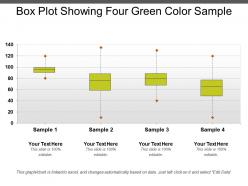 Box plot showing four green color sample
Presenting box plot showing four green color sample. This is a box plot showing four green color sample. This is a four stage process. The stages in this process are box plot, statistical data, whiskers plot, statistical distribution.
-
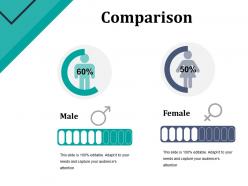 Comparison powerpoint graphics
Presenting comparison powerpoint graphics. This is a comparison powerpoint graphics. This is a two stage process. The stages in this process are male, female, percentage, compare, business.
-
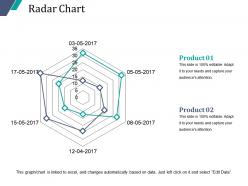 Radar chart powerpoint slide inspiration
Presenting radar chart powerpoint slide inspiration. This is a radar chart powerpoint slide inspiration. This is a two stage process. The stages in this process are product, shapes, business, marketing.
-
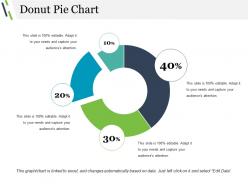 Donut pie chart powerpoint slide presentation sample
Presenting Donut Pie Chart PowerPoint Slide Presentation Sample which is completely editable. Open and save your presentation in various formats like PDF, JPG, and PNG. This template is compatible with Google Slides which makes it easily accessible at once. This slide is available in both 4:3 and 16:9 aspect ratio. Alter the font, color, font size, and font types of the slides as per your needs.
-
 Stacked column presentation pictures
Presenting stacked column presentation pictures. This is a stacked column presentation pictures. This is a nine stage process. The stages in this process are business, marketing, strategy, bar, graph.
-
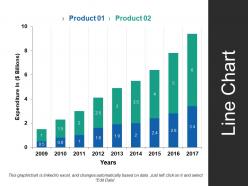 Line chart ppt images gallery template 3
Presenting line chart ppt images gallery template 3. This is a line chart ppt images gallery template 3. This is a two stage process. The stages in this process are product, years, expenditure in, bar chart, growth.
-
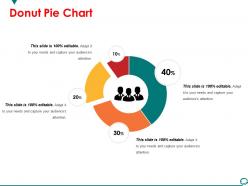 Donut pie chart powerpoint slide background designs
Presenting donut pie chart powerpoint slide background designs. This is a donut pie chart powerpoint slide background designs. This is a four stage process. The stages in this process are chart, percentage, business, marketing, process.
-
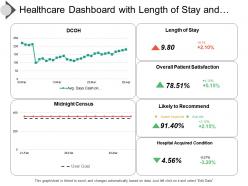 Healthcare dashboard with length of stay and hospital acquired condition
Presenting this set of slides with name - Healthcare Dashboard With Length Of Stay And Hospital Acquired Condition. This is a three stage process. The stages in this process are Healthcare, Health Improvement, Medical Care.
-
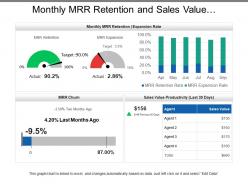 Monthly mrr retention and sales value productivity dashboard
Presenting this set of slides with name - Monthly Mrr Retention And Sales Value Productivity Dashboard. This is a four stage process. The stages in this process are Sales Dashboard, Sales Kpis, Sales Performance.
-
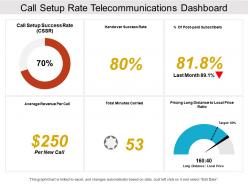 Call setup rate telecommunications dashboard
Presenting this set of slides with name - Call Setup Rate Telecommunications Dashboard. Fully editable Presentation design as text, color, shade, shape and size can be edited. PowerPoint slide can be used individually or in association with other designs. High resolution PPT template ensures better picture display. Presentation diagram is compatible with both standard and wide screen. PPT graphic is adaptable to different software’s such as JPG and PDF and can also be merged with Google slides. Easy to download and save at any location in the system.
-
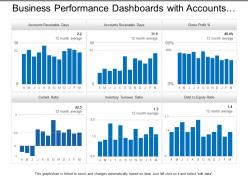 Business performance dashboards with accounts receivable and accounts payable
Presenting business performance dashboards with accounts receivable and accounts payable PPT template. These PPT graphics allow you to resize and recolor the images. Good quality images can be used to complement and reinforce the learning. Works well with all software's and Google Slides. Editing in display slideshow can be done from wherever by compatible devices. Convert PPT to PDF at ease.
-
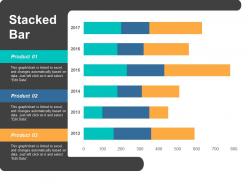 Stacked bar ppt portfolio graphics download
Presenting this set of slides with name - Stacked Bar Ppt Portfolio Graphics Download. This is a three stage process. The stages in this process are Percentage, Product, Business, Management, Marketing.
-
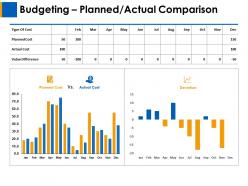 Budgeting planned actual comparison ppt layouts designs download
Presenting this set of slides with name - Budgeting Planned Actual Comparison Ppt Layouts Designs Download. This is a three stage process. The stages in this process are Finance, Analysis, Business, Investment, marketing.
-
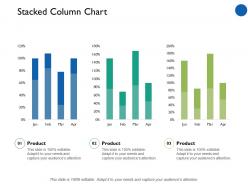 Stacked column chart marketing finance ppt professional example introduction
Presenting this set of slides with name - Stacked Column Chart Marketing Finance Ppt Professional Example Introduction. This is a three stage process. The stages in this process are Finance, Analysis, Business, Investment, Marketing.
-
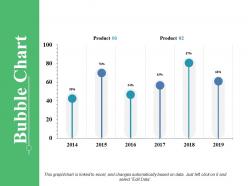 Bubble chart ppt summary graphics download
Presenting this set of slides with name - Bubble Chart Ppt Summary Graphics Download. This is a two stage process. The stages in this process are Percentage, Product, Business, Management, Marketing .
-
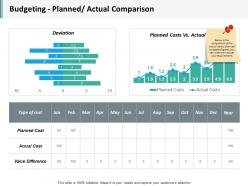 Budgeting planned actual comparison ppt infographics display
Presenting this set of slides with name - Budgeting Planned Actual Comparison Ppt Infographics Display. This is a two stage process. The stages in this process are Business, Management, Strategy, Analysis, Marketing.
-
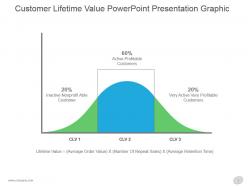 Customer lifetime value powerpoint presentation graphic
Presenting customer lifetime value powerpoint presentation graphic. This is a customer lifetime value powerpoint presentation graphic. This is a three stage process. The stages in this process are clv, lifetime value average order value number of repeat sales average retention time, inactive non profitable customer, active profitable customers, very active very profitable customers.
-
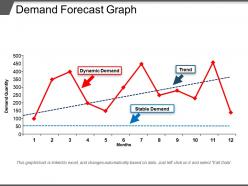 Demand forecast graph ppt image
Presenting Demand Forecast Graph PPT Image Template which is 100% editable. You can modify the colors, fonts, font size, and font types of the slide according to your requirements. It can also be changed into other formats such as PDF, JPG, and PNG. The template is readily available in both 4:3 and 16:9 aspect ratio. It is compatible with Google Slides too, which makes it accessible at once.
-
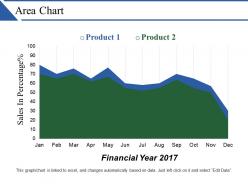 Area chart powerpoint layout
Presenting Area Chart PowerPoint Layout. This slide is completely editable. The slide is readily available in both widescreen and standard screen aspect ratios. It is compatible with Google Slides, which makes it accessible at once. Make as many changes as you want on the slide without any trouble. You can alter the colors, fonts, font size, and font types of the template as per the requirements. open and save your presentation into formats like PDF, JPG, and PNG with ease.
-
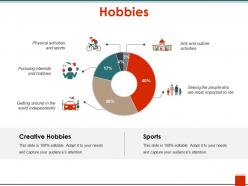 Hobbies ppt images gallery
Presenting Hobbies PPT Images Gallery PowerPoint slide. Compatible with Google Slides, it is easily accessible at one click. This PPT template is available in both 4:3 and 16:9 aspect ratios. As per your requirements, you can modify font size, font type, font color and shapes as our PowerPoint layout is completely editable. You can download this PPT in various formats like PDF, JPG and PNG.
-
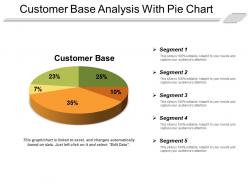 Customer base analysis with pie chart
Presenting customer base analysis with pie chart. This is a customer base analysis with pie chart. This is a five stage process. The stages in this process are customer base, recurring customers, customer services.
-
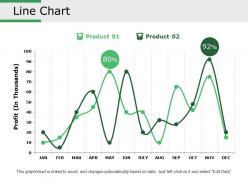 Line chart presentation visuals
Presenting this set of slides with name - Line Chart Presentation Visuals. This is a two stage process. The stages in this process are Line Chart, Finance, Marketing, Strategy, Growth, Business.
-
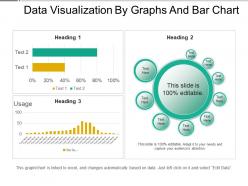 Data visualization by graphs and bar chart
Presenting Data Visualization By Graphs And Bar Chart PowerPoint slide. This PPT theme is available in both 4:3 and 16:9 aspect ratios. As this PowerPoint template is 100% editable, you can modify the color, font size, font type, and shapes as per your requirements. This PPT presentation is Google Slides compatible hence it is easily accessible. You can download and save this PowerPoint layout in different formats like PDF, PNG and JPG.
-
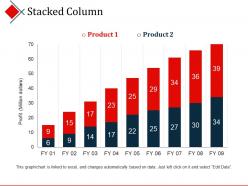 Stacked column presentation layouts
Presenting the Stacked Column Presentation Layouts presentation template which is fully customizable. You can freely access your presentation in both 4:3 and 16:9 aspect ratio. Edit the font, color, font size, and font types of the slides as per your needs. This template is compatible with Google Slides which makes it easily accessible at once. Open and save your presentation in various formats like PDF, JPG, and PNG.
-
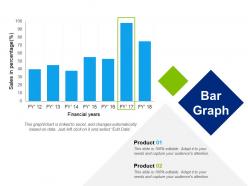 Bar graph powerpoint templates
Presenting this set of slides with name - Bar Graph Powerpoint Templates. This is a two stage process. The stages in this process are Business, Marketing, Finance, Financial Years, Sales In Percentage.
-
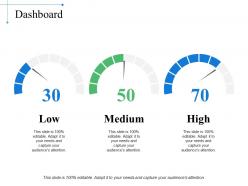 Dashboard snapshot ppt sample file
Presenting this set of slides with name - Dashboard Snapshot Ppt Sample File. This is a three stage process. The stages in this process are Low, Medium, High.
-
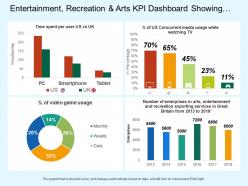 Entertainment recreation and arts kpi dashboard showing of media usage and time spent per user
Presenting this set of slides with name - Entertainment Recreation And Arts Kpi Dashboard Showing Of Media Usage And Time Spent Per User. This is a four stage process. The stages in this process are Entertainment, Recreation And Arts, Attractions, Culture, Entertainment.
-
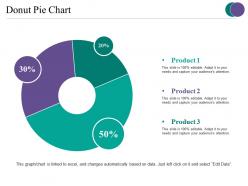 Donut pie chart ppt slides
Presenting this set of slides with name - Donut Pie Chart Ppt Slides. This is a three stage process. The stages in this process are Donut Pie Chart, Finance, Analysis, Business, Marketing.
-
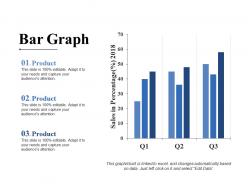 Bar graph sample ppt files
Presenting bar graph sample PPT files PPT slide. The bar graph components presentation slide designed professionally by the designing team of SlideTeam to compare the project progress and data. The bubble chart and text placeholder in the bar graph example presentation template is customizable in PowerPoint. A user can do changes in numerical values as the bubble chart excel PowerPoint template get linked with Excel sheet. The bar graph maker presentation template is also compatible with Google Slide. A user can edit the font size, font type, color and dimensions of the bar graph challenge art PPT template.
-
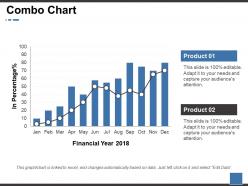 Combo chart ppt show template
Get a chance to go through the combo chart PowerPoint presentation slide. This presentation has been designed by professionals and is fully editable. You can remodel the font size, font type, colors, and even the background. This Template is practicable with Google Slide and can be saved in JPG or PDF format without any obstacle created during the process. Fast download at the click of the button provided below.
-
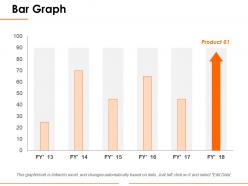 Bar graph ppt slides
Presenting this set of slides with name - Bar Graph Ppt Slides. This is a one stage process. The stages in this process are Business, Marketing, Finance, Bar Graph, Strategy.
-
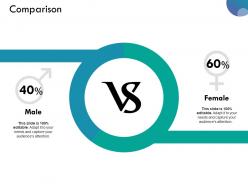 Comparison presentation images ppt examples professional
Sharing comparison presentation design. Entirely adjustable as color, text and font can be replaced at any point. PowerPoint slide can be customized with business details such as name and logo. Abrupt download and can be vary into JPG and PDF format. Ready to share PPT template is accommodating with Google slides. PowerPoint layout can be seen in both standard and widescreen. Similar designs are available with different nodes and stages.


