- Sub Categories
-
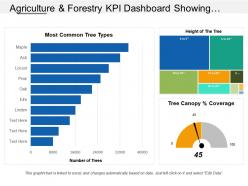 Agriculture and forestry kpi dashboard showing most common tree types height of the tree
Highlighting agriculture and forestry KPI dashboard showing most common tree types height of the tree PPT template. An easy access to make the desired changes or edit it anyways. Wide screen view of the slides. Easy conversion into Jpeg or Pdf format. The PPT images offer compatibility with Google slides. Valuable for business professionals, sales representatives, marketing professionals, students and selling investigators. High quality charts and visuals used in the designing process. They enhance the performance of the presentation.
-
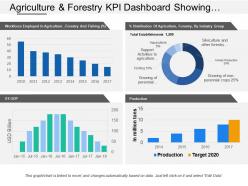 Agriculture and forestry kpi dashboard showing us gdp production target
Highlighting agricultural and forestry KPI dashboard showing us gdp production target PowerPoint slide. Useful tool for students, business analysts, sales people, sales managers and professionals of any industry. Precise and easy to comprehend information on PPT sample. Useful for marketing and business-related presentations. Wide screen projection does not affect the output adversely. Access to save in the JPG or PDF format. Increase the level of personalization with your company logo and name. Compatible with all software and can be saved in any format.
-
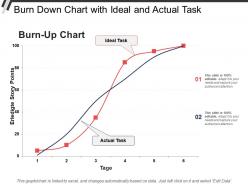 Burn down chart with ideal and actual task
Presenting this set of slides with name - Burn Down Chart With Ideal And Actual Task. This is a two stage process. The stages in this process are Burn Down Chart, Agile Software Development Chart, Run Chart.
-
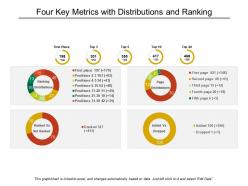 Four key metrics with distributions and ranking
This highly versatile, business oriented PPT diagram is completely editable; you can customize and personalize the PPT design by including business logo and trademarks on it. Design template can instantly be downloaded as JPEG or PDF formats. No specific requirements are needed to edit the slide. Design is compatible with Google Slide and Microsoft PowerPoint software.
-
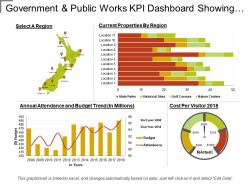 Government and public works kpi dashboard showing annual attendance and budget
Presenting this set of slides with name - Government And Public Works Kpi Dashboard Showing Annual Attendance And Budget. This is a four stage process. The stages in this process are Government And Public Works, Government And Public Tasks.
-
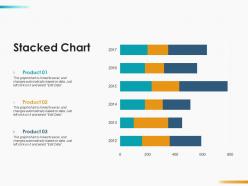 Stacked chart analysis ppt infographics design inspiration
Presenting this set of slides with name - Stacked Chart Analysis Ppt Infographics Design Inspiration. This is a three stage process. The stages in this process are Stacked Chart, Finance, Marketing, Analysis, Business.
-
 Data driven 3d process variation column chart powerpoint slides
We are proud to present our data driven 3d process variation column chart powerpoint slides. Bubbling And Bursting With Ideas Are You. Let Our Data Driven 3D Process Variation Column Chart Powerpoint Slides Power Point Templates Give Them The Shape For You. You Have Gained Great Respect For Your Brilliant Ideas. Use Our Data Driven 3D Process Variation Column Chart Powerpoint Slides Power Point Templates To Strengthen And Enhance Your Reputation.
-
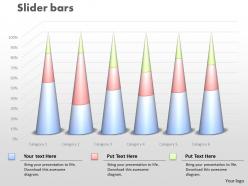 0414 slider column chart for comparing data powerpoint graph
We are proud to present our 0414 slider column chart for comparing data powerpoint graph. Clear and concise is the credo of our Slider Column Chart For Comparing Data Powerpoint Graph Powerpoint Templates. Use them and dispel any doubts your team may have. Effective communication is what our Slider Column Chart For Comparing Data Powerpoint Graph Powerpoint Templates ensure. They help you put across your views with precision and clarity.
-
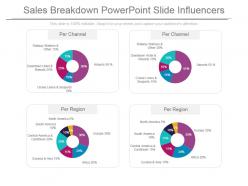 Sales breakdown powerpoint slide influencers
Presenting sales breakdown powerpoint slide influencers. This is a sales breakdown powerpoint slide influencers. This is a four stage process. The stages in this process are railway stations and other, downtown hotel and resorts, cruise liners and, seaports, north america, south america, central america and caribbean, eurasia and asia, europe, africa.
-
 Key evaluation metrics powerpoint slide background
Presenting key evaluation metrics powerpoint slide background. This is a key evaluation metrics powerpoint slide background. This is a five stage process. The stages in this process are business, process, marketing, strategy, success, analysis.
-
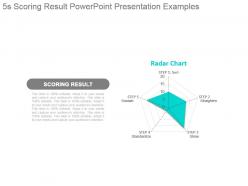 5s scoring result powerpoint presentation examples
Presenting 5s scoring result powerpoint presentation examples. This is a 5s scoring result powerpoint presentation examples. This is a five stage process. The stages in this process are scoring result, radar chart, step, sort, straighten, shine, standardize, sustain.
-
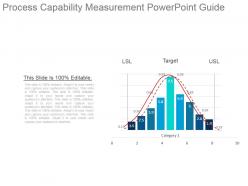 Process capability measurement powerpoint guide
Presenting process capability measurement powerpoint guide. This is a process capability measurement powerpoint guide. This is a nine stage process. The stages in this process are lsl, usl, category, target.
-
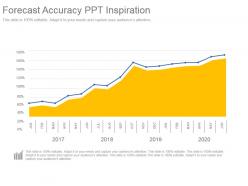 Forecast accuracy ppt inspiration
Presenting forecast accuracy ppt inspiration. This is a forecast accuracy ppt inspiration. This is a one stage process. The stages in this process are jan, feb, mar, apr, may, jun, jul, aug, sep, oct, nov, dec.
-
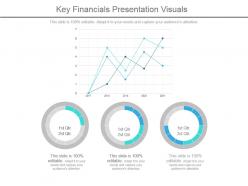 Key financials presentation visuals
Presenting key financials presentation visuals. This is a key financials presentation visuals. This is a three stage process. The stages in this process are business, marketing, measure, success, graph.
-
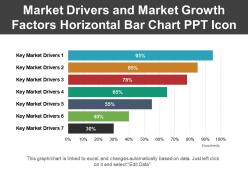 Market drivers and market growth factors horizontal bar chart ppt icon
Presenting market drivers and market growth factors PPT slide. This is professionally organized PPT template quite constructive for management professionals. Amendable shapes, patterns and subject matters. Authentic and relevant PPT Images with pliable options to insert caption or sub caption. Smooth Downloads. Runs smoothly with all available software’s. High quality Picture Presentation graphics which remain unaffected when projected on wide screen or google Slides.
-
 Positive and negative attitudes at workplace ppt inspiration
Presenting positive and negative attitudes at workplace PPT inspiration slideshow which is 100% editable. This PPT slide is excel linked chart i.e. data driven easy to customize and enables you to personalize it as per your own criteria. The presentation slide is fully compatible with Google slides, multiple format and software options. In case of any assistance, kindly take instructions from our presentation design services and it is easy to download in a very short span of time. The images, layouts, designs are of high quality and ensures quality in widescreen.
-
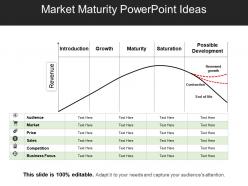 Market maturity powerpoint ideas
Presenting Market Maturity PowerPoint Ideas. It is a professionally designed PowerPoint template with relevant visuals and content. You can change the color, text and font size as per your need. You can add or delete the content wherever required. This slide is available in both standard and widescreen size. Its compatibility with Google Slides makes it easily available. Convert and save this PPT slide in both PDF and JPG format.
-
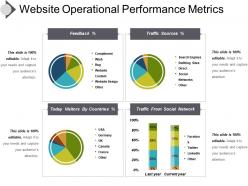 Website operational performance metrics presentation powerpoint
Presenting, website operational performance metrics presentation PowerPoint. This PowerPoint presentation is fully customizable; allowing you to edit the color patterns, text, and icons shown here. This PPT slide is free of space constraints to mention titles and subtitles. Include your company logo here in the PPT to personalize further. The colors of the elements shown in the diagram can be changed according to your liking. This PPT layout is available in both standard 4:3 and widescreen format 16:9 after downloading. This PPT slide is compatible with Google slides and can be edited in any PowerPoint software. Download this PowerPoint deck in a snap and explore full features.
-
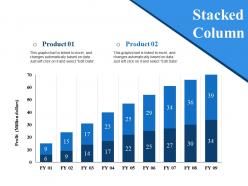 Stacked column ppt styles
Presenting this set of slides with name - Stacked Column Ppt Styles. This is a nine stage process. The stages in this process are Stacked Column, Business, Marketing, Strategy, Management.
-
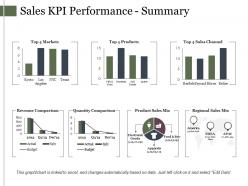 Sales kpi performance summary ppt sample presentations
Presenting this set of slides with name - Sales Kpi Performance Summary Ppt Sample Presentations. This is a seven stage process. The stages in this process are Bar, Marketing, Finance, Growth, Strategy.
-
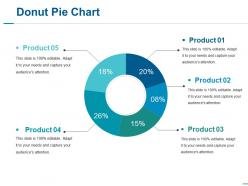 Donut pie chart ppt slides designs
The Donut Pie Chart PPT Slide Design paints a comprehensive picture for an all-round presentation. This Fully customizable PPT slide is compatible with Google Slides as well as other software. This PowerPoint template is available in standard and widescreen aspect ratio. Multiple file extensions including .JPEG, .PPT, etc., for this slide, can be downloaded from our website.
-
 Pie chart ppt file designs
Presenting this set of slides with name - Pie Chart Ppt File Designs. This is a four stage process. The stages in this process are Pie, Process, Percentage, Finance, Business.
-
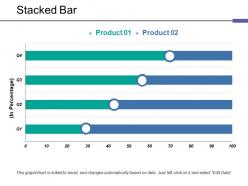 Stacked bar ppt show
Presenting Stacked Ppt Show Presentation Slides. This slide is fully editable. This slide is also compatible with Google Slides and PowerPoint software. It is made up of high-resolution graphics that do not deteriorate the quality when projected on a full screen. Customize the slide as per your needs and wants. It can be viewed on a standard screen and widescreen without any fear of pixelation. It can be easily saved into formats like PDF, JPG, and PNG.
-
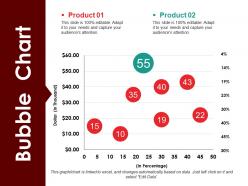 Bubble chart powerpoint ideas
Presenting this set of slides with name - Bubble Chart Powerpoint Ideas. This is a eight stage process. The stages in this process are Business, Marketing, Strategy, Finance, Success.
-
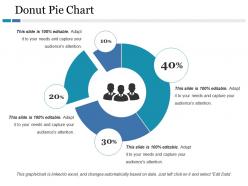 Donut pie chart ppt file display
Presenting this set of slides with name - Donut Pie Chart Ppt File Display. This is a four stage process. The stages in this process are Percentage, Donut, Finance, Business, Marketing.
-
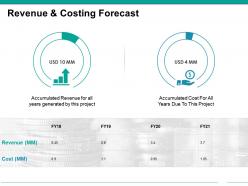 Revenue and costing forecast powerpoint slide images
Presenting this set of slides with name - Revenue And Costing Forecast Powerpoint Slide Images. This is a two stage process. The stages in this process are Business, Marketing, Planning, Finance, Donut.
-
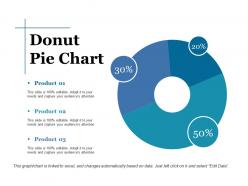 Donut pie chart ppt styles graphics template
Presenting this set of slides with name - Donut Pie Chart Ppt Styles Graphics Template. This is a three stage process. The stages in this process are Business, Marketing, Donut Chart, Percentage, Strategy.
-
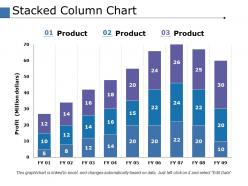 Stacked column chart finance ppt powerpoint presentation file design ideas
This is a three stages process. The stages in this process are Finance, Marketing, Management, Investment, Analysis.
-
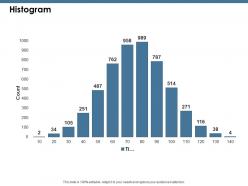 Histogram ppt show example introduction
This is a two stage process. The stages in this process are Marketing, Business, Management.
-
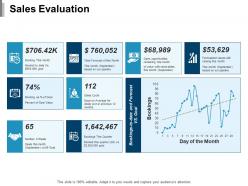 Sales evaluation ppt model infographic template
This is a eight stage process. The stages in this process are Product, Percentage, Marketing, Business.
-
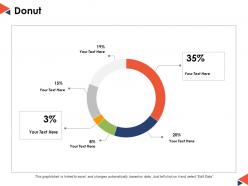 Donut business management ppt powerpoint presentation diagram lists
This is a six stages process. The stages in this process are Finance, Marketing, Management, Strategy, Planning.
-
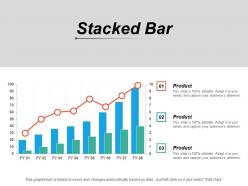 Stacked bar finance marketing management investment analysis
Presenting this set of slides with name - Stacked Bar Finance Marketing Management Investment Analysis. This is a three stage process. The stages in this process are Finance, Marketing, Management, Investment, Analysis.
-
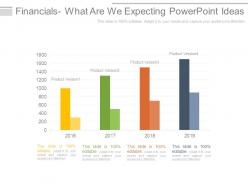 Financials what are we expecting powerpoint ideas
Presenting financials what are we expecting powerpoint ideas. This is a financials what are we expecting powerpoint ideas. This is a four stage process. The stages in this process are business, years, process, analysis, strategy, management.
-
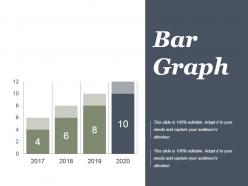 Project performance bar graph powerpoint slide designs download
Presenting project performance bar graph powerpoint slide designs download. This is a project performance bar graph powerpoint slide designs download. This is a four stage process. The stages in this process are bar graph, business, growth, years, success.
-
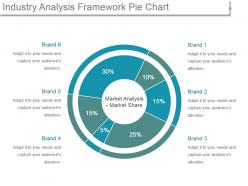 Industry analysis framework pie chart powerpoint slide show
Presenting industry analysis framework pie chart powerpoint slide show. This is a industry analysis framework pie chart powerpoint slide show. This is a six stage process. The stages in this process are industry analysis framework pie chart,market analysis market share brand.
-
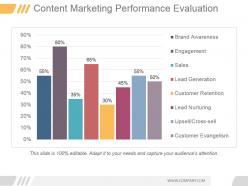 Content marketing performance evaluation ppt sample
Presenting content marketing performance evaluation ppt sample. This is a content marketing performance evaluation ppt sample. This is a eight stage process. The stages in this process are brand awareness, engagement, sales, lead generation, customer retention, lead nurturing, upsell cross sell, customer evangelism.
-
 Status symbol three set loading
Presenting status symbol three set loading. This is a status symbol three set loading. This is a three stage process. The stages in this process are status symbol, status icon.
-
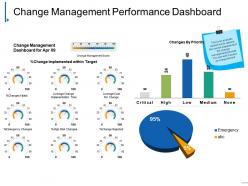 Change management performance dashboard powerpoint slide images
Presenting change management performance dashboard powerpoint slide images. This is a change management performance dashboard powerpoint slide images. This is a two stage process. The stages in this process are critical, high, low, medium, none.
-
 Pie of pie powerpoint slide design templates 1
Presenting this set of slides with name - Pie Of Pie Powerpoint Slide Design Templates 1. This is a two stage process. The stages in this process are Pie, Business, Management, Strategy, Analysis.
-
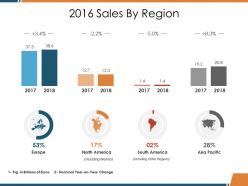 Sales by region ppt design ideas
Presenting this set of slides with name - Sales By Region Ppt Design Ideas. This is a eight stage process. The stages in this process are Europe, North America, South America, Asia Pacific, Business.
-
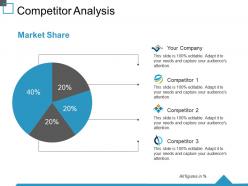 Competitor analysis ppt summary skills
Presenting this set of slides with name - Competitor Analysis Ppt Summary Skills. This is a four stage process. The stages in this process are Market Share, Your Company, Analysis, Business, Marketing.
-
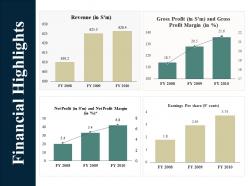 Financial highlights ppt summary outfit
Presenting this set of slides with name - Financial Highlights Ppt Summary Outfit. This is a four stage process. The stages in this process are Earnings Per Share, Revenue, Gross Profit, Business, Marketing, Finance.
-
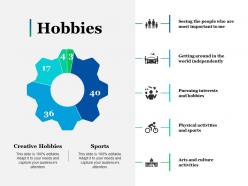 Hobbies ppt pictures slide download
Presenting this set of slides with name - Hobbies Ppt Pictures Slide Download. This is a five stage process. The stages in this process are Business, Management, Strategy, Analysis, Icons.
-
 Inventory and logistics dashboard ppt powerpoint presentation example 2015
Presenting this set of slides with name - Inventory And Logistics Dashboard Ppt Powerpoint Presentation Example 2015. This is a eight stage process. The stages in this process are Finance, Analysis, Business, Investment, Marketing.
-
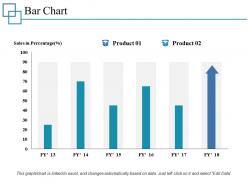 Bar chart ppt professional guidelines
Presenting this set of slides with name - Bar Chart Ppt Professional Guidelines. This is a three stage process. The stages in this process are Business, Management, Strategy, Analysis, Marketing.
-
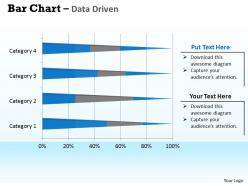 Data driven 3d bar chart for data interpretation powerpoint slides
We are proud to present our data driven 3d bar chart for data interpretation powerpoint slides. This PowerPoint diagram condense large amounts of information into easy-to-understand formats that clearly and effectively communicate important points. It should be used to make facts clearer and more understandable.
-
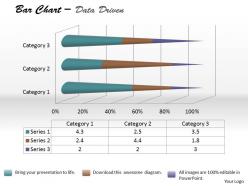 Data driven 3d bar chart for foreign trade powerpoint slides
We are proud to present our data driven 3d bar chart for foreign trade powerpoint slides. Deadlines Are An Element Of Todays Workplace. Our Data Driven 3D Bar Chart For Foreign Trade Powerpoint slides Power Point Templates Help You Meet The Demand. Just Browse And Pick The Slides That Appeal To Your Intuitive Senses. Our Data Driven 3D Bar Chart For Foreign Trade Powerpoint slides Power Point Templates Will Help You Be Quick Off The Draw. Just Enter Your Specific Text And See Your Points Hit Home.
-
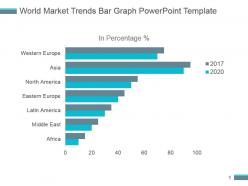 World market trends bar graph powerpoint template
Presenting world market trends bar graph powerpoint template. This is a world market trends bar graph powerpoint template. This is a seven stage process. The stages in this process are in percentage, western europe, asia, north america, eastern europe, latin america, middle east, africa.
-
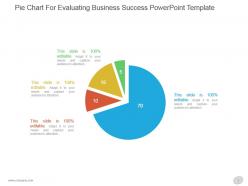 Pie chart for evaluating business success powerpoint template
Presenting pie chart for evaluating business success powerpoint template. This is a pie chart for evaluating business success powerpoint template. This is a four stage process. The stages in this process are marketing, pie, circle, success, business.
-
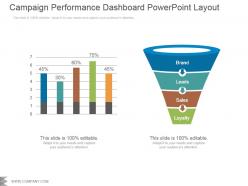 Campaign performance dashboard snapshot powerpoint layout
Presenting campaign performance dashboard snapshot powerpoint layout. This is a campaign performance dashboard powerpoint layout. This is a two stage process. The stages in this process are brand, leads, sales, loyalty.
-
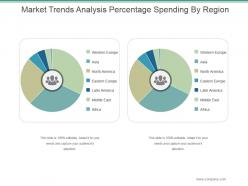 Market trends analysis percentage spending by region powerpoint slide introduction
Presenting market trends analysis percentage spending by region powerpoint slide introduction. This is a market trends analysis percentage spending by region powerpoint slide introduction. This is a two stage process. The stages in this process are western europe, asia, north america, eastern europe, latin america, middle east, africa.
-
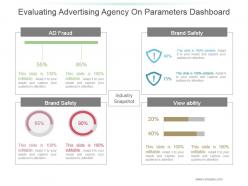 Evaluating advertising agency on parameters dashboard ppt templates
Presenting evaluating advertising agency on parameters dashboard ppt templates. This is a evaluating advertising agency on parameters dashboard ppt templates. This is a four stage process. The stages in this process are ad fraud, industry snapshot, view ability, brand safety.
-
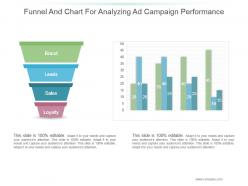 Funnel and chart for analyzing ad campaign performance
Presenting funnel and chart for analyzing ad campaign performance. This is a funnel and chart for analyzing ad campaign performance. This is a four stage process. The stages in this process are brand, leads, sales, loyalty.
-
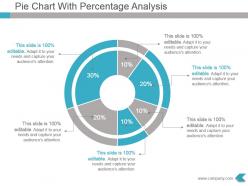 Pie chart with percentage analysis ppt template slide
Presenting pie chart with percentage analysis ppt template slide. This is a pie chart with percentage analysis ppt template slide. This is a six stage process. The stages in this process are pie chart, analysis, process, management, business.
-
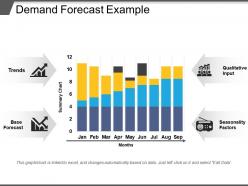 Demand forecast example ppt slides
Presenting Demand Forecast Example PPT Slides which is completely editable. Customize the color, fonts, font size, and font types of the template as per the requirement. Can be converted into formats like PDF, PNG, and JPG. The slide is available in both 4:3 and 16:9 aspect ratio. It is adaptable with Google Slides, which makes it easily accessible.
-
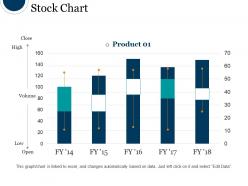 Stock chart ppt diagrams
Presenting stock chart ppt diagrams. This is a stock chart ppt diagrams. This is a five stage process. The stages in this process are stock chart, product, high, close, volume, low.
-
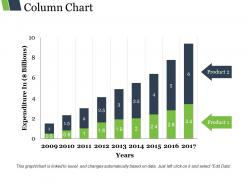 Column chart ppt images gallery
Presenting column chart ppt images gallery. This is a column chart ppt images gallery. This is a nine stage process. The stages in this process are product, expenditure, years, bar graph, growth.
-
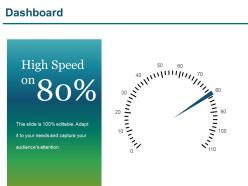 Dashboard snapshot presentation outline
Presenting dashboard presentation outline. This is a dashboard snapshot presentation outline . This is a one stage process. The stages in this process are high speed, low, medium, dashboard, strategy.
-
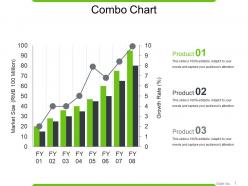 Combo chart powerpoint presentation
Presenting a Combo Chart PowerPoint Layout. This slide can be downloaded into formats like PDF, JPG, and PNG without any problem. It is adaptable with Google Slides which makes it accessible at once. You can modify the color, font, font size, and font types of the slides as per your requirement. This slide is available in both standard and widescreen aspect ratios. High-quality graphics ensure that there is no room for deterioration.
-
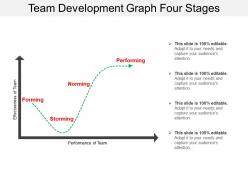 Team development graph four stages
Presenting Team Development Graph Four Stages PPT slideshow which is designed professionally for your convenience. This template is compatible with Google Slides which makes it easily accessible at once. Open your presentation and save it in various formats like PDF, JPG, and PNG. Customize the colors, fonts, font size, and font types of the slide as per your requirements. You can freely access the slide in both 4:3 and 16:9 aspect ratio.


