- Sub Categories
-
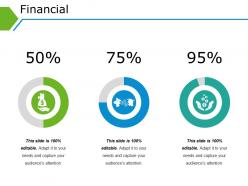 Financial ppt background designs template 1
Presenting financial ppt background designs template 1. This is a financial ppt background designs template 1. This is a three stage process. The stages in this process are icons, strategy, finance, percentage, business.
-
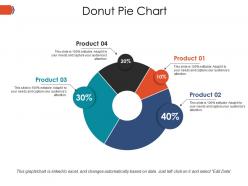 Donut pie chart ppt example file
Presenting donut pie chart ppt example file. This is a donut pie chart ppt example file. This is a four stage process. The stages in this process are product, donut, business, marketing, process.
-
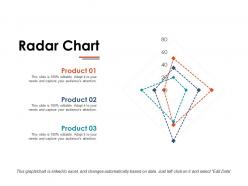 Radar chart ppt example
Presenting radar chart ppt example. This is a radar chart ppt example. This is a three stage process. The stages in this process are radar chart, product, business, process, management.
-
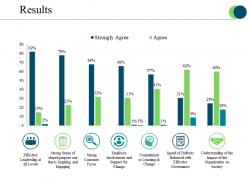 Results presentation images
Presenting results presentation images. This is a results presentation images. This is a seven stage process. The stages in this process are effective leadership at all levels, strong customer focus, commitment to learning and change.
-
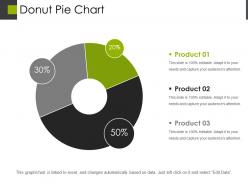 Donut pie chart powerpoint slide designs
Presenting Donut Pie Chart Powerpoint Slide Designs. Easy to download PPT layout and can be saved in different formats like JPG, PDF, and PNG. This PowerPoint slide is completely editable so you can modify, font type, font color, shape, and image according to your requirements. This Google Slides compatible PPT is available in 4:3 and 16:9 aspect ratios.
-
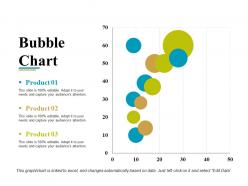 Bubble chart powerpoint slide background designs template 1
Presenting this set of slides with name - Bubble Chart Powerpoint Slide Background Designs Template 1. This is a three stage process. The stages in this process are Business, Marketing, Finance, Chart, Strategy.
-
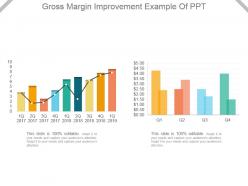 Gross margin improvement example of ppt
Presenting gross margin improvement example of ppt. Presenting gross margin improvement example of ppt. Presenting gross margin improvement example of ppt. This is a gross margin improvement example of ppt. This is two stage process. The stages in this process are business, growth, marketing, strategy, success.
-
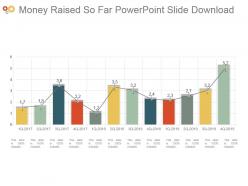 Money raised so far powerpoint slide download
Presenting money raised so far powerpoint slide download. This is a money raised so far powerpoint slide download. This is a twelve stage process. The stages in this process are business, marketing, growth, rising, management.
-
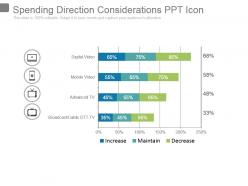 Spending direction considerations ppt icon
Presenting spending direction considerations ppt icon. This is a spending direction considerations ppt icon. This is a three stage process. The stages in this process are digital video, mobile video, advanced tv, broadcast cable ott tv.
-
 Selection of the optimal portfolio powerpoint slide backgrounds
Presenting selection of the optimal portfolio powerpoint slide backgrounds. This is a selection of the optimal portfolio powerpoint slide backgrounds. This is a three stage process. The stages in this process are success, business, marketing, presentation, management.
-
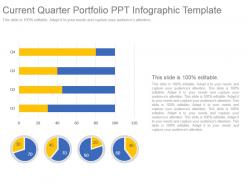 Current quarter portfolio ppt infographic template
Presenting current quarter portfolio ppt infographic template. This is a current quarter portfolio ppt infographic template. This is a four stage process. The stages in this process are pie, finance, business, management, marketing.
-
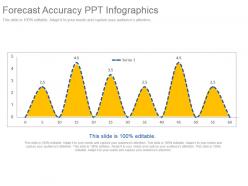 Forecast accuracy ppt infographics
Presenting forecast accuracy ppt infographics. This is a forecast accuracy ppt infographics. This is a six stage process. The stages in this process are series.
-
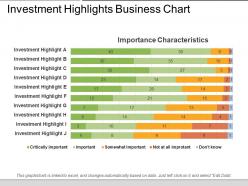 Investment highlights business chart
Presenting investment highlights business chart PPT slide. A unique presentation of the business concept. Adjustable with multiple topics related to finance and marketing. Compatible with numerous format options. Harmonious with a big set of software. High resolution. No issue of pixelation when projected on a wide screen. 100 percent editable. Modify the slide content as per individual preference. Personalize the presentation with company name and logo.
-
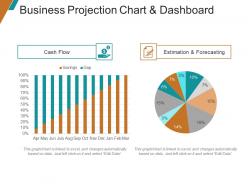 Business projection chart and dashboard ppt samples download
Presenting financial projection graph PPT samples Download which is 100% editable. The inserted features in this PPT are easy with modifications and all the features used in this PowerPoint presentation are compatible with Google Slides, multiple format and software options. This PPT is easy to download in a very short span of time. In case of any assistance, the presenter may refer to presentation designs services being provided along with this PowerPoint presentation. This PPT slide can be saved as JPG or in pdf format.
-
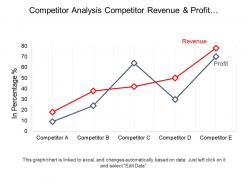 Competitor analysis competitor revenue and profit growth line graph ppt diagrams
Presenting competitor analysis PPT diagram. This PPT template is quite comfortable for business analysis, management students, business managers, and other professionals etc. The various features of this Presentation graphic are revamp able such as the fonts, font sizes, colors, designs, words etc. This PPT graphic can be easily structured into PDF or JPG formats. This is also well versant with Google Slides.
-
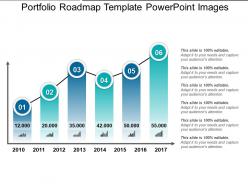 Portfolio roadmap template powerpoint images
Presenting portfolio roadmap template PowerPoint images. This template can be simply used by changing the colors and style of the presentation. This presentation layout offers an easy conversion to other software applications such as JPG and PDF formats. This template is perfectly suitable for entrepreneurs, corporate and business managers. This PowerPoint is a highly innovative and versatile template that can ensure you create a successful communication. This slide has an ample amount of space to capture details of titles and subtitles.
-
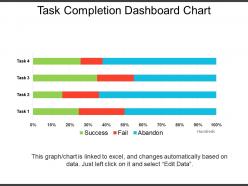 Task completion dashboard chart presentation backgrounds
Presenting Task Completion Dashboard Chart Presentation Backgrounds. Customize the template as per your needs. This means the users can edit all the elements of this presentation, such as a change of color, movement of an object, or add any other item in a few simple steps. The slide is made up of high-resolution graphics that don’t infer in quality when projected on a widescreen. The slide is compatible with multiple numbers of software. Avail it in standard screen and widescreen size.
-
 Profit and loss presentation background images
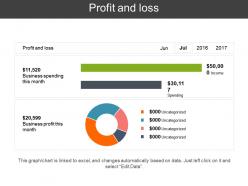
Presenting this PowerPoint slide named Profit and Loss Presentation Background Image. A readymade, completely editable slide is readily available. Add the desired content anywhere in the PPT slide. Customize the font style, font color, and font size according to the requirement. Enhance the appearance of the slide with an array of editable icons available. The template is compatible with Google Slides. Avail this PPT slide in both standard as well as widescreen size. You can convert and save the slide to PDF and JPG formats.
-
 Trend analysis business sample of ppt
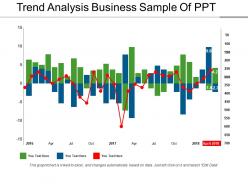
Presenting a PowerPoint slide named Trend Analysis Business Sample of PPT. Create a compelling presentation with this PPT diagram, which is both professional and editable. The PPT slide is compatible with Google Slides and can be fetched at once. You can save it as both PDF and JPG formats. This PPT slide is data-driven can be linked to Excel sheet.
-
 Quarterly performance summary ppt slide
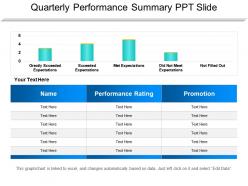
Presenting a PPT template named Quarterly Performance Summary PPT Slide. It is a professionally designed template with relevant visuals and subject driven content. Get easy access to the customizable slide. The PowerPoint slide is completely editable for your convenience. You can edit the color, text and font size as per your need. You can add or delete the content if required. The slide is compatible with Google Slides and can be exported in both PDF as well as JPG formats. You can avail this PPT slide both in standard as well as widescreen size.
-
 Sales performance summary outline ppt slides download
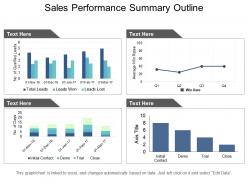
Introducing Sales Performance Summary Outline Ppt Slides Download. You can easily download this template to access its full version. This template allows you to resize it and make changes in the fonts, colors, images, icons as per your needs. The slide is compatible with Google Slides and other formats such as PDF, JPG, and PNG. The slide designs are available in both the sizes- standard(4:3) and widescreen(16:9).
-
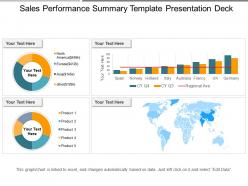 Sales performance summary template presentation deck
Presenting a PPT slide named Sales Performance Summary Template Presentation Deck. This PPT slide is Excel driven and easily customizable. The font style, the font color and the font size can be easily edited by a mere click. Access this presentation easily anywhere as it is compatible with Google Slides. You can convert and save this slide in PDF or JPG formats. Add or delete content from the given slide as per your convenience. You can add icons to make it more impressive. You can choose from thousands of high-quality icons.
-
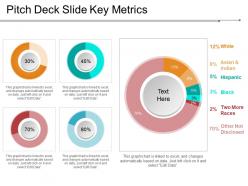 Pitch deck slide key metrics presentation images presentation layouts
Presenting the slide named Pitch deck slide key metrics presentation images presentation layouts. This template is professionally designed and is completely editable. The font color, font size, font style, background color, and color of the diagram can be altered as per your suitability. The text in the template can be replaced with your desired content. The slide is totally compatible with Google Slides and can be easily saved in JPG or PDF format. You can customize the template conveniently by changing the data in the excel sheet, as this template is Excel-linked. Editable icons make the presentation more presentable.
-
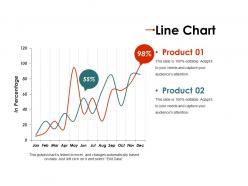 Line chart ppt presentation
Presenting Line Chart PPT Presentation. Customize the font type, size, background color, etc. according to your needs. It is available in both standard screen and widescreen ratio. The slide is compatible with Google Slides and can be saved in numerous formats such as JPG or document formats such as PDF without any problem.
-
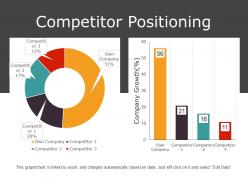 Competitor positioning presentation slides
Presenting competitor positioning presentation slides. This is a competitor positioning presentation slides. This is a two stage process. The stages in this process are competitor, own company, company growth, graph, donut.
-
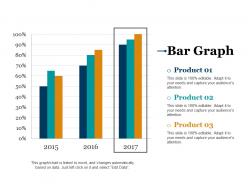 Bar graph powerpoint slide ideas
Presenting Bar Graph PowerPoint Slide Ideas. Customize the font color, font style, and font size. You can resize and reshape the icon as per your requirement. Change the color of the background. This slide is compatible with Google Slides. Convert and save this slide in PDF or JPG formats. It can be projected on a standard screen and widescreen size.
-
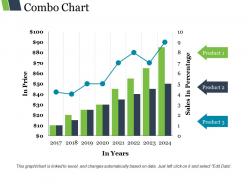 Combo chart ppt infographic template
Presenting combo chart ppt infographic template. This is a combo chart ppt infographic template. This is a eight stage process. The stages in this process are product, in years, bar graph, growth, in price.
-
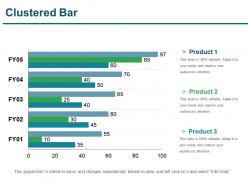 Clustered bar presentation ideas
Presenting clustered bar presentation ideas. This is a clustered bar presentation ideas . This is a five stage process. The stages in this process are financial, clustered bar, marketing, strategy, business.
-
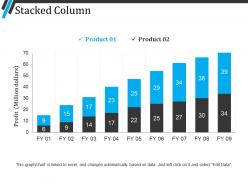 Stacked column powerpoint guide
Presenting stacked column powerpoint guide. This is a stacked column powerpoint guide. This is a two stage process. The stages in this process are stacked column, finance, marketing, strategy, analysis, business.
-
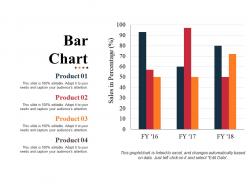 Bar chart example of ppt presentation
Presenting Bar Chart Example Of PPT Presentation. Our PPT layout is compatible with Google Slides. You can download this PPT theme in various formats like PDF, PNG, and JPG. This PowerPoint template is completely editable and you can modify the font size, font type, and shapes as per your requirements. This PPT slide is available in 4:3 and 16:9 aspect ratios.
-
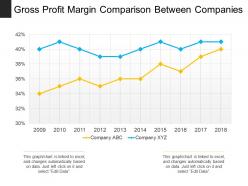 Gross profit margin comparison between companies
Presenting Gross Profit Margin Comparison Between Companies PPT theme which is fully customizable. This template is adaptable with Google Slides, which makes it accessible at once. You can change the colors, fonts, font size, and font types of the template as per the requirements. It can be converted into formats like PDF, JPG, and PNG. The slide is readily available in both 4:3 and 16:9 aspect ratio.
-
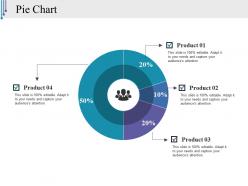 Pie chart ppt styles graphics template
Presenting pie chart PPT styles graphics template PPT slide. The graphical pie chart PowerPoint template designed professionally by the team of SlideTeam for developing different visual representations. The pie chart graphic slide is the data driven slide and the user can edit data as the slide gets linked with the Excel data sheet. The graphical pie chart template is customizable in PowerPoint as well as compatible with Google Slide so a user can share it on internet. You can make changes in the pie chart design template such as font size, font type, color and dimensions to plot cyclic events.
-
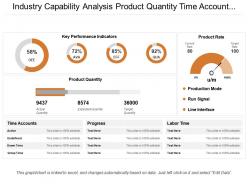 Industry capability analysis product quantity time account progress production rate
Design is highly versatile and business oriented. This excel linked PPT allows you to edit your business figures into excel sheet and get it automatically updated on PPT design charts. The slideshow is 100% editable; you can edit the design according to your business needs. Slides can instantly be downloaded as JPEG or PDF format. Slides are fully compatible with Google Slides and MS PowerPoint software.
-
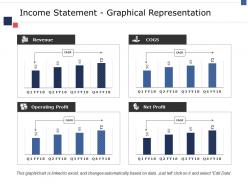 Income statement graphical representation ppt file shapes
Presenting this set of slides with name - Income Statement Graphical Representation Ppt File Shapes. This is a four stage process. The stages in this process are Revenue, Cogs, Operating Profit, Net Profit.
-
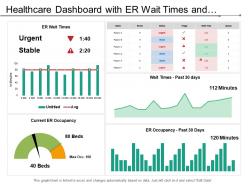 Healthcare dashboard with er wait times and patient in er
Presenting this set of slides with name - Healthcare Dashboard With Er Wait Times And Patient In Er. This is a five stage process. The stages in this process are Healthcare, Health Improvement, Medical Care.
-
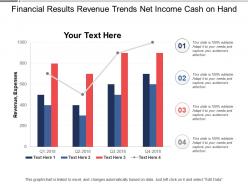 Financial results revenue trends net income cash on hand
Presenting this set of slides with name - Financial Results Revenue Trends Net Income Cash On Hand. This is a four stage process. The stages in this process are Financial Results, Financial Report, Accounting Results.
-
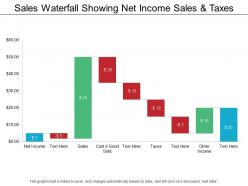 Sales waterfall showing net income sales and taxes
Presenting this set of slides with name - Sales Waterfall Showing Net Income Sales And Taxes. This is a nine stage process. The stages in this process are Sales Waterfall, Waterfall Chart.
-
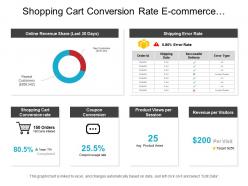 Shopping cart conversion rate e commerce dashboard
Presenting this set of slides with name - Shopping Cart Conversion Rate E Commerce Dashboard. This is a six stage process. The stages in this process are Mercantilism, Commercialism, Ecommerce.
-
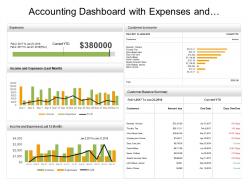 Accounting dashboard with expenses and customer balance summary
Stunning accounting dashboard with expenses and customer balance summary PPT template. Modify and personalize the presentation by including the company name and logo. Guidance for executing the changes has been provided for assistance. Easy and convenient downloading by following simple steps. Professional and business oriented PPT presentation slides. No concession with the quality, once opened on wide screen. Editable visuals, colors and text. Useful for sales leaders, marketers, business professionals, analysts, strategists, etc.
-
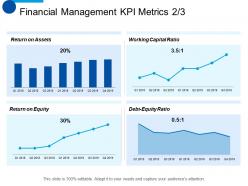 Financial management kpi metrics planning ppt summary background images
Presenting this set of slides with name - Financial Management KPI Metrics Planning Ppt Summary Background Images. This is a four stage process. The stages in this process are Return On Assets, Return On Equity, Working Capital Ratio, Finance, Planning.
-
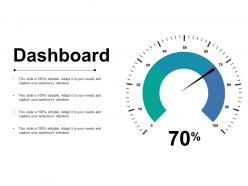 70 percentage ppt slides layout ideas
Presenting this set of slides with name - 70 Percentage Ppt Slides Layout Ideas. This is a four stage process. The stages in this process are Business, Management, Strategy, Analysis, Marketing.
-
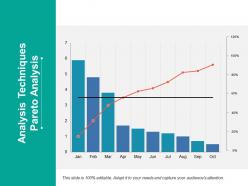 Analysis techniques pareto analysis ppt styles deck
Presenting this set of slides with name - Analysis Techniques Pareto Analysis Ppt Styles Deck. This is a two stage process. The stages in this process are Business, Management, Strategy, Analysis, Marketing.
-
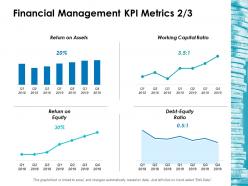 Financial management kpi metrics 2 3 ppt layouts deck
Presenting this set of slides with name - Financial Management Kpi Metrics 2 3 Ppt Layouts Deck. This is a four stage process. The stages in this process are Business, Management, Strategy, Analysis, Marketing.
-
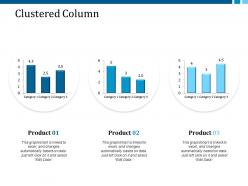 Clustered column ppt layouts summary
Presenting this set of slides with name - Clustered Column Ppt Layouts Summary. This is a three stage process. The stages in this process are Business,Management,Strategy,Analysis,marketing.
-
 Sales kpi tracker ppt professional graphics download
Presenting this set of slides with name - Sales KPI Tracker Ppt Professional Graphics Download. This is a seven stage process. The stages in this process are Finance, Analysis, Business, Investment, Marketing.
-
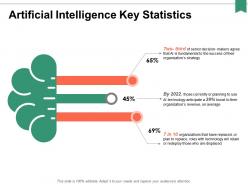 Artificial intelligence key statistics ppt powerpoint presentation portfolio gridlines
Presenting this set of slides with name - Artificial Intelligence Key Statistics Ppt Powerpoint Presentation Portfolio Gridlines. This is a three stage process. The stages in this process are Finance, Analysis, Business, Investment, Marketing.
-
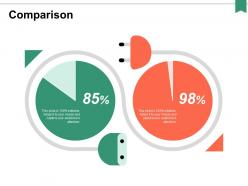 Comparison finance ppt powerpoint presentation portfolio slideshow
Presenting this set of slides with name - Comparison Finance Ppt Powerpoint Presentation Portfolio Slideshow. This is a two stage process. The stages in this process are Finance, Analysis, Business, Investment, Marketing.
-
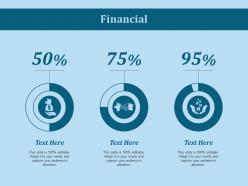 Financial ppt slides infographics
Presenting this set of slides with name - Financial Ppt Slides Infographics. This is a three stage process. The stages in this process are Business, Management, Strategy, Analysis, Icons.
-
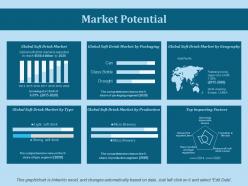 Market potential ppt slides background
Presenting this set of slides with name - Market Potential Ppt Slides Background. This is a six stage process. The stages in this process are Business, Management, Strategy, Analysis, Marketing.
-
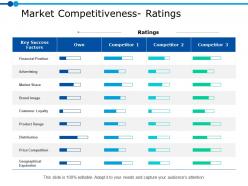 Market competitiveness ratings ppt powerpoint presentation gallery visual aids
Presenting this set of slides with name - Market Competitiveness Ratings Ppt Powerpoint Presentation Gallery Visual Aids. This is a four stage process. The stages in this process are Business, Management, Strategy, Analysis, Marketing.
-
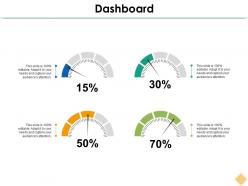 Dashboard Snapshot ppt inspiration files
Presenting this set of slides with name - Dashboard Snapshot Ppt Inspiration Files. This is a four stage process. The stages in this process are Business, Management, Strategy, Analysis, Marketing.
-
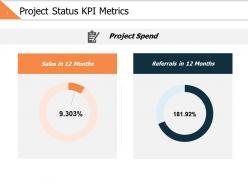 Project status kpi metrics ppt powerpoint presentation file slideshow
Presenting this set of slides with name - Project Status Kpi Metrics Ppt Powerpoint Presentation File Slideshow. This is a two stage process. The stages in this process are Business, Management, Strategy, Analysis, Marketing.
-
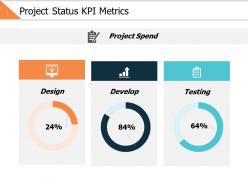 Project status kpi metrics slide2 ppt powerpoint presentation file slide portrait
Presenting this set of slides with name - Project Status Kpi Metrics Slide2 Ppt Powerpoint Presentation File Slide Portrait. This is a three stage process. The stages in this process are Business, Management, Strategy, Analysis, Marketing.
-
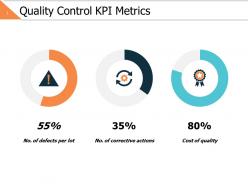 Quality control kpi metrics ppt powerpoint presentation gallery example
Presenting this set of slides with name - Quality Control Kpi Metrics Ppt Powerpoint Presentation Gallery Example. This is a three stage process. The stages in this process are Business, Management, Strategy, Analysis, Icons.
-
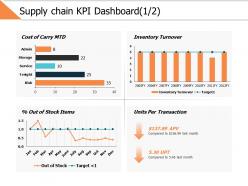 Supply chain kpi dashboard 1 2 ppt powerpoint presentation gallery slides
Presenting this set of slides with name - Supply Chain Kpi Dashboard 1 2 Ppt Powerpoint Presentation Gallery Slides. This is a four stage process. The stages in this process are Business, Management, Strategy, Analysis, Finance.
-
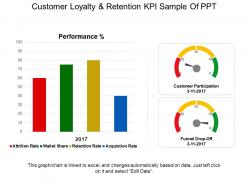 Customer loyalty and retention kpi sample of ppt
Presenting customer loyalty and retention kpi sample of ppt. This is a customer loyalty and retention kpi sample of ppt. This is a two stage process. The stages in this process are attrition rate, wallet share, retention rate, acquisition rate.
-
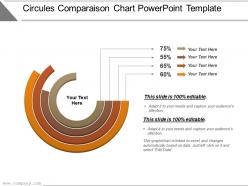 Circules comparaison chart powerpoint template
Presenting our circles comparison chart PowerPoint template. This is a circular process shown here, fit for use by managers, employees, and organizations. This PPT design is readily editable with winning color, layout, font type, font size, and text. Immediately convertible into pdf and jpg format. Following content is ready to apply to your rehashed data and is flexible, fit to be projected on a wide screen. This pattern is available in 4:3 and full-screen version 16:9. Use with Google Slides for ease of use. Download now, apply your ideas to start and save time.
-
 Business process improvement ideas powerpoint slide designs
Presenting business process improvement PPT slide template. This is exquisitely coordinated PPT design template beneficial for various business professionals. Easily resizable shapes, patterns, and matters etc. Genuine and admissible PPT Image with pliant data options. Adequately compatible with all operating software and all Google Slides. Easily convertible to PDF or JPG formats, unaffected high resolution PPT graphic when projected on a huge screen.
-
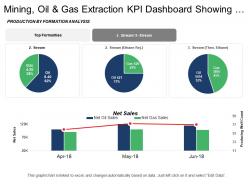 Mining oil and gas extraction kpi dashboard showing net sales and production by formation analysis
Presenting this set of slides with name - Mining Oil And Gas Extraction Kpi Dashboard Showing Net Sales And Production By Formation Analysis. This is a two stage process. The stages in this process are Mining, Oil And Gas Extraction, Refinery, Natural Gas.
-
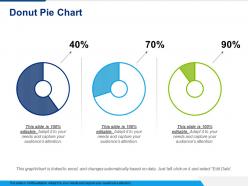 Donut pie chart powerpoint slide information
Presenting this set of slides with name - Donut Pie Chart Powerpoint Slide Information. This is a three stage process. The stages in this process are Business, Marketing, Chart, Percentage, Strategy.


