- Sub Categories
-
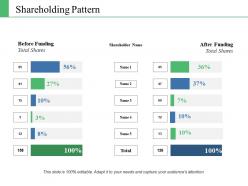 Shareholding pattern ppt infographic template slide download
Presenting this set of slides with name - Shareholding Pattern Ppt Infographic Template Slide Download. This is a six stage process. The stages in this process are Total Shares, Before Funding, After Funding, Shareholder Name.
-
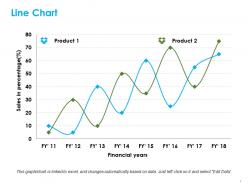 Line chart ppt summary templates
Presenting line chart PPT summary templates PPT slide. The line graph summary PowerPoint template designed by the professionals of SlideTeam to describe the huge amount of data. The run chart slide value gets edited as a user can link this slide with the Excel Sheet. The line chart summary slide is customizable in PowerPoint. The sale line graph example template is also compatible with Google Slide. A user can do modification such as font size, font type, color and dimensions in the run chart template to present the desired comparison between two things.
-
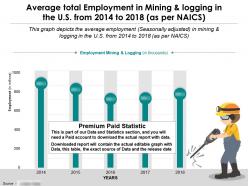 Average total employment in mining and logging in us from 2014-18 as per naics
Presenting this set of slides with name - Average Total Employment In Mining And Logging In US From 2014-18 As Per Naics. Average Total Employment in Mining AND logging in the US from 2014 to 2018 as per NAICS. This is part of our Data and Statistics products selection, and you will need a Paid account to download the actual report with accurate data. Downloaded report will contain the actual editable graph with the actual data, an excel table with the actual data, the exact source of the data and the release date. This Graph depicts the average employment Seasonally adjusted in mining AND logging in the US from 2014 to 2018 as per NAICS. It covers topic Average Total Employment in Mining AND logging in the US for region USA and is for date range 2014 TO 2018. Download it immediately and use it for your business.
-
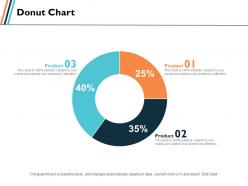 Donut chart investment ppt slides graphics template
Presenting this set of slides with name - Donut Chart Investment Ppt Slides Graphics Template. This is a three stage process. The stages in this process are Finance, Analysis, Business, Investment, marketing.
-
 Comparison ppt professional summary
Presenting this set of slides with name - Comparison Ppt Professional Summary. This is a two stage process. The stages in this process are Business, Management, Strategy, Analysis, Marketing.
-
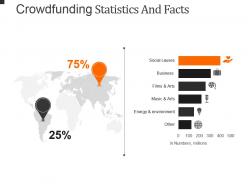 Crowdfunding statistics and facts powerpoint presentation examples
Presenting crowdfunding statistics and facts powerpoint presentation examples. This is a crowdfunding statistics and facts powerpoint presentation examples. This is a two stage process. The stages in this process are social causes, business, films and arts, music and arts, others.
-
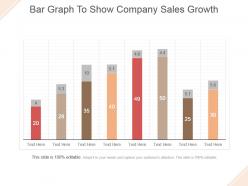 Bar graph to show company sales growth powerpoint slide themes
Presenting bar graph to show company sales growth powerpoint slide themes. This is a bar graph to show company sales growth powerpoint slide themes. This is a eight stage process. The stages in this process are business, marketing, bar graph, growth, management.
-
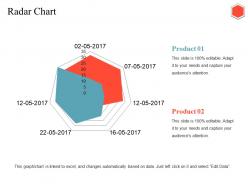 Radar chart ppt diagrams
Presenting this set of slides with name - Radar Chart Ppt Diagrams. This is a two stage process. The stages in this process are Radar Chart, Finance, Analysis, Management, Business.
-
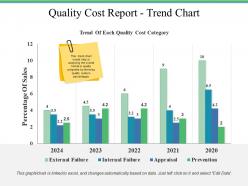 Quality cost report trend chart ppt file ideas
Presenting this set of slides with name - Quality Cost Report Trend Chart Ppt File Ideas. This is a five stage process. The stages in this process are Percentage Of Sales, Appraisal, Prevention, External Failure, Internal Failure.
-
 Dashboard snapshot ppt summary sample
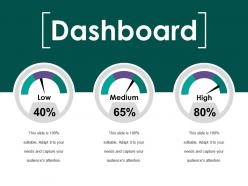
Presenting this set of slides with name - Dashboard Snapshot Ppt Summary Sample. This is a three stage process. The stages in this process are Dashboard, Business, Marketing, Process, Low.
-
 Dashboard snapshot ppt summary
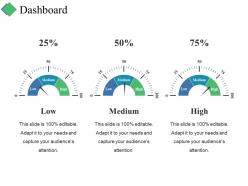
Presenting this set of slides with name - Dashboard Snapshot Ppt Summary. This is a three stage process. The stages in this process are Business, Marketing, Dashboard, Percentage, Process.
-
 Comparison ppt infographics background image
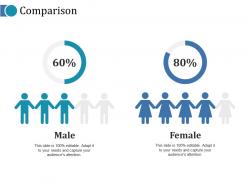
Presenting this set of slides with name - Comparison Ppt Infographics Background Image. This is a two stage process. The stages in this process are Male, Female, Comparison, Business, Finance.
-
 Summary financials revenue ebitda pat ppt model objects
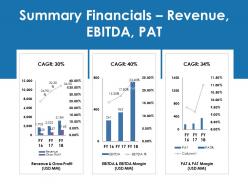
Presenting this set of slides with name - Summary Financials Revenue Ebitda Pat Ppt Model Objects. This is a three stage process. The stages in this process are Revenue And Gross Profit, Pat And Pat Margin, Ebitda And Ebitda Margin.
-
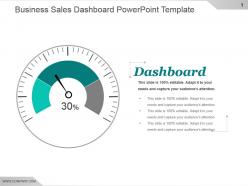 Business sales dashboard powerpoint template
Presenting business sales dashboard powerpoint template. This is a business sales dashboard powerpoint template. This is a one stage process. The stages in this process are dashboard, measurement, strategy, business, success.
-
 Market size info graphic powerpoint slide
Presenting market size info graphic powerpoint slide. This is a market size info graphic powerpoint slide. This is a two stage process. The stages in this process are market projected to reach, asia pacific, the largest market.
-
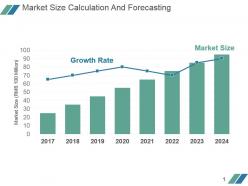 Market size calculation and forecasting powerpoint slide design ideas
Presenting market size calculation and forecasting powerpoint slide design ideas. This is a market size calculation and forecasting powerpoint slide design ideas. This is a eight stage process. The stages in this process are market size rmb, growth rate, market size.
-
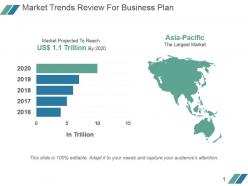 Market trends review for business plan powerpoint slide designs
Presenting market trends review for business plan powerpoint slide designs. This is a market trends review for business plan powerpoint slide designs. This is a two stage process. The stages in this process are market projected to reach us 1 1 trillion by 2020, in trillion, asia pacific the largest market.
-
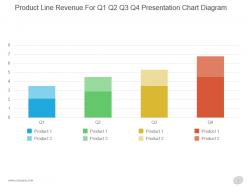 Product line revenue for q1 q2 q3 q4 presentation chart diagram
Presenting product line revenue for q1 q2 q3 q4 presentation chart diagram. This is a product line revenue for q1 q2 q3 q4 presentation chart diagram. This is a four stage process. The stages in this process are product, q.
-
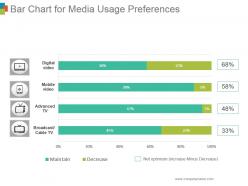 Bar chart for media usage preferences powerpoint slide rules
Presenting bar chart for media usage preferences powerpoint slide rules. This is a bar chart for media usage preferences powerpoint slide rules. This is a four stage process. The stages in this process are digital video, mobile video, advanced tv, broad cast cable tv.
-
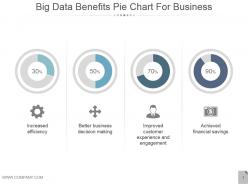 Big data benefits pie chart for business powerpoint show
Presenting big data benefits pie chart for business powerpoint show. This is a big data benefits pie chart for business powerpoint show. This is a four stage process. The stages in this process are increased efficiency, better business decision making, improved customer experience and engagement, achieved financial savings.
-
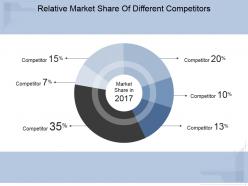 Relative market share of different competitors ppt diagrams
Presenting relative market share of different competitors ppt diagrams. This is a relative market share of different competitors ppt diagrams. This is a six stage process. The stages in this process are competitor, market share.
-
 Brand campaign performance analysis powerpoint graphics
Presenting brand campaign performance analysis powerpoint graphics. This is a brand campaign performance analysis powerpoint graphics. This is a four stage process. The stages in this process are business case brand, leads, sales, loyalty.
-
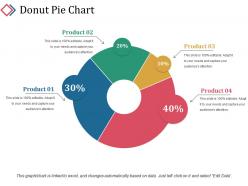 Donut pie chart powerpoint slide clipart template 1
Presenting donut pie chart powerpoint slide clipart template 1. This is a donut pie chart powerpoint slide clipart template 1. This is a four stage process. The stages in this process are product, donut pie chart, percentage, finance, business.
-
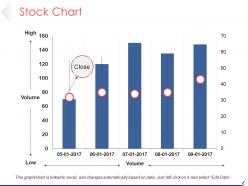 Stock chart presentation layouts template 1
Presenting stock chart presentation layouts template 1. This is a stock chart presentation layouts template 1. This is a five stage process. The stages in this process are high, volume, low, close, stock chart.
-
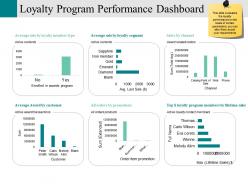 Loyalty program performance dashboard powerpoint slide designs
Presenting this set of slides with name - Loyalty Program Performance Dashboard Powerpoint Slide Designs. This is a six stage process. The stages in this process are Average Sale By Loyalty Member Type, Average Sale By Loyalty Segment, Sales By Channel, All Orders By Promotions, Average Award By Customer.
-
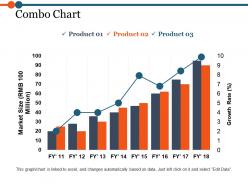 Combo chart powerpoint show
Presenting this set of slides with name - Combo Chart Powerpoint Show. This is a three stage process. The stages in this process are Bar, Marketing, Strategy, Finance, Planning.
-
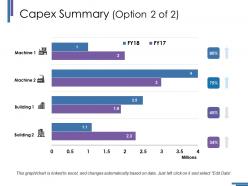 Capex summary ppt summary files
Presenting this set of slides with name - Capex Summary Ppt Summary Files. This is a four stage process. The stages in this process are Machine, Building, Millions, Percentage, Business, Marketing.
-
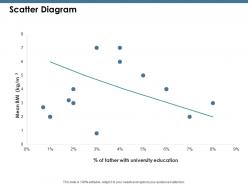 Scatter diagram ppt professional graphics download
This is a two stage process. The stages in this process are Management, Marketing, Business, Percentage, Product.
-
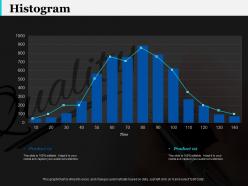 Histogram finance ppt infographic template infographic template
This is a two stage process. The stages in this process are Finance, Analysis, Business, Investment, Marketing.
-
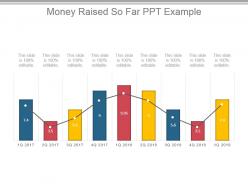 Money raised so far ppt example
Presenting money raised so far ppt example. This is a money raised so far ppt example. This is a nine stage process. The stages in this process are business, marketing, growth, rising, management.
-
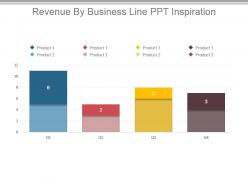 Revenue by business line ppt inspiration
Presenting revenue by business line ppt inspiration. This is a revenue by business line ppt inspiration. This is a four stage process. The stages in this process are business, management, marketing, revenue, inspiration.
-
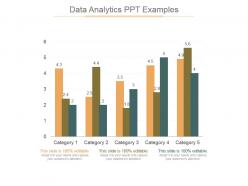 Data analytics ppt examples
Presenting data analytics ppt examples. This is a data analytics ppt examples. This is a five stage process. The stages in this process are data analytics, strategy, marketing, management.
-
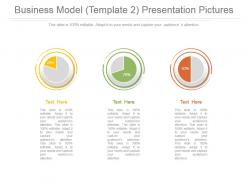 Business model with new market share analysis presentation pictures
Presenting business model with new market share analysis presentation pictures. This is a business model with new market share analysis presentation pictures. This is a three stage process. The stages in this process are percentage, process, business, marketing, strategy, management.
-
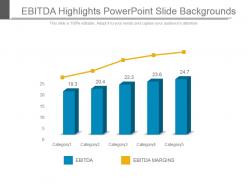 Ebitda highlights powerpoint slide backgrounds
Presenting ebitda highlights powerpoint slide backgrounds. This is a ebitda highlights powerpoint slide backgrounds. This is a five stage process. The stages in this process are ebitda, ebitda margins.
-
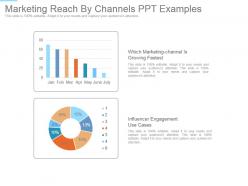 Marketing reach by channels ppt examples
Presenting marketing reach by channels ppt examples. This is a marketing reach by channels ppt examples. This is a two stage process. The stages in this process are which marketing channel is growing fastest, influencer engagement use cases.
-
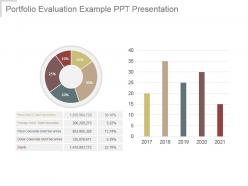 Portfolio evaluation example ppt presentation
Presenting portfolio evaluation example ppt presentation. This is a portfolio evaluation example ppt presentation. This is a two stage process. The stages in this process are peso govt debt securities, foreign govt debt securities, peso corporate debt securities, dollar corporate debt securities, equity.
-
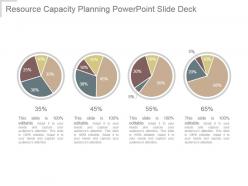 Resource capacity planning powerpoint slide deck
Presenting resource capacity planning powerpoint slide deck. This is a resource capacity planning powerpoint slide deck. This is a four stage process. The stages in this process are pie chart, planning, business, finance, marketing.
-
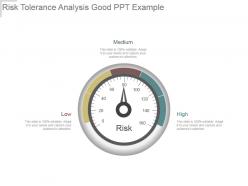 Risk tolerance analysis good ppt example
Presenting risk tolerance analysis good ppt example. This is a risk tolerance analysis good ppt example. This is a one stage process. The stages in this process are high, low, medium.
-
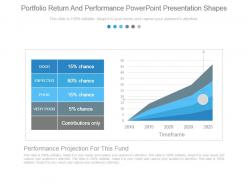 Portfolio return and performance powerpoint presentation shapes
Presenting portfolio return and performance powerpoint presentation shapes. This is a portfolio return and performance powerpoint presentation shapes. This is a two stage process. The stages in this process are good, expected, poor, very poor, contributions only, timeframe.
-
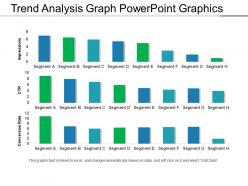 Trend analysis graph powerpoint graphics
Presenting Trend Analysis Graph PowerPoint Graphics.The designs are 100% editable in this PowerPoint template.The font size, font color, graphic colors, and slide background can be customized without any hassle. The users can add or remove the images according to their needs. This template is designed by keeping compatibility with Google Slides in mind. It is available in both standard and widescreen size.
-
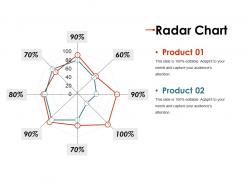 Radar chart presentation images
Presenting the Radar Chart Presentation Images template. The slideshow is fully editable in PowerPoint and other office suites. You can alter the font type, size, diagram color, background color, etc. according to the requirement. The template is also compatible with Google Slides and can be saved in multiple images or document formats such as JPG or PDF. High-quality graphics ensure that there is no room for distortion.
-
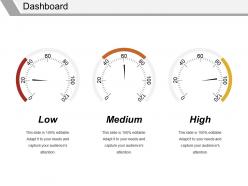 Dashboard snapshot powerpoint ideas
Presenting Dashboard Snapshot PowerPoint Ideas template. This slide with high quality graphics is completely editable and professionally designed. With an option to change the size, style, and color of the font, this slide is ready to use. You can alter the text and color of the diagram as well as the background as per your preference. The PPT slide is compatible with Google Slides, which makes it easily accessible. You can customize and save the file as JPG or PDF formats. You can avail this PPT slide in both standard as well as widescreen sizes.
-
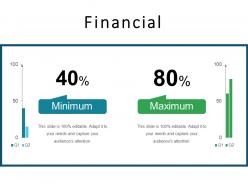 Financial ppt presentation examples
Presenting financial ppt presentation examples. This is a financial ppt presentation examples . This is a two stage process. The stages in this process are minimum, maximum.
-
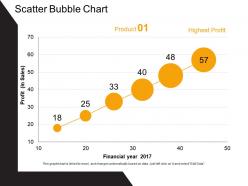 Scatter bubble chart powerpoint slide designs download
Presenting scatter bubble chart powerpoint slide designs download. This is a scatter bubble chart powerpoint slide designs download. This is a one stage process. The stages in this process are profit, financial year, highest profit, product.
-
 Android application development multimedia services
Presenting the Android Application Development Multimedia Services PowerPoint presentation. Modify the slideshow according to your needs. Add impressive data visualization tools like charts, graphs, tables, etc. The slide is also compatible with Google Slides and fully editable in MS PowerPoint. It can be saved into popular images or document formats like JPEG, PNG or PDF. Moreover, high-quality graphics will prevent distortion even when the user increases their size.
-
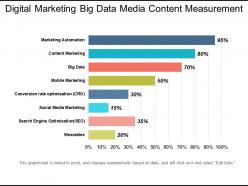 Digital marketing big data media content measurement
Presenting Digital Marketing Big Data Media Content Measurement PowerPoint slide. This easy to download PPT theme can be easily opened and saved in various formats like JPG, PDF, and PNG. You can alter the font size, font type, font color, and shape used according to your needs as this PPT layout is 100% customizable. This PowerPoint template is Google Slides compatible and is easily accessible.
-
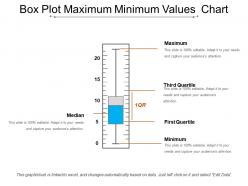 Box plot maximum minimum values chart
Presenting Box Plot Maximum Minimum Values Chart template. Add appealing content like charts and graphs to the presentation. This template supports both the widescreen (16:9) and the standard screen aspect ratios(4:3). The slide is also compatible with Google Slides. This slide can be converted into common image formats like JPEG, PNG or document formats such as PDF. High-quality graphics will prevent the deterioration of slide components.
-
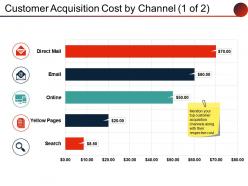 Customer acquisition cost by channel powerpoint ideas
Presenting customer acquisition cost by channel powerpoint ideas. This is a customer acquisition cost by channel powerpoint ideas. This is a five stage process. The stages in this process are direct mail, email, online, search, dollar.
-
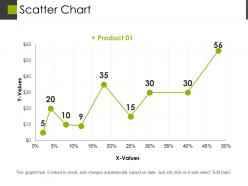 Scatter chart presentation outline
Presenting scatter chart presentation outline. This is a scatter chart presentation outline. This is a one stage process. The stages in this process are values, business, marketing, growth, strategy.
-
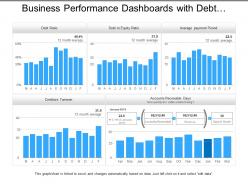 Business performance dashboards with debt equity ratio
Presenting, business performance dashboards with debt-equity ratio PPT deck, that can be used by businesses experts for their business performance indication Presentations. The issues and data shown in the flat design can be quickly edited in respect with color, text, and fonts by just by following few steps. The color and orientation of the elements can also be adjusted easily. This PPT slide is cooperative with Google Slides and can be obtained in pdf or jpeg format.
-
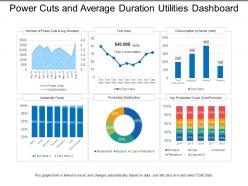 Power cuts and average duration utilities dashboard
Presenting this set of slides with name - Power Cuts And Average Duration Utilities Dashboard. This is a six stage process. The stages in this process are Utilities, Use, Advantage.
-
 Market trends report editable powerpoint chart
Presenting market trends report editable powerpoint chart. This is a market trends report editable powerpoint chart. This is a four stage process. The stages in this process are years, timeline, process, business, marketing.
-
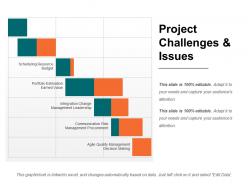 Project challenges and issues ppt diagrams
Presenting project challenges and issues PPT diagrams presentation slide. You can download this slide and then save into another format such as JPG and PDF and can also display in standard and widescreen view. A user can alter this slide such as color, text, font type, font size and aspect ratio. This slide gets synced with Google Slides and edit it in PowerPoint. You may share this template with large segment because it has great pixel quality. You can insert the relevant content in text placeholder of this slide.
-
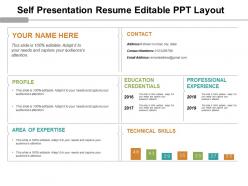 Self presentation resume editable ppt layout
Presenting self presentation resume editable PPT layout presentation template. You can download this template and save into another format such as JPG and PDF and can also display in standard and widescreen view. You can alter the slide such as color, text, font type, font size and aspect ratio. The template gets synced with Google Slides and customizable in PowerPoint. You may share this slide with large segment because it has great pixel quality. You can insert the relevant content in text placeholder of this template.
-
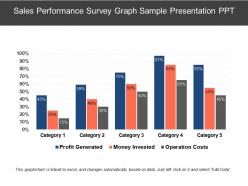 Sales performance survey graph sample presentation ppt
Presenting sales performance survey graph sample presentation PPT diagram. This fully featured PPT template can easily be updated by anyone. Change the font type, color, size, shape, style, background and other important components. Easy and quick downloading is available. Design can be downloaded into JPEG and PDF formats. You can open PPT design with Google Slides and PowerPoint. Both standard and wide screen views are available.
-
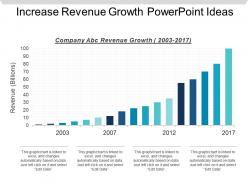 Increase revenue growth powerpoint ideas
Presenting increase revenue growth PowerPoint ideas slideshow. This is an eye-catching template for marketing professionals, entrepreneurs, business managers, and big companies. This slideshow allows you easy data entry options to put in the company logo, brand or name. The image quality of this template does not change even when you resize the image or portray on big screens. This is an easily adjustable layout to keep everyone on track and on time. User can edit the data in linked excel sheet and graphs and charts gets customized accordingly.
-
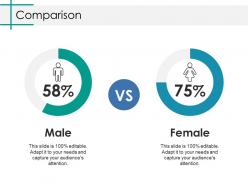 Comparison ppt inspiration slides
Presenting this set of slides with name - Comparison Ppt Inspiration Slides. This is a two stage process. The stages in this process are Male, Female, Finance.
-
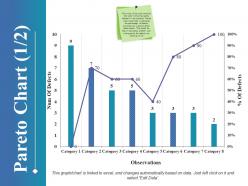 Pareto chart ppt styles graphics example
Presenting Pareto chart PPT styles graphics example PPT slide. The Pareto graph style PowerPoint slide designed by the professional team of SlideTeam is useful for illustrating the count of detects. The Pareto chart graphic style template is the data driven template and you can edit the value as the slide gets linked with the Excel data sheet. The graphical Pareto chart style slide is customizable in PowerPoint as well as compatible with Google Slide so a user can share it with others. A presenter can modify the visual Pareto chart template such as font size, font type, color and dimensions of graphs to make the concepts easier for the viewers.
-
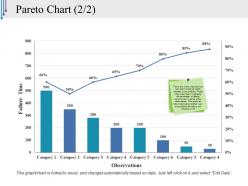 Pareto chart ppt styles graphics pictures
Presenting Pareto chart PPT styles graphics pictures PPT slide. The graphical Pareto chart PowerPoint slide designed professionally by the team of SlideTeam is useful for plotting the data in declining order. The Pareto chart graphic template is the data driven template and the user can edit the value as the slide gets linked with the Excel data sheet. The graphical Pareto chart slide is customizable in PowerPoint along with that this template is compatible with Google Slide so a user can share it with others via the internet. You can modify the visual Pareto chart template such as font size, font type, color and dimensions of icons to make the concepts easier for the viewers.
-
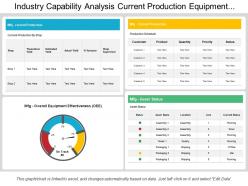 Industry capability analysis current production equipment effectiveness schedule
Presenting this set of slides with name - Industry Capability Analysis Current Production Equipment Effectiveness Schedule. This is a four stage process. The stages in this process are Industry Capability Analysis, Industry Potential Analysis, Industry Competency Analysis.


